The swelling middle class in emerging economies has received much attention in recent years, as it well should. The implications of its rise are far-reaching, from expanding economic opportunity to transforming the political landscape in some of the world’s most populous countries. Measuring the middle class, however, is no easy task. There is no widely accepted definition of what constitutes the middle class, and the commonly used income-based measures suffer from a number of deficiencies.
Yet, there is an easy-to-understand and as-yet-overlooked metric available: the number of passenger cars in circulation can act as a direct measure of the middle class in developing countries.1 Whereas in advanced countries, even households classified as poor own cars, in developing countries, car ownership is almost synonymous with at least middle-class status. It separates those with the ability to purchase nonessentials from the wider population. Moreover, car statistics are generally reliable and frequently updated and contain information by type of car that can be used to further segment the middle class.
Much can be learned about the middle class in developing countries by examining those statistics, including where and how rapidly the middle class grew in the previous year and, by examining the types of cars sold, how different groups in the middle class (lower, upper, and so on) are faring. According to the car index, many more people in developing countries have reached middle-class status than the most commonly used income measure would suggest. Moreover, data indicate that after people pass a certain income threshold, levels of car ownership rise rapidly. And with approximately 70 developing countries—about 4 billion people in total—near or above that threshold, the middle class is growing more rapidly than previous measures indicate. It is likely that very large numbers of people will enter the middle class in the coming years.
The number of passenger cars in circulation can act as a direct measure of the middle class in developing countries.
This has important implications for businesses and for policymakers. Everything from material conditions in cities to the quality thresholds for government services in infrastructure or education as well as standards for political accountability and representation are being transformed. At the same time, enormous business opportunities are arising for firms in advanced countries as the new middle class demands goods and services those companies have long provided in their home markets. While cars in circulation are not a perfect measure of the rise of the middle class in developing countries, we believe they provide a more reliable and articulated measure of it than anything else available, and they point unequivocally to an extraordinarily challenging period for many developing countries.
The main purpose here is to identify the number of people who can afford nonessential products and services and are likely to place greater demands on governments. “Middle class” is therefore used as a shorthand for all people whose income is above a certain threshold, so including all those at the top of the income distribution. Bearing in mind that only a tiny minority of people in developing countries could be categorized as “rich” under any reasonable definition, including or excluding them as “middle class” would not significantly change the conclusions of this analysis.
Defining the Middle Class
The rise of a global middle class is a very real phenomenon.2 By the most commonly used definition, there are an estimated 369 million people in G20 developing countries who are currently considered middle class, though that number may indeed be underestimated. In comparison, there are about 1 billion members of the middle class residing in advanced countries according to the same most commonly used definition.3
The developing world in particular is changing rapidly on this front. A decade ago, 83 percent of the world’s population—or 5.1 billion people—lived in developing countries, yet they accounted for only 18 percent of global private consumption. Today, the developing world’s share of the global population is at 85 percent, but its share of global private consumption has jumped to nearly 30 percent. Private consumption in developing countries has been growing at about three times the rate of advanced countries, which is reflected in rapid growth of demand not just for necessities such as wheat but also for less essential items such as meat, toothpaste, cell phones, and air conditioners that very few people in developing countries could previously afford.
Today, the developing world’s share of global private consumption has jumped to nearly 30 percent.
Political scientists are particularly interested in the topic because it is believed that a large middle class (as distinct from a situation where there are few elite people, many poor people, and few people in the middle) is associated with greater political awareness, a desire for more accountable and representative government, and even a demand for market reforms—liberal democratic ideals.4 Economists and market analysts, meanwhile, are mainly interested in the size of the middle class as an indicator of the ability to purchase items that go beyond the bare necessities.
The swelling middle class in emerging economies thus has the potential not only to transform the economic balance of power across the globe but also political relations within and between countries. Moreover, insofar as the middle class everywhere insists on increased representation, the growing middle class in emerging economies could also lead to a greater convergence of values across the world and facilitate international agreements in areas ranging from environmental protection to an open and secure Internet to visa-free zones. Some have argued that democracies tend not to go to war against other democracies,5 so the rise of a global middle class and concurrent spread of liberal democratic principles may also reduce the incidence of international conflict.
A Confused and Incomplete Picture of the Middle Class
Despite the implications of this rise, analysts have found it difficult to put a fine point on exactly what the middle class is.6 At its broadest, the middle class is defined as anyone who is not poor, which according to the World Bank convention means having an income in excess of $2 a day or $60 per month at U.S. prices in purchasing power parity terms (PPP). That level is now achieved by more than 4 billion of the world’s 7 billion people, of whom about 3 billion reside in developing countries.7 While many people earning $2 a day are able to afford a cell phone, that level of income is far too low to afford amenities associated with the middle class in advanced countries. There are nearly 6 billion cell phone subscriptions in the world today, of which about 4 billion are in developing countries—still, many of those cell phone owners in the developing world do not have access to a regular power supply or clean water, for example. This definition of the middle class clearly places the bar too low.
At its narrowest, the middle class is defined as individuals who earn close to and above the median income in advanced countries—$31,000 per capita in U.S. prices, or roughly $85 a day. Only about 800 million people—12 percent of the world’s population—live in countries whose average per capita income is above that threshold, and only a tiny minority in developing countries would qualify. Moreover, $31,000 is seven times larger than the income various market studies indicate is needed to buy a car, for example, not to mention most other big-ticket consumer items.8 This definition of the middle class is far too narrow and clearly places the bar too high.
Many other measures have been proposed in between these extremes. The most widely used measure was proposed in 2002 by Branko Milanovic and Shlomo Yitzhaki (referred to as Milanovic-Yitzhaki going forward). They set the lower and upper bounds of the global middle class at the average annual incomes of Brazil ($4,000) and Italy ($17,000) in 2000, all expressed at international prices. These use prices in the United States in 2000 as a reference and thus adjust for differences in purchasing power across countries, so earning a dollar a day in India, for example, signifies a much higher purchasing power than earning a dollar in the United States, where prices are much higher. Purchasing power parity exchange rates reflecting these price differences are used to convert earnings in different currencies into an internationally comparable level of income. Thus, Milanovic and Yitzhaki propose to count people with daily incomes of between roughly $10 and $50 a day in 2000 PPP as middle class.9 Those with average incomes higher than $17,000 are considered part of the “rich” class, but they happen to represent only a tiny minority in developing countries, typically 1–3 percent of the population, rising to some 5 percent of the population in the better-off and most unequal developing countries such as Brazil and Mexico.
Using household survey data, the middle class so defined in the developing G20 economies—China, India, Russia, Brazil, Mexico, Argentina, Indonesia, Turkey, and South Africa—which account for 60 percent of the population and 70 percent of the income of all developing economies, is estimated to have numbered 369 million in 2009. By comparison, there were about twice as many people in those countries living in absolute poverty, that is, on less than $1.25 PPP a day, and only 33 million people had incomes above $50 a day. Moreover, based on economic growth projections and extrapolation of the income distribution, that middle-class number is expected to almost quadruple by 2030, implying an average annual rate of growth of 5.8 percent of people in the middle class in those countries—a rate of increase that easily outstrips their projected per capita income growth. According to these projections, by 2030, the share of developing economies in the global middle class, currently at 24 percent, will have overtaken the share of advanced countries—a shift in relative wealth of historic proportions.
Income based measures of the middle class not only suffer from arbitrariness and major inconsistency but are also subject to a number of serious measurement problems.
However, as indicators of demand for various types of nonessential consumer goods, income-based measures of the middle class not only suffer from arbitrariness and major inconsistency but are also subject to a number of serious measurement problems. First, they are based on infrequently conducted household surveys that vary enormously in quality and can suffer from various types of errors and bias, including the fact that wealthier households may for many reasons want to understate their income, while poorer households may overstate it. (Many households may also be unable to compute their income.) Second, incomes, even when adequately measured, do not directly reflect private consumption. The share of taxation and government spending in GDP varies greatly, for example, and households in different countries and at different levels of income exhibit very different savings behavior. (Think of poor and high-savings China at one end and rich and low-savings United States at the other.)
Third is the enormous challenge of measuring incomes at comparable prices to arrive at purchasing power across different levels of development. As indicated above, PPP exchange rates take U.S. prices as their base. Using the World Bank’s definition of the non-poor, can one afford even the most basic food and shelter in the United States on $2 a day or $60 a month? No. As it happens, the U.S. poverty line is $13 a day. Another example of difficulties in arriving at comparable incomes is the ongoing controversy over China’s appropriate PPP exchange rate. China’s GDP was recently revised downward by about 40 percent based on new methods for measuring cost of living in the country, adding millions of households to the poverty count. For large countries such as China, India, Brazil, and Russia, enormous price differences across regions make the use of one deflator to compare incomes across countries especially problematic.
An independent, and much less error-prone, way of measuring the middle class is clearly needed. At a minimum, it could act as a check on the income-based measures, but it could also be a means to obtain more detailed and timely information.
The Car Index
The number of passenger cars in circulation can be used as a proxy to estimate the number of people in developing countries who belong to the middle class.10 (“Middle class,” to reiterate, unless otherwise specified, is used to denote all people whose purchasing power exceeds a certain threshold, be they middle class or rich.) While one can define the middle class in many ways, ownership of a car, a big-ticket item, is an unambiguous indication of the ability to purchase other high-ticket consumer items—a sign that a household has reached middle-class status. Indeed, while the vast majority of households own a car in advanced countries, and many own more than one, in developing countries owning a car symbolizes relative affluence. Moreover, the number of cars in circulation, based on annual registration, is a generally reliable and timely statistic. Because registration requires the payment of an annual fee, this tends to ensure that only cars that remain in circulation are reported in the statistics.
At first blush, the car index may seem to omit from the count households that can afford other nonessential, big-ticket items—a computer, a television set, an air conditioner—but not a car. However, bearing in mind that in developing countries, cars in circulation include many cars of very old vintage—the average passenger car in India is twenty years old, compared to eleven years in the United States, and many cars are much older—this supposed omission is not nearly as large as it seems. In the United States, for example, one can buy a twenty-year-old Ford Taurus for about $500, roughly the price of a new computer or television set. So, even for the purpose of assessing potential demand for many less-expensive consumer products, the ability to buy a twenty- or a thirty-year-old car (not unusual in developing countries) provides a relatively good benchmark.11
Cars in circulation may overstate the number of middle-class households because some households will own more than one car. However, given that only a tiny minority of households in the G20 developing countries achieve an income level above that of Italy’s median income in 2000 (Milanovic-Yitzhaki’s upper bound for the middle class when less inclusively defined),12 it seems plausible to assume that very few households in developing countries can afford to buy more than one car. An informal survey we conducted of World Bank economists suggests that no more than 1 percent of households in poor countries and no more than 5 percent of households in middle-income developing countries own more than one car, which is well within the margin of error of these calculations. And a small number of passenger cars may be purchased by businesses, and some operate as taxis, whose drivers (and often owners), however, would probably be part of the middle class. Cars in circulation may understate the number of middle-class households as some households that can afford a car might not buy one.
Though not perfect, we believe that cars in circulation provide a relatively good measure of the number of middle-class households. But to arrive at the number of individuals, one has to adjust for household size. To do so, we use average household size for each country. In 2010, there were about 160 million cars in circulation in G20 developing countries. After accounting for household size, the car index suggests that the middle class in developing G20 countries is in the range of 550 million to 600 million people—about 50 percent larger than the number arrived at using the Milanovic-Yitzhaki lower bound of $4,000 PPP.13
For some countries, such as China and Argentina, the estimate of the size of the middle class according to the car index closely matches that arrived at using the Milanovic-Yitzhaki method, but it yields a much larger estimate of the size of the middle class for most others as seen in table 1 below. The estimate of the middle class using cars in circulation is much larger in India, Brazil, Mexico, and Indonesia, for example, than suggested by the Milanovic-Yitzhaki method.
One source of difference may be the fact that middle-class households tend to be smaller in some countries. In India, for example, the average size of middle-income households is 4.3 people, compared with 5.3 for all households. That would account for about one-quarter of the difference between the two measures for India in table 1. However, in two other major economies for which data are available, Brazil and China, the difference in family size between middle-income households and the national average is very small.14
Ranking developing countries based on their cars in circulation suggests that the popular preoccupation with BRICs (Brazil, Russia, India, and China) provides for a very incomplete picture of the middle class in emerging economies. Mexico, for example, has more cars in circulation than India, and countries such as Indonesia and Malaysia have nearly as many cars in circulation as India. And there are more cars in circulation in Iran, Turkey, and Argentina than in South Africa, the latest addition to the BRICS.
However, ranking the middle class based on cars in circulation yields results broadly in line with ranking countries based on the Milanovic-Yitzhaki calculation, placing China, India, Russia, Brazil, and Mexico at the top. Other studies have found broadly similar results. For example, an OECD study lists Russia, China, Mexico, and Brazil as countries with the largest total middle-class consumption.15
Car ownership per capita remains low in China and India compared to other emerging economies at similar income levels. In China, this may be due to stringent vehicle registration regulations and the low share of household consumption in GDP (36 percent of GDP and among the lowest in the world).16 In India, the difference may be partly explained by the high import tariff on passenger vehicles and the predominance of domestically produced two-wheelers that are not included in passenger vehicle counts: In 2002, there were 37 million mopeds and motorcycles on the streets of India. This suggests that the middle class may be even larger in China and India than is suggested by the car index.
In a broad sample of rich and poor countries, as one would expect, the correlation between the cars in circulation per 1,000 people and per capita income is high at 0.77; for per capita consumption, the correlation is also high at 0.79 (see figure 1 below).17 Reflecting in part differences in the income distribution, the correlation is far from perfect, however. For example, both Mexico and Romania have a per capita income of around $14,500. But Mexico’s income distribution is highly unequal and the country has only 107 cars per 1,000 people. Romania, meanwhile, where the income distribution is relatively equal, has 187 cars per 1,000 people. Thus, the middle class (with cars in circulation acting as a proxy) is larger in relatively equal societies, controlling for income.18 This is seen across a number of countries. Generally, more equal Central and Eastern European countries, such as Lithuania and Latvia, have higher car ownership than less equal Latin American countries with comparable consumption per capita, such as Chile.
A closer look at the data across a large number of countries supports this relationship between cars in circulation and income inequality. The regression of cars per capita on income per capita and the Gini coefficient—a measure of income inequality that ranges from 0 to 1, with 0 representing complete income equality—shows that the number of cars per capita and the value of the Gini coefficient are strongly negatively correlated. That indicates that countries with highly unequal income distributions (high Gini coefficients) tend to have fewer cars per capita. But income and income distribution are not the only factors at play in explaining car penetration. For example, small, rich economies such as Singapore and Hong Kong have much lower car penetration rates relative to their per capita consumption, presumably reflecting space restrictions and policies discouraging car ownership. In fact, controlling for income and distribution of income, population density and cars per capita are negatively and significantly correlated: Countries with high population densities tend to have lower levels of car ownership (see appendix).
Demand for Cars and Growth of the Middle Class
A comparison of estimates of the global middle class using the car index and the Milanovic-Yitzhaki method suggests that the middle class in developing countries is growing much more rapidly than previously understood. For example, according to a World Bank report issued in 2007, the global middle class in developing economies was projected to grow annually by 4.5 percent between 2005 and 2030,19 but this is less than half of the 10.3 percent average annual growth of cars in circulation in developing countries from 2006 to 2010, years that included a deep global downturn not anticipated in the World Bank long-term projections. A later study employing the Milanovic-Yitzhaki definition projects that the middle class in China, India, and Russia will grow by 9.4 percent, 5.8 percent, and 2.4 percent, respectively, on average annually between 2009 and 2030.20 Again, such projected growth rates are much slower than the annual growth of cars in circulation in these countries. From 2006 to 2010, those car growth rates stood at 33 percent in China, 13.2 percent in India, and 6.7 percent in Russia. At this rate, the middle class is doubling every 2.2 years in China, every 5.3 years in India, and every 10.5 years in Russia.
Indeed, the ranks of the global middle class appear poised to swell considerably in the coming years across a large number of developing countries. The relationship between cars in circulation per capita and per capita income is sharply nonlinear, which means that vehicle ownership grows slowly at very low levels of national income, then accelerates as incomes cross a certain threshold, and then slows again as incomes rise to very high levels, when car ownership approaches 100 percent of households. An examination of more than 60 countries for which data are available suggests that the threshold at which car ownership accelerates is around $3,400 PPP, and it decelerates sharply once national income per capita exceeds $25,000.21 In terms of the size of the middle class, this makes sense—few people are added to the middle class as incomes begin to grow from very low levels, and similarly few people are added to the middle class at very high levels of income since a large share of the population is already affluent.
Between 1996 and 2010, in countries with average per capita income below $3,400, the average income elasticity of car ownership was 0.6. Between $3,400 and $10,000, the average income elasticity of car ownership was 1.9, and it was 1.6 in the range $10,000 to $25,000. By the time a country reached an income level of $25,000, this average income elasticity declined to 0.9 (see figure 2). At that point, demand decreases, and increases in income do not necessarily lead to car purchases. The vast majority of the population is affluent and has purchased (or has access to) a car, and most households have more than one car.22
Among countries with per capita income less than $3,400, Indonesia is a major exception; the number of cars per capita in Indonesia grew, on average, more than five times as fast as its per capita income between 1996 and 2010. This may reflect underestimated income in Indonesia or data errors in measuring cars in circulation, or it may be the result of policies implemented to greatly expand the availability of consumer credit and the use of leasing arrangements. In addition to Indonesia, Mexico and Brazil have registered very high elasticity of vehicle ownership relative to income in recent years. This may reflect an unusually large surge in their middle classes or factors such as liberalization of import motor vehicle rules and the expansion of consumer credit. Some Eastern and Central European economies, such as Estonia and Bulgaria, have low elasticity of vehicle ownership relative to their income. That is in part because they have somewhat high initial vehicle penetration rates relative to their income levels, reflecting their more equal income distribution.
About 70 developing countries home to 4 billion people (including China and India) lie in a per capita range of $3,400 and $10,000, suggesting that the affluent class as a share of the total population is likely to grow especially rapidly in coming years. In 2010 alone, the BRICs added about 14 million cars to their total cars in circulation—implying, adjusting for household size, that about 46 million people were added to their affluent class, roughly the population of Spain. The BRICs also accounted for more than half of global increase in cars in circulation in 2010. It is clear that in recent years, almost all of the world’s new middle class was added in the developing world; between 2006 and 2010, nine of the ten countries with the largest increases in cars in circulation were developing countries (see figure 4).
In contrast to emerging economies, there was little or no addition to the number of passenger cars in circulation in advanced countries. And given the stagnation in both population and incomes in many advanced countries in recent years, and the fact that the income distribution there is tending to become more skewed toward top earners, the number of people in the middle class (under any credible definition) in advanced countries is unlikely to be increasing significantly and may even be declining.23 Still, the bulk of the purchasing power of the middle class today resides in advanced countries. This is also evident in car statistics, for example: in 2010, advanced countries accounted for nearly 70 percent of the global passenger cars in circulation, and cars in circulation were, on average, of much more recent vintage than in developing countries as discussed above. In contrast to emerging economies, there was little or no addition to the number of passenger cars in circulation in advanced countries.
The combination of high income elasticity of car demand in the developing-country income range and rapidly rising incomes contributes to extremely rapid growth of car sales in developing countries.
New car registrations provide timely information about the growth of the middle class in developing countries. Though new car registrations are not the same as the change in cars in circulation, since some cars are scrapped, in the developing world scrappage rates are very low, so new registrations closely approximate the addition to cars in circulation. The combination of high income elasticity of car demand in the developing-country income range and rapidly rising incomes contributes to extremely rapid growth of car sales in developing countries.
In 2010, new passenger car sales in BRICs—around 16 million—were six times larger than average annual sales in those countries in the 1990s. Moreover, eight of the top ten countries with absolute increases in the number of new car sales in 2010 were emerging economies, with China, India, and Russia seeing the largest increases. In China and India, new car registrations in 2010 represented 27 percent and 14 percent, respectively, of cars in circulation. The extraordinary growth in car sales in emerging economies has come despite high import tariffs on cars—which range from 5 percent in Russia to 38 percent in Mexico and 57 percent in India, compared to 2.5 percent in the United States and 0 percent in Japan.
In contrast, new registrations in the United States represented 5 percent of existing car stocks, and in Canada, 3 percent. And new registrations were offset by the high scrappage rates in advanced countries—5 percent in the United States and 5.6 percent in Germany, for example, compared to about 1 percent in China and Russia.
This divergence in the trend of car sales is unlikely to fade anytime soon. The International Energy Agency’s forecasts, for example, indicate that car registrations in developing countries will more than triple between 2005 and 2030, implying growth of 5 percent a year, well in excess of per capita income growth.24 Meanwhile, registrations will only edge upward in advanced economies.
Judging by the car index, the middle class in developing economies is just in its infancy, and the untapped potential for the rise of the middle class in developing countries is most clearly evident from comparisons of car ownership levels. In 2009, the number of cars per 1,000 people in India and China was just 12 and 34, respectively, compared to 510 in Germany, for example (see figure 5 below). Even if the rate of growth of passenger cars in circulation in China and India remains very high—such as the near 10 percent average annual growth rate projected by the International Energy Agency for these two countries—it would take about twenty-five years for China and more than forty years for India, where the number of cars in circulation is much lower and population growth is higher than China, to reach the current penetration rates in advanced countries.
Implications for Policy
The fact that many developing countries are near or above the key middle-class threshold suggests that the number of affluent people will continue to rise much more rapidly—about twice the rate over many years to come—than aggregate per capita income, which is itself rising rapidly. This observation has important implications for firms in advanced countries since many are either selling products to the middle class directly or selling the machines, software, and business services that firms in developing countries need to produce for their burgeoning middle class. Trade agreements struck with developing countries—where tariffs are higher to start with—may yield more gains for advanced-country exporters than is generally understood, at least over the next several years.
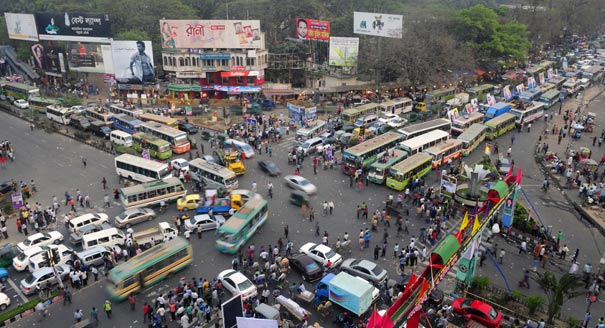
Moreover, the fact that in recent years the middle class has grown much more rapidly than per capita income levels suggest, implies that policymakers in middle-income developing countries are having to contend with more urban and airport congestion and carbon emissions, for example, than would be deduced from aggregate growth statistics. Similarly, the demand for items the middle class consumes and demands from government—from advanced education to health services—is also exploding. These new demands are likely to be especially prevalent in countries where per capita income is still quite modest (near $3,400 PPP and above), but these are countries where tax revenues are typically low as a share of GDP and where the government’s administrative as well as fiscal capacity to satisfy such demands is limited (see table 2 below).
Insofar as the burgeoning middle class also increases the pressure on governments to be representative and accountable, the gap between expectations and government capacity is likely to become even larger. Against this background, the incidence of protests and the restlessness of populations from China, Thailand, and the Arab world to Russia and Chile is perhaps not surprising.
The growth of the middle class is more likely to be in line with that of per capita income in wealthier and more equal developing countries, such as those in Eastern Europe, where car penetration and the size of the middle class as a share of the total population are already high. Governments in those countries should also be better able to cope with challenges associated with the rise of the middle class.
Conclusions and Further Considerations
Income-based measures tend to underestimate the middle class’s size and growth rate in many developing countries, sometimes dramatically so. The car index is a relatively easy-to-understand, and more reliable, gauge of the size and growth of the middle class in the developing world. Statistics on cars in circulation show clearly that the middle class in developing countries remains in its infancy. Despite the middle class’s rapid growth, it will take emerging economies a generation or two before the incidence of the middle class in the total population resembles that of the advanced economies.
There is much work to do to refine the car index as a measure of the middle class in developing countries. Estimates of household size for middle-class families, the share of cars that are used for business use, and the share of households that own more than one car can all be refined. In countries where car registrations are available by province or region, the car index could also be used to shed light on the size of the middle class within countries and how it varies, for example, between coastal and inland regions. Segmentation of cars in circulation by price category could also be used to arrive at finer measures of the middle and rich classes, including the geographic location, size, and growth of different groups.
While cars in circulation are certainly not a perfect measure of the rise of the middle class in developing countries, they point unequivocally to an extraordinarily challenging period ahead for governments, especially in middle-income developing countries.
While cars in circulation are certainly not a perfect measure of the rise of the middle class in developing countries, they point unequivocally to an extraordinarily challenging period ahead for governments, especially in middle-income developing countries. Their revenues will grow, but demands on them will grow even more rapidly. Many companies will see wide new business horizons open to them. The large passenger car companies, which are perhaps the most emblematic manifestation of the industrial might of advanced countries, have been rapidly reorienting their sales efforts and relocating their manufacturing toward the emerging markets. But in their quest to find the new global middle class, they are only among the path breakers, with their suppliers and thousands of other enterprises sure to follow in their footsteps.
1 In this study, unless otherwise specified, cars refers to passenger vehicles, defined by the World Bank as road motor vehicles, other than two-wheelers, intended for the carriage of passengers and designed to seat no more than nine people.
2 Uri Dadush and William Shaw, Juggernaut: How Emerging Markets Are Reshaping Globalization (Washington, D.C.: Carnegie Endowment for International Peace, 2011).
3 The most commonly used measure was proposed by Branko Milanovic and Shlomo Yitzhaki and sets the lower and upper bounds of the global middle class at the average annual incomes of $4,000 and $17,000 in 2000 PPP.
4 A. Banerjee and E. Duflo, “What Is Middle Class About the Middle Classes Around the World?” MIT Department of Economics Working Paper 07-29, 2007.
5 See Michael Doyle, “Kant, Liberal Legacies, and Foreign Affairs,” Philosophy and Public Affairs, vol. 12, no. 3 (Summer 1983): 205, 207‒208.
6 Nancy Birdsall, “Oops: Economists in Confused Search for the Middle Class in the Developing World,” Views From the Center blog, Center for Global Development, May 31, 2012.
7 Shaohua Chen and Martin Ravallion, “The Developing World Is Poorer Than We Thought, But No Less Successful in the Fight Against Poverty,” Policy Research Working Paper 4703, World Bank, 2010.
9 Branko Milanovic and Shlomo Yitzhaki, “Decomposing World Income Distribution: Does the World Have a Middle Class?” Review of Income and Wealth, International Association for Research in Income and Wealth, vol. 48(2), 2002.
10 Although some passenger cars may be acquired for business purposes, it is also a common practice to use business cars for personal purposes in developing countries.
11 Prices for the same car tend to be higher in developing countries than in advanced countries, reflecting high tariffs―for example, 38 percent in Mexico and 57 percent in India—but the incidence of smaller cars and of stripped-down versions of cars is greater (also see “How Are the Rich Doing?” box)
12 Only a very small portion of developing countries’ populations are in the rich class. According to household surveys, the number of people who fall above the upper bound of Milanovic-Yitzhaki’s threshold for the middle class in the G20 developing countries is in any event small, ranging from less than 0.5 percent in India to 5 percent of the population in Brazil.
13 Using Milanovic-Yitzhaki’s definition—those with annual incomes of at least $4,000 in 2005 PPP—we estimated the global middle class in developing G20 economies, which accounts for more than 70 percent of developing economies’ GDP, to be 369 million.
14 In China, India, and Brazil, using the household size of the middle class, instead of the national average, will reduce our estimate of the middle class by about only 20 million people.
15 Homi Kharas, “The Emerging Middle Class in Developing Countries,” OECD Development Center, Working Paper no. 285, 2010.
17 Although cars per capita adjusted by household size is a better proxy for the share of the middle class in the population, data on household size are unavailable for a large number of countries.
18 This may not be true in low income countries, as a certain minimum level of income is necessary to buy a car. Thus, low-income countries with high inequality (that have a larger share at the upper end of the income distribution) may initially have larger car ownership rates than countries with more equal distribution of income.
21 Other studies have found that the income elasticity of consumption is greater than 1 after a broadly similar threshold. For example, Kharas found that with in a per capita consumption range of $3,650 to $36,500, the income elasticity of consumption appears to be greater than 1. See Kharas, “The Emerging Middle Class in Developing Countries.”
22 These elasticity estimates are broadly confirmed over much shorter periods, including over the most recent five-year period from 2006 to 2011. For example, in the 2006–2010 period, the average income elasticity of car ownership was 1.8 for countries with average per capita income between $3,400 and $10,000, 1.5 for countries with average per capita income between $10,000 and $25,000, 0.5 for countries with average per capita income less than $3500, and -0.3 for countries with per capita income above $25,000.
23 Uri Dadush, Kemal Dervis, Bennett Stancil, and Sarah Puritz Milsom, Inequality in America: Facts, Trends and International Perspective (Washington, D.C.: Brookings Institution Press, forthcoming).
24 International Energy Agency, “World Energy Outlook,” 2006.
25 The U.S. figure for passenger cars does not include light trucks, vans, or sport utility vehicles. These types of vehicles are often used to transport passengers in the United States and, therefore, contribute significantly to the total number of passenger vehicles there. But because they are generally used in developing countries for transporting goods, they are excluded from this analysis, which is intended to measure the global middle class in the developing world. Their exclusion does not change the main conclusion of this paper—that the global middle class in developing countries is likely much larger and expanding far more rapidly than income-based measures of this population suggest. Insofar as light trucks, vans, or sport utility vehicles are used in developing countries for the purpose of transporting passengers, this only strengthens the paper’s central conclusion.
Former Senior Associate, International Economics Program
Dadush was a senior associate at the Carnegie Endowment for International Peace. He focuses on trends in the global economy and is currently tracking developments in the eurozone crisis.
Carnegie does not take institutional positions on public policy issues; the views represented herein are those of the author(s) and do not necessarily reflect the views of Carnegie, its staff, or its trustees.
More Work from Carnegie Endowment for International Peace
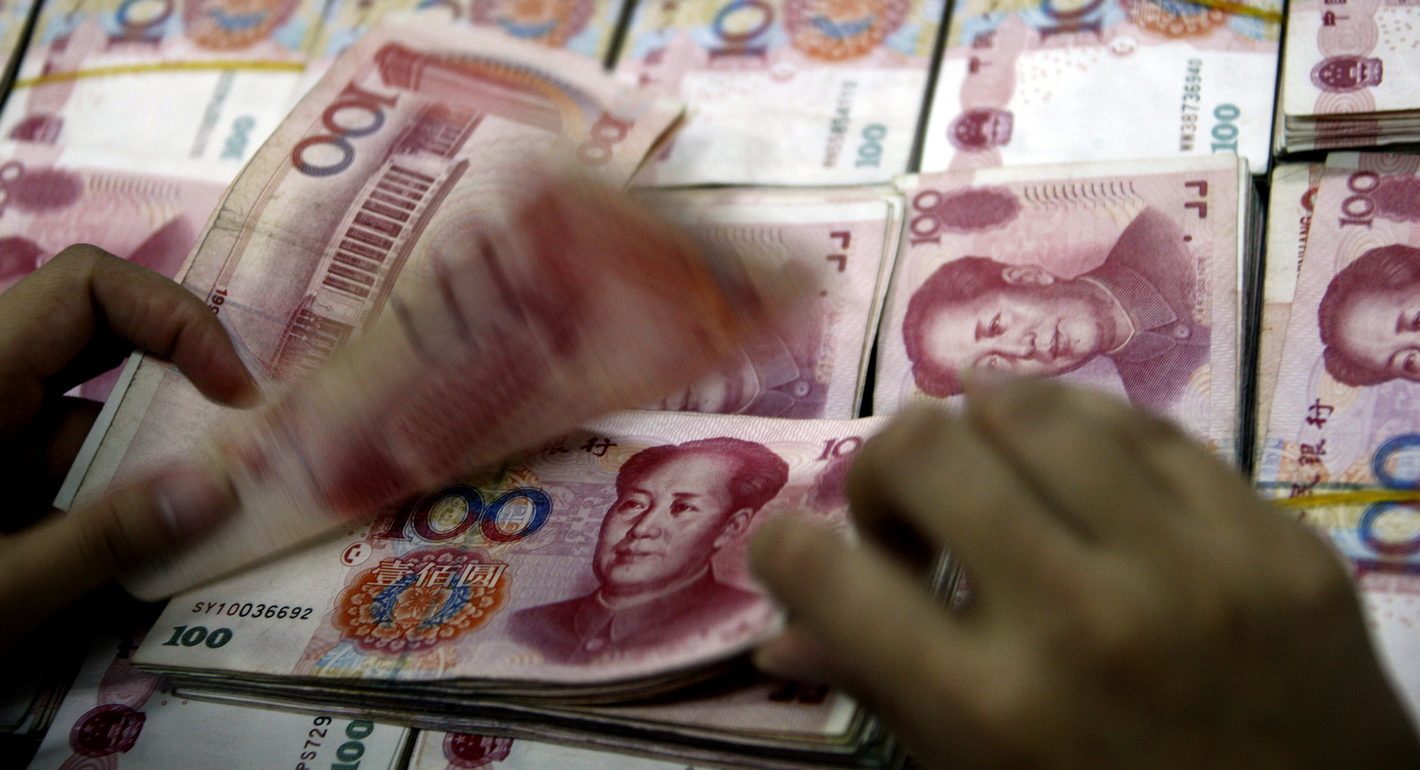
Is the Gulf moving beyond the dollar? This article examines how China is expanding the renminbi's role across Gulf markets, what that means for regional finance, and why the future of global currencies is more complex than the de-dollarization debate suggests.
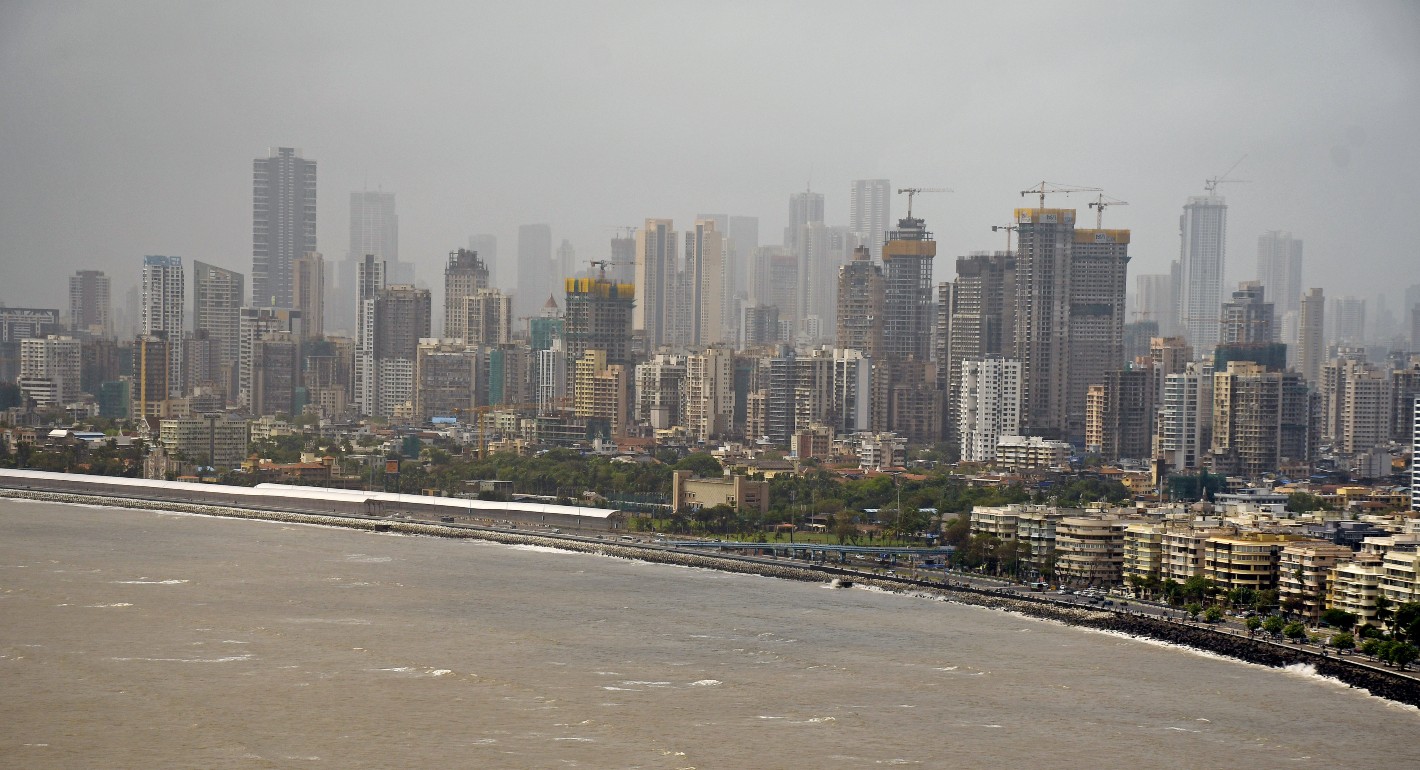
As India undergoes a demographic transition, its cities will be its economic powerhouse—but only if it accurately captures city growth and empowers cities to support their citizens.
Potential Strait of Hormuz transit “fees” and Iran’s renminbi use are bringing attention to Beijing’s push to become a “financial power,” particularly in energy markets. Underdeveloped aspects of China’s financial system and its dollar dependencies still constrain the renminbi’s geoeconomic significance, but recent events may spur policy shifts aimed at changing these dynamics.