


Who’s Ahead in the Global AI Talent Race?
The United States and China are extending their lead in producing and attracting top AI talent. At the same time, Asia ex-China is rising while Europe falters.
In the four years since ChatGPT was released, the AI boom has reached stratospheric heights, driving both economic growth and security concerns around the world. Fierce competition between the United States and China has been a defining feature, with each holding different advantages across energy, chips, infrastructure, models, and applications—the five layers of AI articulated by Nvidia’s Jensen Huang.
That U.S.-China competition has been most visible at the models layer. Every few months, a leading American AI lab releases a state-of-the-art frontier model, only to be followed by a Chinese open-weight model that nips at the heels of the U.S. frontier. As one of the most complex technologies in recent memory, AI’s advancements are driven by the world’s elite AI researchers and scientists. In other words, this layer is essentially a proxy competition for talent.
Talent is a quantifiable input, and assessing the global balance of top AI talent can yield significant insights on the state of competition. For several years, the think tank MacroPolo studied this dynamic through its “Global AI Talent Tracker.” Although MacroPolo ceased operations in 2025, human capital remains central to AI development, so Carnegie China is bringing a new edition of AI Talent v3.0.
We held to the same methodology as previous editions, using paper authors from the Neural Information Processing Systems conference (NeurIPS) as our sample. The NeurIPS cohort encompasses researchers who contribute to a broad range of technical AI research, including efforts to advance model capabilities, improve computational efficiency and scalability, and develop methods for model adaptation, compression, and knowledge transfer.
For its 2025 conference, NeurIPS accepted 5,823 papers with 25,677 total authors. The main difference in the v3.0 edition is that we applied AI tools to efficiently handle a much larger sample of more than 10,000 authors, or 40 percent of the total, whereas the previous edition used a much smaller random sample. See detailed methodology note for further explanation.
While NeurIPS has grown in popularity, authors whose papers are accepted at the conference are still considered elite research talent—the “Navy Seals” of the field. Although this study covers a single conference, NeurIPS is a valuable case methodologically: 1) it enables apples-to-apples comparisons over time; 2) it specifically captures the elite talent most likely to take the technology to new frontiers; and 3) it extends existing data, creating the only continuous longitudinal study on elite AI talent over the last six years.
In 2025 ...
41% China
34% U.S.
Share of AI talent working in the United States vs. working in China
2022
46% U.S., 27% China
30 : 1
Balance of talent flows between the United States and China has reduced, but is still largely a one-way flow of talent
2022
46 Chinese-origin in U.S. for every 1 U.S.-origin in China
Peking University
The #1 institution for AI talent among the top 30
2022
#1 Google
Singapore in the Top 20
#13 National University of Singapore; #16 Nanyang Technological University
2022
#25 NUS
#29 NTU
Key Takeaways
- China has established a commanding lead as the largest originating source of elite AI talent globally. Compared to 2022, the share of Chinese-origin AI talent, defined as those who received undergraduate degrees in China, increased 11 percentage points to 57 percent in 2025, while the U.S. share fell to 13 percent.
- The United States remains a magnet for global AI talent, particularly Chinese talent. Despite U.S.-China tensions, among AI researchers working in the United States, the 2025 share of those holding undergraduate degrees from China rose by 4 percentage points. When it comes to brain gain vs. brain drain, the United States saw a net gain of +2,145 researchers in 2025 while China registered a net loss of -1,729 researchers.
- However, more Chinese researchers are staying put in China than before. This is likely due to two factors: 1) It’s easier for Chinese graduates to find jobs in China’s booming AI industry, and 2) it’s harder for them to come to the United States as a result of tighter visa restrictions, particularly for Chinese graduate students in STEM fields. The share of Chinese-origin researchers who end up working in China increased from 57 percent in 2022 to 69 percent in 2025. China’s talent retention rate still trails that of the United States (89 percent), although it has superseded Europe (60 percent).
- Asia ex-China, namely South Korea and Singapore, made notable gains on AI talent. Not only does South Korea have the second-highest talent retention rate of 77 percent, its key institution KAIST leapt twelve places since 2022 to now rank as the third-highest institution in terms of producing top AI talent. Likewise, Singapore’s NUS and NTU both made it into the top twenty institutions ranking, which was not the case in 2022.
- Europe has continued to falter when it comes to AI talent. Although it is a slightly more attractive place for top AI talent to work compared to 2022, it has faded across other metrics. The top European institutions ETH Zurich and University of Oxford have both fallen off the top institutions ranking in 2025.
- A similar dynamic seems to apply to India. The country’s share of top AI talent has dropped by 2 percentage points, and the share of Indian talent working in the United States fell as well. No Indian institution made it into the top institutions ranking in either 2022 or 2025.
2025 Study Findings
Comparing 2025 and 2022
Methodology
“Who’s Ahead in the Global AI Talent Race?” brings the latest data to gauge the balance of top AI talent globally. It builds off the now-defunct AI talent project from MacroPolo to compare and track changes over the last three years across countries and institutions that produce top AI talent.
To maintain longitudinal integrity requires establishing the same baseline for comparison, so we took the same methodological approach for the 3.0 update as the edition published in 2023. The previous edition’s methodology remains publicly available in archived form. The main difference is that we used AI tools, both Claude Code and OpenAI Codex to automate much of the data work and results generation for v3.0, but with human intervention in the loop and for post-hoc quality control and verification.
As such, the methodology is divided into three sections: 1) a general explanation of the methodological approach, including sample selection, data acquisition, and results generation; 2) an explanation of machine labor versus human labor in the process; 3) a description of our quality control and verification process.
Methodological Approach
Sample Selection: Who’s Included?
NeurIPS is a leading international machine-learning conference and the anchor venue used in all versions of this study. Because it is considered one of the most prestigious AI research conferences, researchers who have their papers accepted for the conference are considered the elite of global AI research talent.
As with the previous version, we used authors of accepted papers for our sample. This gives both editions a cohort sample defined in the same way, so comparisons can be made on a common basis. The diagram below shows how accepted papers were linked to unique authors and their recorded undergraduate, graduate, and employment histories (the three career stages). To match the previous version, we measured “current workplace” one year after each conference—2023 for the 2022 cohort and 2026 for the 2025 cohort.
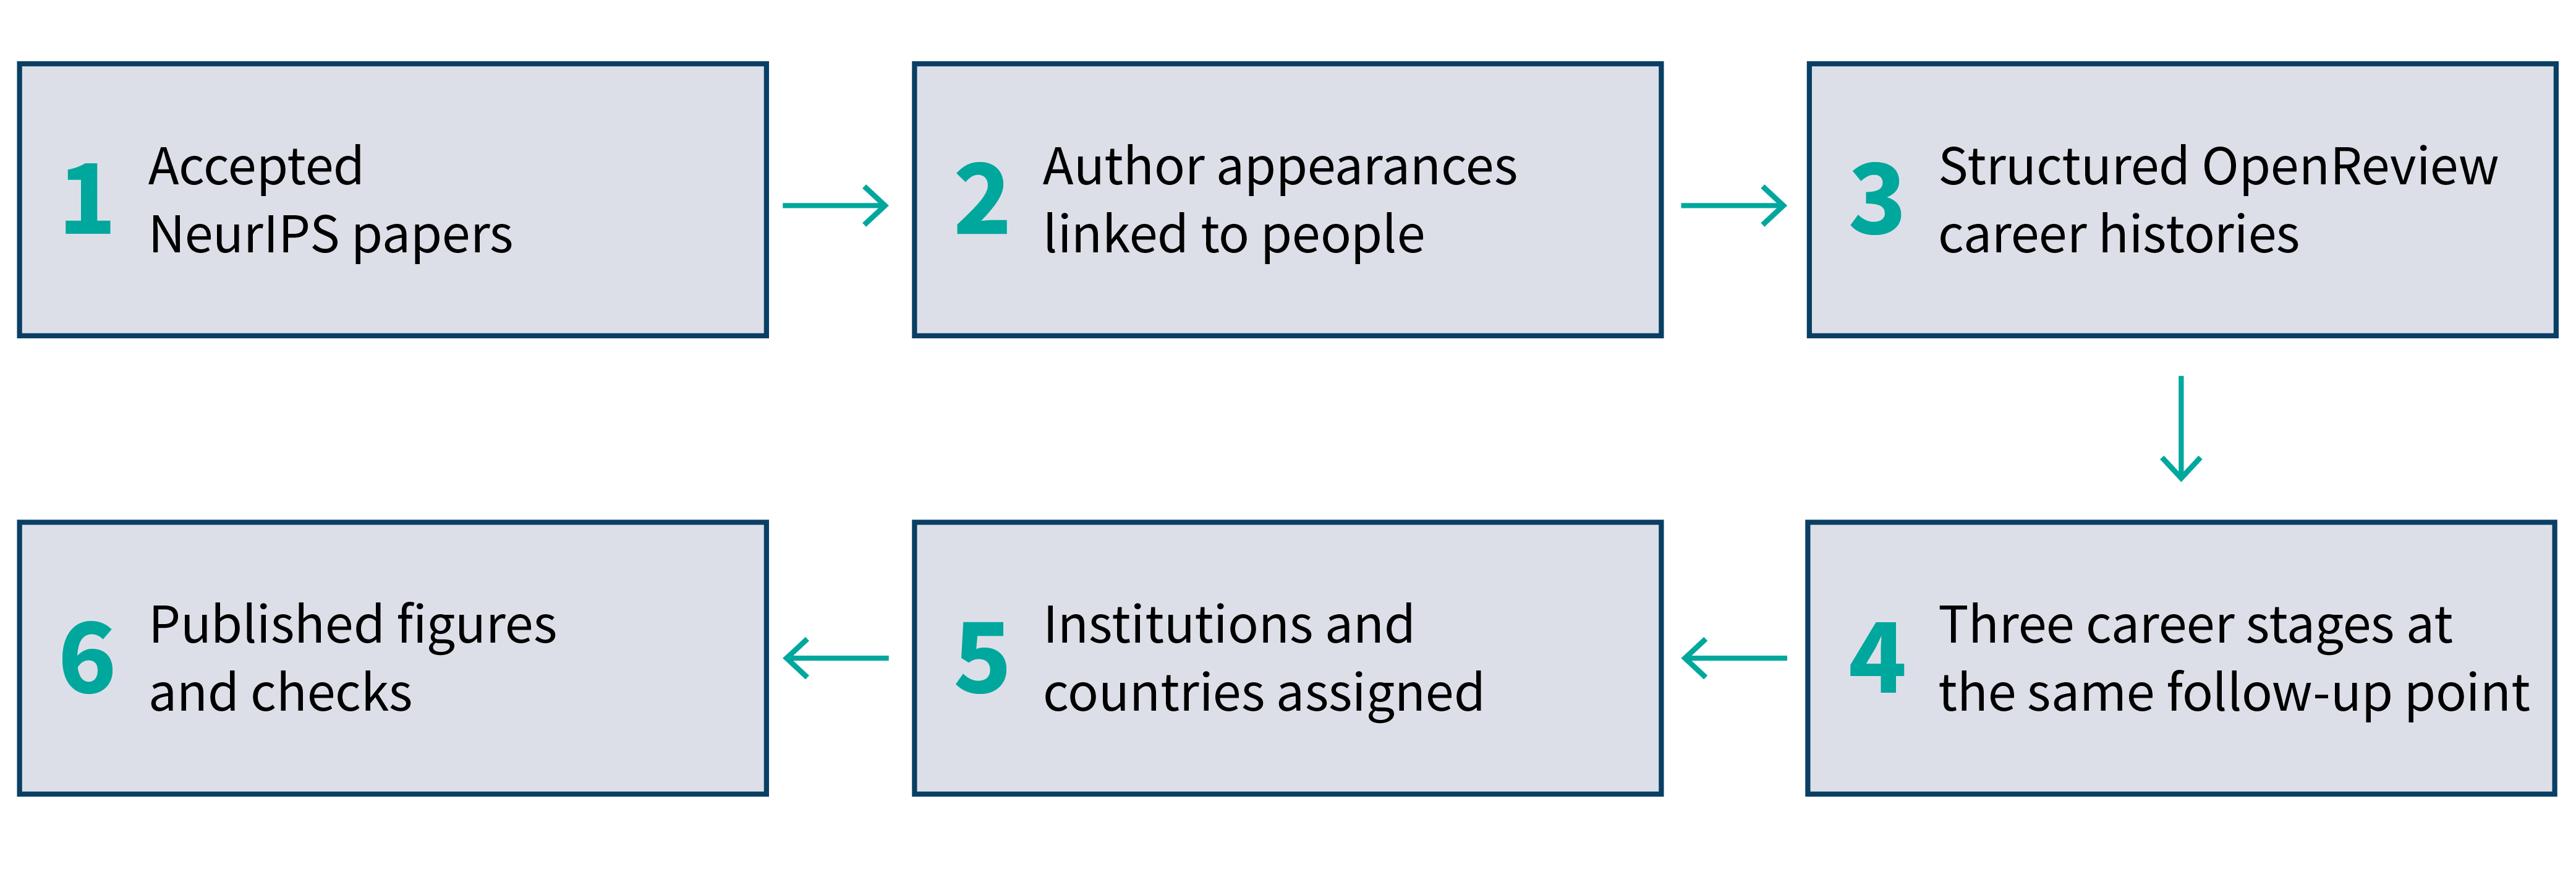
The study starts with every listed author on an accepted paper in the included NeurIPS tracks. The 2022 cohort includes the main and Datasets & Benchmarks tracks; sixty-seven Transactions on Machine Learning Research journal articles presented at the conference were excluded because they were not accepted through a NeurIPS paper track. The 2025 cohort includes the main, Datasets & Benchmarks, and Position Papers tracks.1 The unique author counts describe the full conference sample used in both editions. Because not all unique authors have complete, three-stage career data, only those that have complete career paths were used in the sample to generate final results. We chose to go with this sample because it encompasses all directly observed full career histories without having to infer from missing data.
For the 2025 cohort, 40 percent of total unique authors had complete career paths. This subset is not assumed to be random; broader sample checks preserve the main U.S.-China findings, while Europe’s direction remains sample-sensitive. Using this non-random sample also means that it has slight overrepresentation of academia and slight underrepresentation of industry talent, though the variance is under 1 percentage point in each direction. We also re-ran the results for the 2022 cohort rather than use the same random sample as the previous edition.
| Unit | NeurIPS 2022 | NeurIPS 2025 | Why it matters |
| Accepted papers | 2,834 | 5,823 | Defines the sample cohort. |
| Author total appearances | 13,191 | 34,206 | Counts every paper-author occurrence; one person may appear more than once. |
| Unique authors | 9,617 | 25,677 | Counts each author once after repeated identities are linked. |
| Complete three-stage histories | 3,153 (33%) | 10,280 (40%) | Cohort sample used for the career-flow and paired-comparison figures. |
Data Acquisition: Scraping OpenReview
OpenReview is the submission and peer review platform used by NeurIPS. Its records connect accepted papers to their authors and, where authors maintain them, to structured profiles covering their education background and current employment. This makes it the most direct source for our study.
The accepted papers define the NeurIPS cohort, while the linked profiles provide career information in a consistent format for the same people. Profile entries can include a position label, institution name and web domain, country, and start and end years. We used these records to construct the three career stages for authors with full information. This approach also allows the current 2026 study to begin with the entire conference cohort rather than reproduce the 2023 version’s manually coded and much smaller random sample.
We used Python scripts to acquire the OpenReview dataset. Scraping in this case entailed implementing rule-based scripts that automatically queried OpenReview to retrieve and save the relevant accepted papers and career profile records locally. Institution records were identified mainly through their recorded web domains; limited name-based matching was used only when no usable domain match was available. Every education and employment value used in the final database was traced to a downloaded source record, and the core population counts were reproduced from scratch. This process provided strong confidence that the records were captured and that dataset integrity had been maintained.
One caveat on the career profiles is that they are maintained by the researchers themselves. That means profiles can be updated if researchers change jobs or institution affiliations or remain incomplete if they’re not updated. Because these profiles are self-reported, independent verification of an individual career profile is basically impossible. Institution matching relied primarily on recorded web domains.
Results Generation
| Stage | Rule used | If the record is absent |
| Undergraduate origin | Use the earliest recorded undergraduate enrollment; the home country of that institution is the origin proxy. | Origin remains unknown. |
| Graduate training | Use the highest graduate degree completed or underway, prefer a PhD to a master’s degree. | Use “No graduate school” only when an undergraduate record is present, the profile contains at least one additional history entry, and no graduate enrollment is recorded; otherwise, the graduate stage remains unknown. |
| Current workplace | Use employment covering the observation year. When study and work overlap, employment takes priority. | If no dated job covers the observation year, use the current job and mark that case separately. |
Additional Rules
- If OpenReview shows a current profile as the successor to an inactive former username, treat them as the same person.
- Observations were made in 2023 for the 2022 cohort and in 2026 for the 2025 cohort. This ensures consistent observation of both cohorts in the year after the conference.
- An entry is treated as active if it started by the observation year and ended in or after that year, or has no end year. An entry with no start year cannot be placed in time.
- “No graduate school” is inferred only when an undergraduate record and at least one later career entry are present but no graduate enrollment appears. A job-only profile cannot tell us whether graduate school was skipped.
These rules set the parameters for generating results from both the 2022 and 2025 cohorts. Python scripts were applied to these rules, and Claude Code and OpenAI Codex helped write and test the scripts. In contrast, Python was used primarily to scrape the NeurIPS dataset in the 2023 edition and was not used to apply rules and set parameters for machine labor to generate the full results (see machine labor vs. human labor below).
Making Choices About the Numbers
Based on the 2025 dataset of unique authors of accepted papers at NeurIPS, a subset of unique authors that have complete career paths—undergraduate origin, graduate education (including qualifying “No graduate school” cases), and current workplace—was used to generate results.
Country labels are assigned based on the country of the recorded institution or employer. For multinationals, this may be the institution’s home country rather than the researcher’s physical office. Each comparative chart for 2022 vs. 2025 shows the same six categories in both years; all remaining countries or regions are grouped as “Other.” Net gains and losses compare undergraduate origin with current workplace; they do not track individual migration. Hong Kong is grouped with China; the United Kingdom is separate from Europe; and Singapore is treated as its own category.
Machine Labor vs. Human Labor
We used Claude Code and OpenAI Codex to support the initial development, review the scripts, and run the results for each career stage locally on a Mac. Once the human researcher set the rules, Python scripts were implemented to download records, link identities, aggregate results, and produce data visualization figures. The human researcher chose the cohorts and definitions, decided how to handle missing information and assign institutions and countries, reviewed outputs and exceptions, and approved corrections. No LLM was used to generate career histories, which came entirely from the OpenReview data.
Claude Code was primarily used for the initial run of results and debugging. For instance, if a script failed or produced an unexpected result, the affected step was debugged and rerun, and the human researcher reviewed the process and final output. Select records and intermediate outputs were also checked against the original OpenReview histories. The human researcher also checked records and intermediate outputs flagged by the scripts, as well as institution matches that required a judgment call, against the original OpenReview histories.
The workflow was developed for the 2025 dataset, then applied to the 2022 cohort as a back test to ensure results integrity and that comparisons would be feasible. For that, we mainly used OpenAI Codex to review the code for the 2022 reconstruction and cross-year comparisons. The reconstruction exposed a profile-linking error in the automated workflow: Renamed or merged OpenReview profiles could be treated as missing. For instance, in the preliminary build of the 2025 cohort, 1,705 of 25,682 authors, or 6.6 percent, were incorrectly treated as having no profile. The rule was corrected, and both cohorts were rerun before the final comparison.
Quality Control and Verification
Quality control combined automated consistency checks with targeted researcher review. During each stage, the scripts generated predefined flags and error messages. The researcher reviewed these diagnostic outputs with Codex to identify their causes, corrected the relevant code or rule where necessary, and reran the affected stage before proceeding. The researcher also checked institution matches that required human judgment against the underlying OpenReview records. The aforementioned renamed profile problem is an example of this stop, diagnose, correct, and rerun process.
Two further checks were conducted after the workflow was completed. A from-scratch rebuild using a separate implementation reproduced the core cohort counts for both years. An additional independent AI review of the handover files reproduced the key row counts and headline career paths and identified and corrected three numerical errors in the supporting documentation.
Together with the eighteen automated consistency checks for the two editions, this quality control process provided strong evidence that the main aggregate results were produced consistently from the data inputs and stated rules. Manual human verification was selective and did not involve re-coding a random or stratified sample of profiles, so the study cannot report a record-level accuracy rate. However, the four reconstructed back tests of 2022 data differed from the previous edition’s hand-coded estimates by 1.7 to 3.2 percentage points, which is in line with the rough estimate of the previous edition’s uncertainty range of +/- 5 to 7 points.
Confidence is highest in the aggregate counts reproduced by the checks and in the finding that China overtook the United States as the leading work location in the 2025 results. It is somewhat lower for individual career profiles and their physical work locations. Results for Europe are less consistent: Its share of AI talent rises slightly in the full career path sample but falls slightly in the broader sample, making it a bit harder to conclude about Europe’s direction of change.
Four additional checks tested the main counts and outputs from different directions:
| Check | What was done | What it showed |
| Compare against 2.0 edition | Compared AI-assisted rerun study with the previous hand-coded 2022 study. | All four reconstructed studies are within 3.2 percentage points of the previous figures. |
| Independent raw data rebuild | Used a separate implementation to rebuild the accepted-paper, author-appearance, and unique-author totals from raw files. | The main population counts for both years were reproduced. |
| Separate folder review | Used a different automated reviewer to start from the data handover folders and recount the main figures. | The review reproduced the main row counts and headline figures. |
| Eighteen automated checks per edition | Reviewed consistency from raw papers and profiles through linked people, the three-stage sample, and the published figures. | Both editions passed the full set of checks. |
Notes
1 Tracks are not assigned separate weights. In the people-based figures, each unique author is counted once after identities are linked across papers and tracks. In the institution rankings, each accepted paper contributes one unit of paper credit, divided equally among all listed authors; each author’s share is assigned to the institution where that researcher worked in the relevant observation year. The Position Papers track was introduced in 2025 and therefore has no 2022 counterpart.