Research
- +5
Alper Coşkun, Fatih Ceylan, Tacan İldem, …
Source: Getty
As geopolitical rivalry weaponizes global supply chains, the EU’s true vulnerability lies in emerging-risk imports. For these goods, suppliers are growing more concentrated, substitution more difficult, and political risk is looming.
As the global order transitions from unipolar Western dominance to a multipolar configuration, the form of globalism that once promoted prosperity, rules-based liberalization, and deep economic integration is being reassessed. This ongoing transformation has intensified strategic competition among the world’s largest economies. The European Union (EU), the United States, and China are all seeking to recalibrate their positions in global value chains, making the intersection of trade, technology, and security a theater of multipolar competition.
It is increasingly evident that supply chains are no longer simply economic mechanisms but have emerged as a central arena for geopolitical competition. The securitization of supply chains heralds a fragmented trade landscape in which national security considerations take ever-greater precedence over economic efficiency. The logistical bottlenecks initially exposed by the COVID-19 pandemic are now being compounded by rising geopolitical tensions. The new global trade-and-investment paradigm is defined by the deliberate weaponization of supply chains as instruments of statecraft.
Caught between unpredictable U.S. protectionism and Chinese supply-chain weaponization, the EU has accelerated its push for genuine strategic autonomy. The union has pursued its own brand of strategic resilience through its concept of open strategic autonomy, which includes the Net-Zero Industry Act, the European Chips Act, and the proposed Industrial Accelerator Act.1 To counter China’s expansive Belt and Road Initiative, the EU has also launched the Global Gateway infrastructure investment initiative, which seeks to establish alternative supply corridors.
This paper investigates the EU’s strategic trade dependencies against the backdrop of this transition toward a global trading order shaped by geopolitical concerns. A three-layer analysis clarifies the real impact of these dependencies. The first economic layer determines the scope of these dependencies. The second geoeconomic layer identifies the trading partners at the core of the EU’s supply vulnerabilities. The final geopolitical layer combines the geoeconomic mapping with an analysis of geopolitical affinity to evaluate the inherent political risk of these dependencies for the EU.
Attempts to diagnose the EU’s supply vulnerabilities are not new. The European Commission’s 2021 study on trade dependencies was the first comprehensive approach.2 In that study, the commission identified 137 products for which the EU is highly dependent on imports from third countries; these products represented around 6 percent of the bloc’s extra-EU import value in 2018. In terms of countries, China accounted for about half of the EU’s import value, with Vietnam and Brazil also identified as important suppliers. The study was followed in 2022 by an analysis of the EU’s strategic dependencies and capacities.3 This latter work zoomed into five areas where dependencies are particularly acute: rare earths and magnesium, chemical compounds, solar panels, cybersecurity, and information technology (IT) software.
The commission’s studies adopted a two-step methodology driven by trade data. First, the analyses flagged product-level dependencies and then narrowed these to strategic dependencies in sensitive ecosystems. To determine the product-level dependencies, the research team reviewed 5,000 traded products and selected those that met three core criteria: high penetration of extra-EU imports into EU consumption, high concentration of suppliers, and limited domestic production or limited short-term substitutability. Applying these filters narrowed the list of 5,000 potential products to a few hundred. The second step involved a qualitative assessment. The commission identified the product dependencies linked exclusively to a handful of sensitive industrial ecosystems: energy-intensive industries, health, renewables, and digital. The end result was a list of 137 highly dependent products; a later update extended this list to 204 products.
The approach adopted in this paper differs in significant ways from the commission’s methodology. It consists of a three-stage analysis with a view to incorporating the geopolitical implications of trade dependencies.
The first step of the analysis involves the construction of two indicators: an Import Vulnerability Index (IVI) and a Substitution Difficulty Index (SDI). The goal is to examine the products imported by a trade partner and identify how vulnerable these are and how easily they can be substituted by other products.4
The IVI captures the extent of a trade partner’s dependence on imports and the potential impact of supply-chain disruptions on domestic production and consumption. This index aggregates six components:
The SDI, meanwhile, assesses the difficulty of finding alternative markets or replacing a product if its supply chain is interrupted. This index consists of five components:
Based on these components, each product is given an IVI value and an SDI value of between 0 and 1. These values are combined on a graph to create an import risk profile (see figure 1). The horizontal axis represents the difficulty of substitution, while the vertical axis shows the import vulnerability. Each circle corresponds to a product; the size of the circle denotes the import value of that product. A two-by-two grid is then overlaid onto the graph to divide the products into four risk categories.
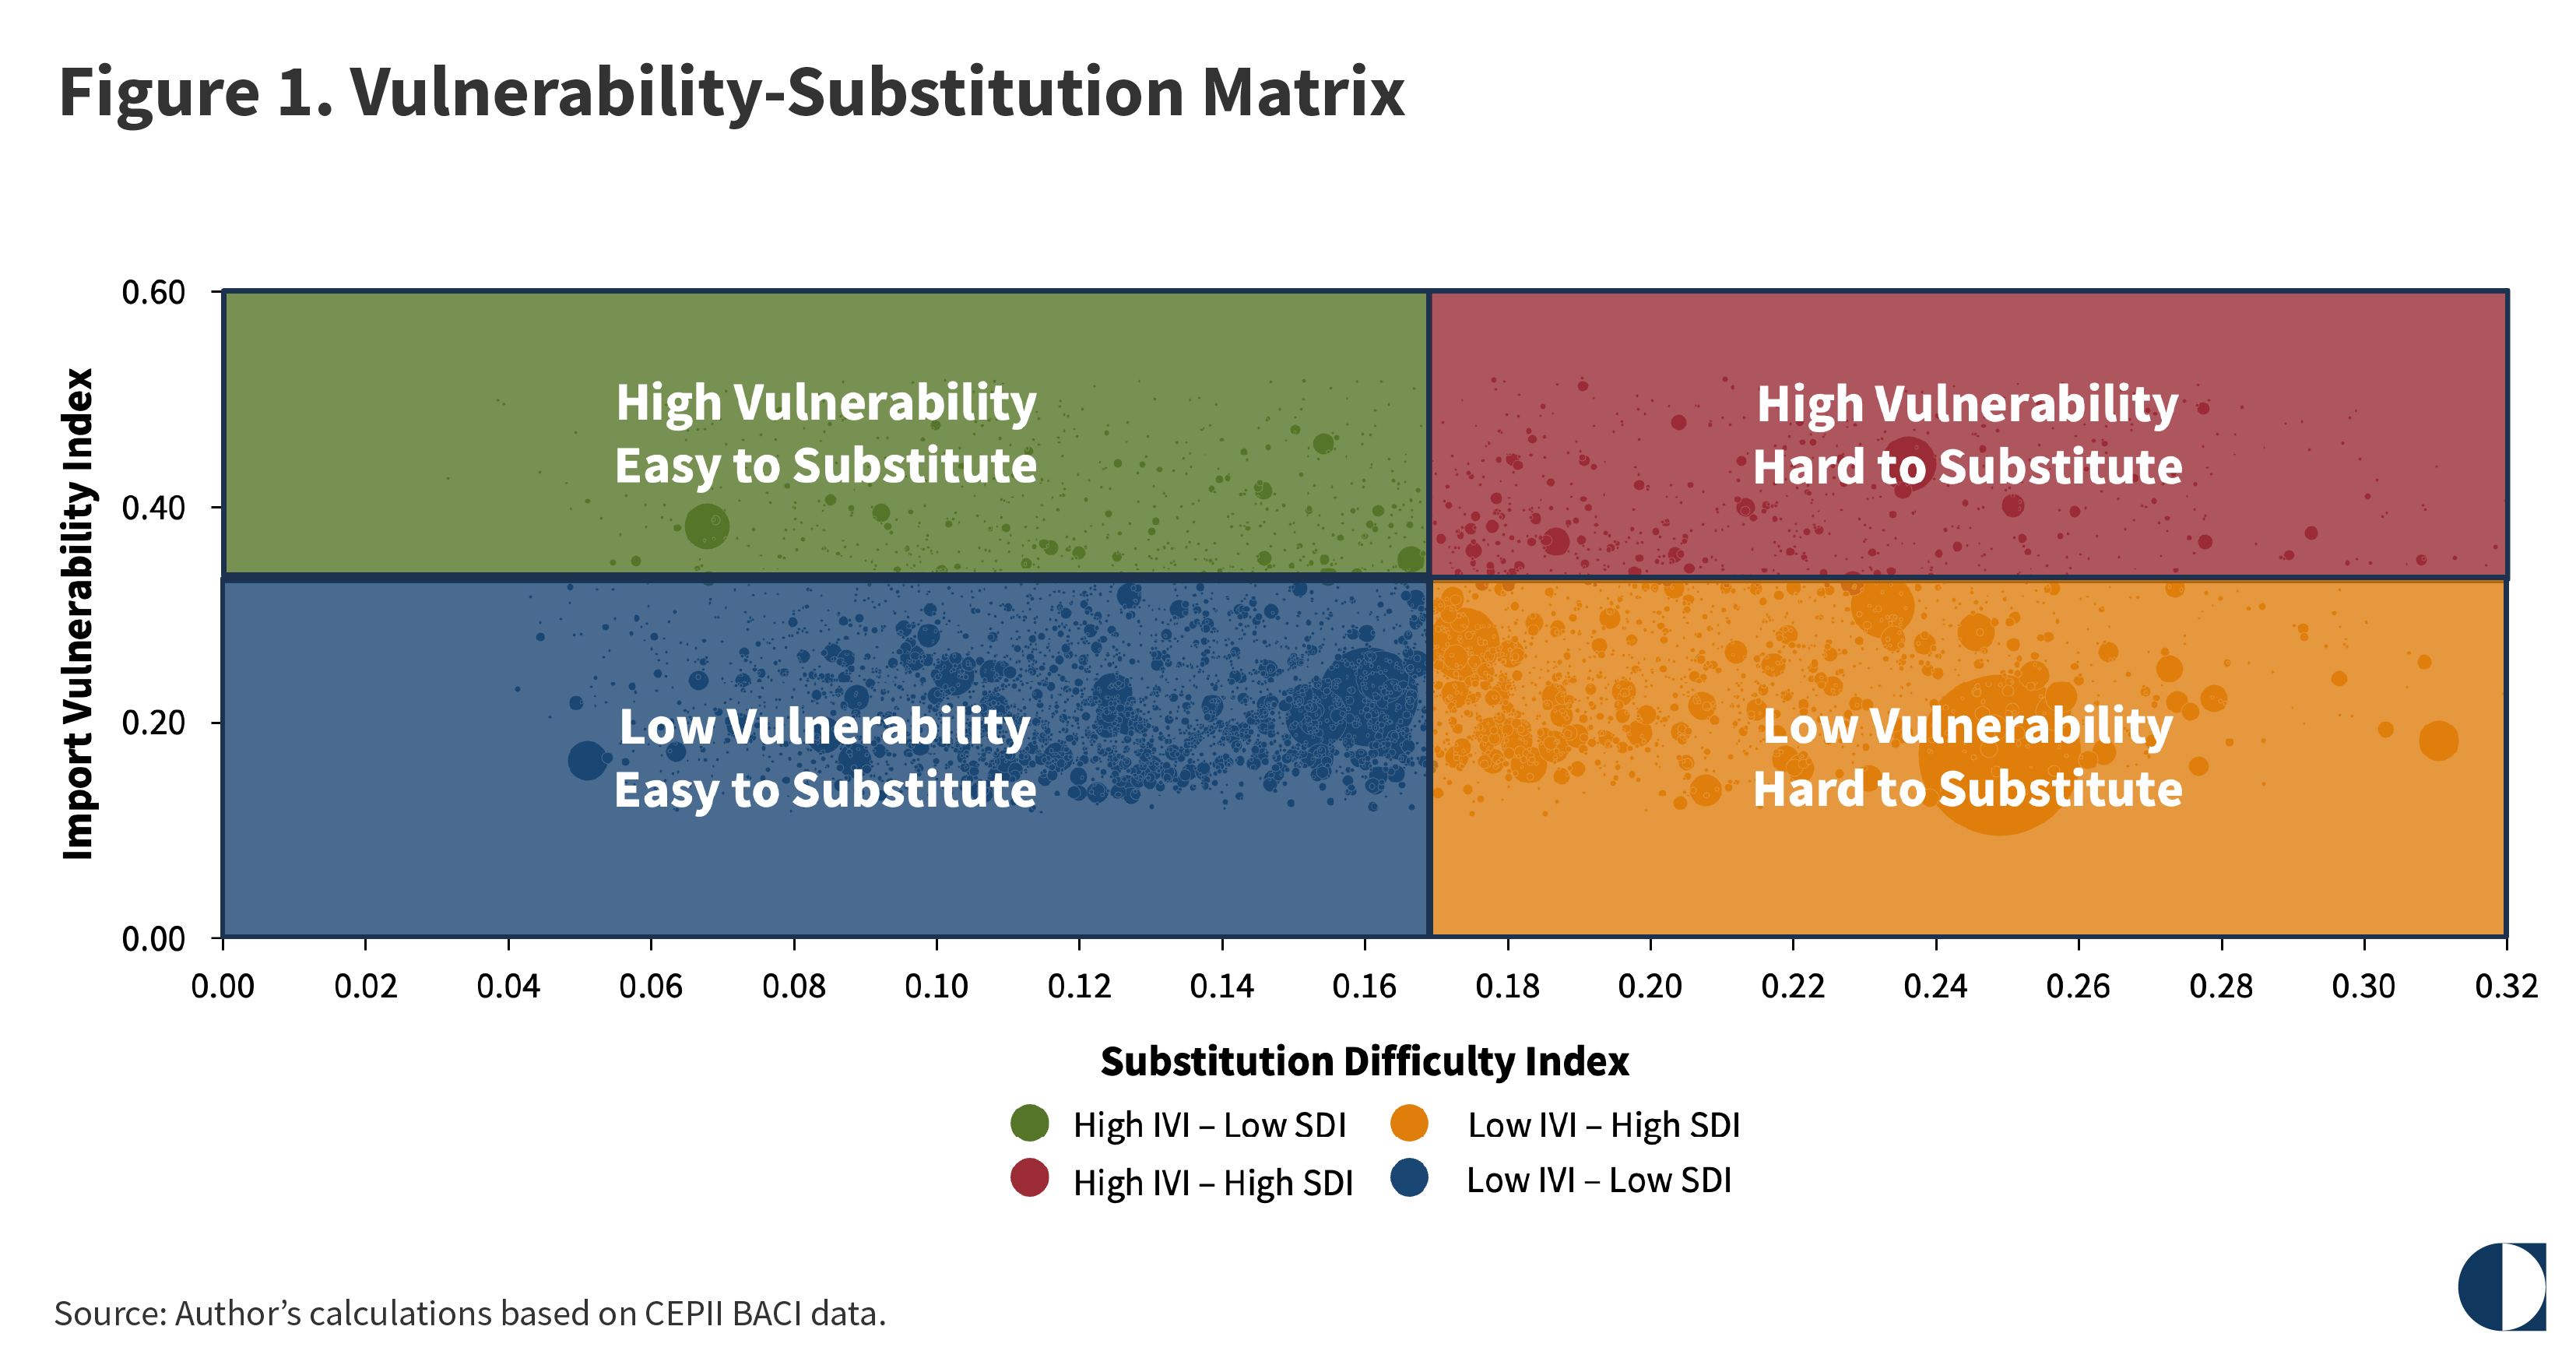
The bottom-left quadrant is the supply-chain comfort zone. Products in this category are neither significantly exposed to the risks of import disruption nor difficult for a given economy to replace. These products are typically standardized goods that can be sourced from a large number of suppliers. Therefore, any potential policy intervention can be minimal.
The top-left quadrant corresponds to an acute dependence on imports but with readily accessible alternatives. Products in this category are potentially exposed to the risks of supply disruption, but substitution would be straightforward in the event of a shock. The policy intervention should seek to gradually lower the overall trade dependence, given the existence of alternative suppliers.
In the bottom-right quadrant are products for which current supply appears stable but substitution would prove problematic if supply were disrupted. This situation warrants precautionary measures to preserve existing supplier relationships. Although imports may be well diversified or the products not yet critical, replacement would be difficult because the goods are exported by only a few countries. These products require strategic protection: maintaining supplier diversity, securing long-term agreements with key partners, and holding low to moderate precautionary stocks.
Finally, the top-right quadrant represents the most critical segment, characterized by both a high dependence on imports and formidable barriers to substitution, making replacement extremely difficult or time consuming. A short-term disruption could have a significant economic impact, highlighting structural vulnerabilities that require comprehensive policy responses beyond trade instruments. Necessary measures include domestic capacity building, allied co-production arrangements, and long-term offtake agreements with alternative suppliers.
The vulnerability-substitution matrix enables product-level comparisons across the import basket, allowing policymakers to generate priority lists of the most vulnerable and/or hardest-to-substitute products.5 This approach moves beyond simple measures of market and supply concentration to provide a nuanced risk assessment that distinguishes between immediate exposure to shocks and structural adaptive capacity.
The IVI-SDI analysis offers a robust methodology for navigating supply-chain vulnerabilities in an increasingly multipolar world in which economic interdependence and geopolitical fragmentation co-exist. This methodology transforms complex indices into actionable intelligence, enabling policymakers to calibrate their interventions according to each product’s specific risk profile. Its policy relevance makes this analysis a valuable tool not only for major economies, such as the EU, but also for developing economies that face similar exposure.
The geoeconomic layer of the analysis ranks exporting countries according to their importance to EU supply chains. This emphasizes the critical role of exports as inputs for EU production rather than a country’s overall export diversity. In other words, this benchmark measures the strategic importance of the EU’s trade relationship with each exporting country. Specifically, this part of the analysis takes into consideration the concept of forward linkages, which is a measure of the importance of a specific input for overall economic production.
The final layer of the analysis evaluates the geopolitical risks of the potential weaponization of supply chains. This first involves identifying the individual supply chains that could cause the most damage to economic production if they were disrupted. This step builds on the concept of forward linkages introduced in the geoeconomic analysis. In general, raw materials and intermediate goods have high forward linkages, as they feed into the manufacturing processes of downstream industries. Consumer end products, by definition, have almost no forward linkages because they are not used as inputs for other industries. Higher total forward linkages indicate a higher potential for economic disruption.6
Product groups are categorized into five tiers according to the intensity of their forward linkages, with each tier assigned a score from 1 to 5 (see table 1). For each product, a supply-chain importance score is then derived from the forward linkage score, the number of exports, and the export value.
The last phase of the analysis ranks the EU’s trading partners in terms of their geopolitical distance from the EU. An acknowledged method of describing geopolitical alignment is to examine the similarity of states’ voting behavior at the United Nations (UN) General Assembly. This study uses voting patterns from 2020 to 2025, with an index of geopolitical similarity calculated for each trading partner.
The two metrics of geoeconomic importance and geopolitical affinity can then be displayed graphically to identify the geopolitical implications of the EU’s supply dependencies.
An analysis of EU imports in 2019 shows that the largest share—88.7 percent of the total—was concentrated in the two low-vulnerability quadrants (see figure 2). Consumer goods made up the majority of this segment, with 42.1 percent of these imports falling into the low-vulnerability, easy-to-substitute category. Energy products, including petroleum, natural gas, and liquefied natural gas (LNG), were classified as hard to substitute because of the limited number of exporters.
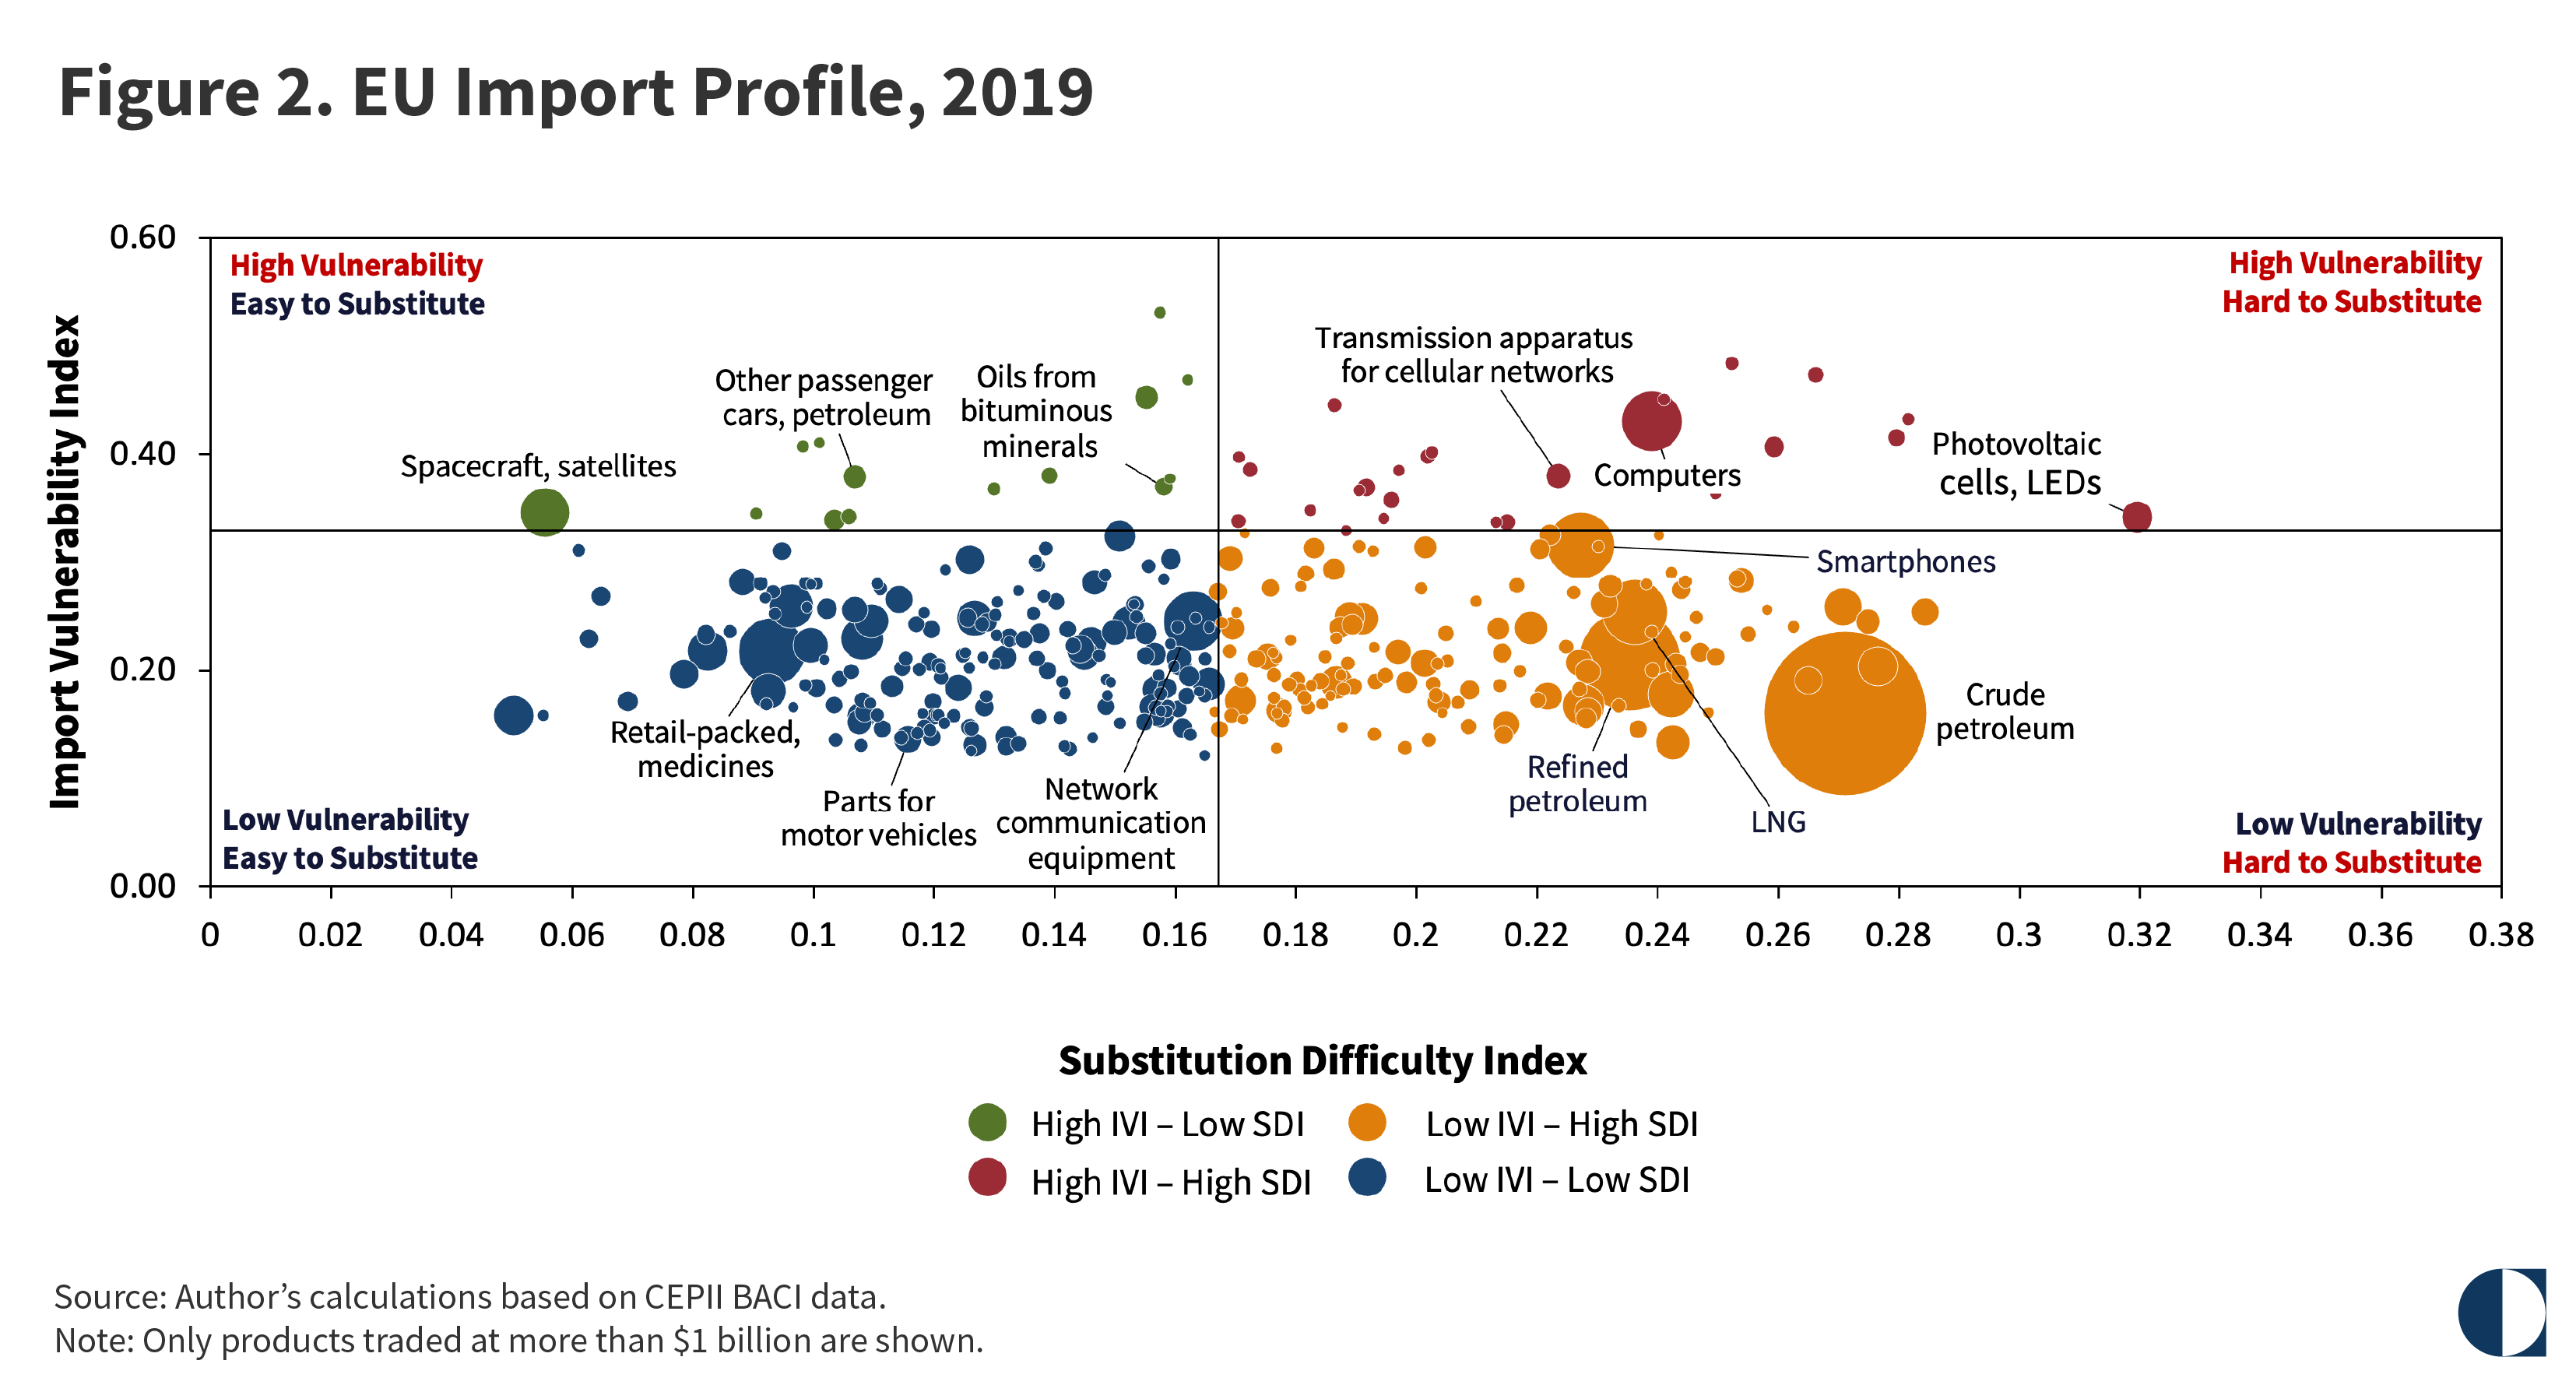
However, a critical subset of products, such as computers, transmission apparatus for cellular networks, and photovoltaic cells—representing 6.8 percent of total imports—exhibited both high vulnerability and significant substitution challenges. The state of EU imports before the COVID-19 pandemic indicated a structural dependence on energy and electronic products. Meanwhile, items including spacecraft and satellites, oils from bituminous minerals, and certain gasoline-based passenger cars were characterized by high import vulnerability but were relatively easy to substitute.
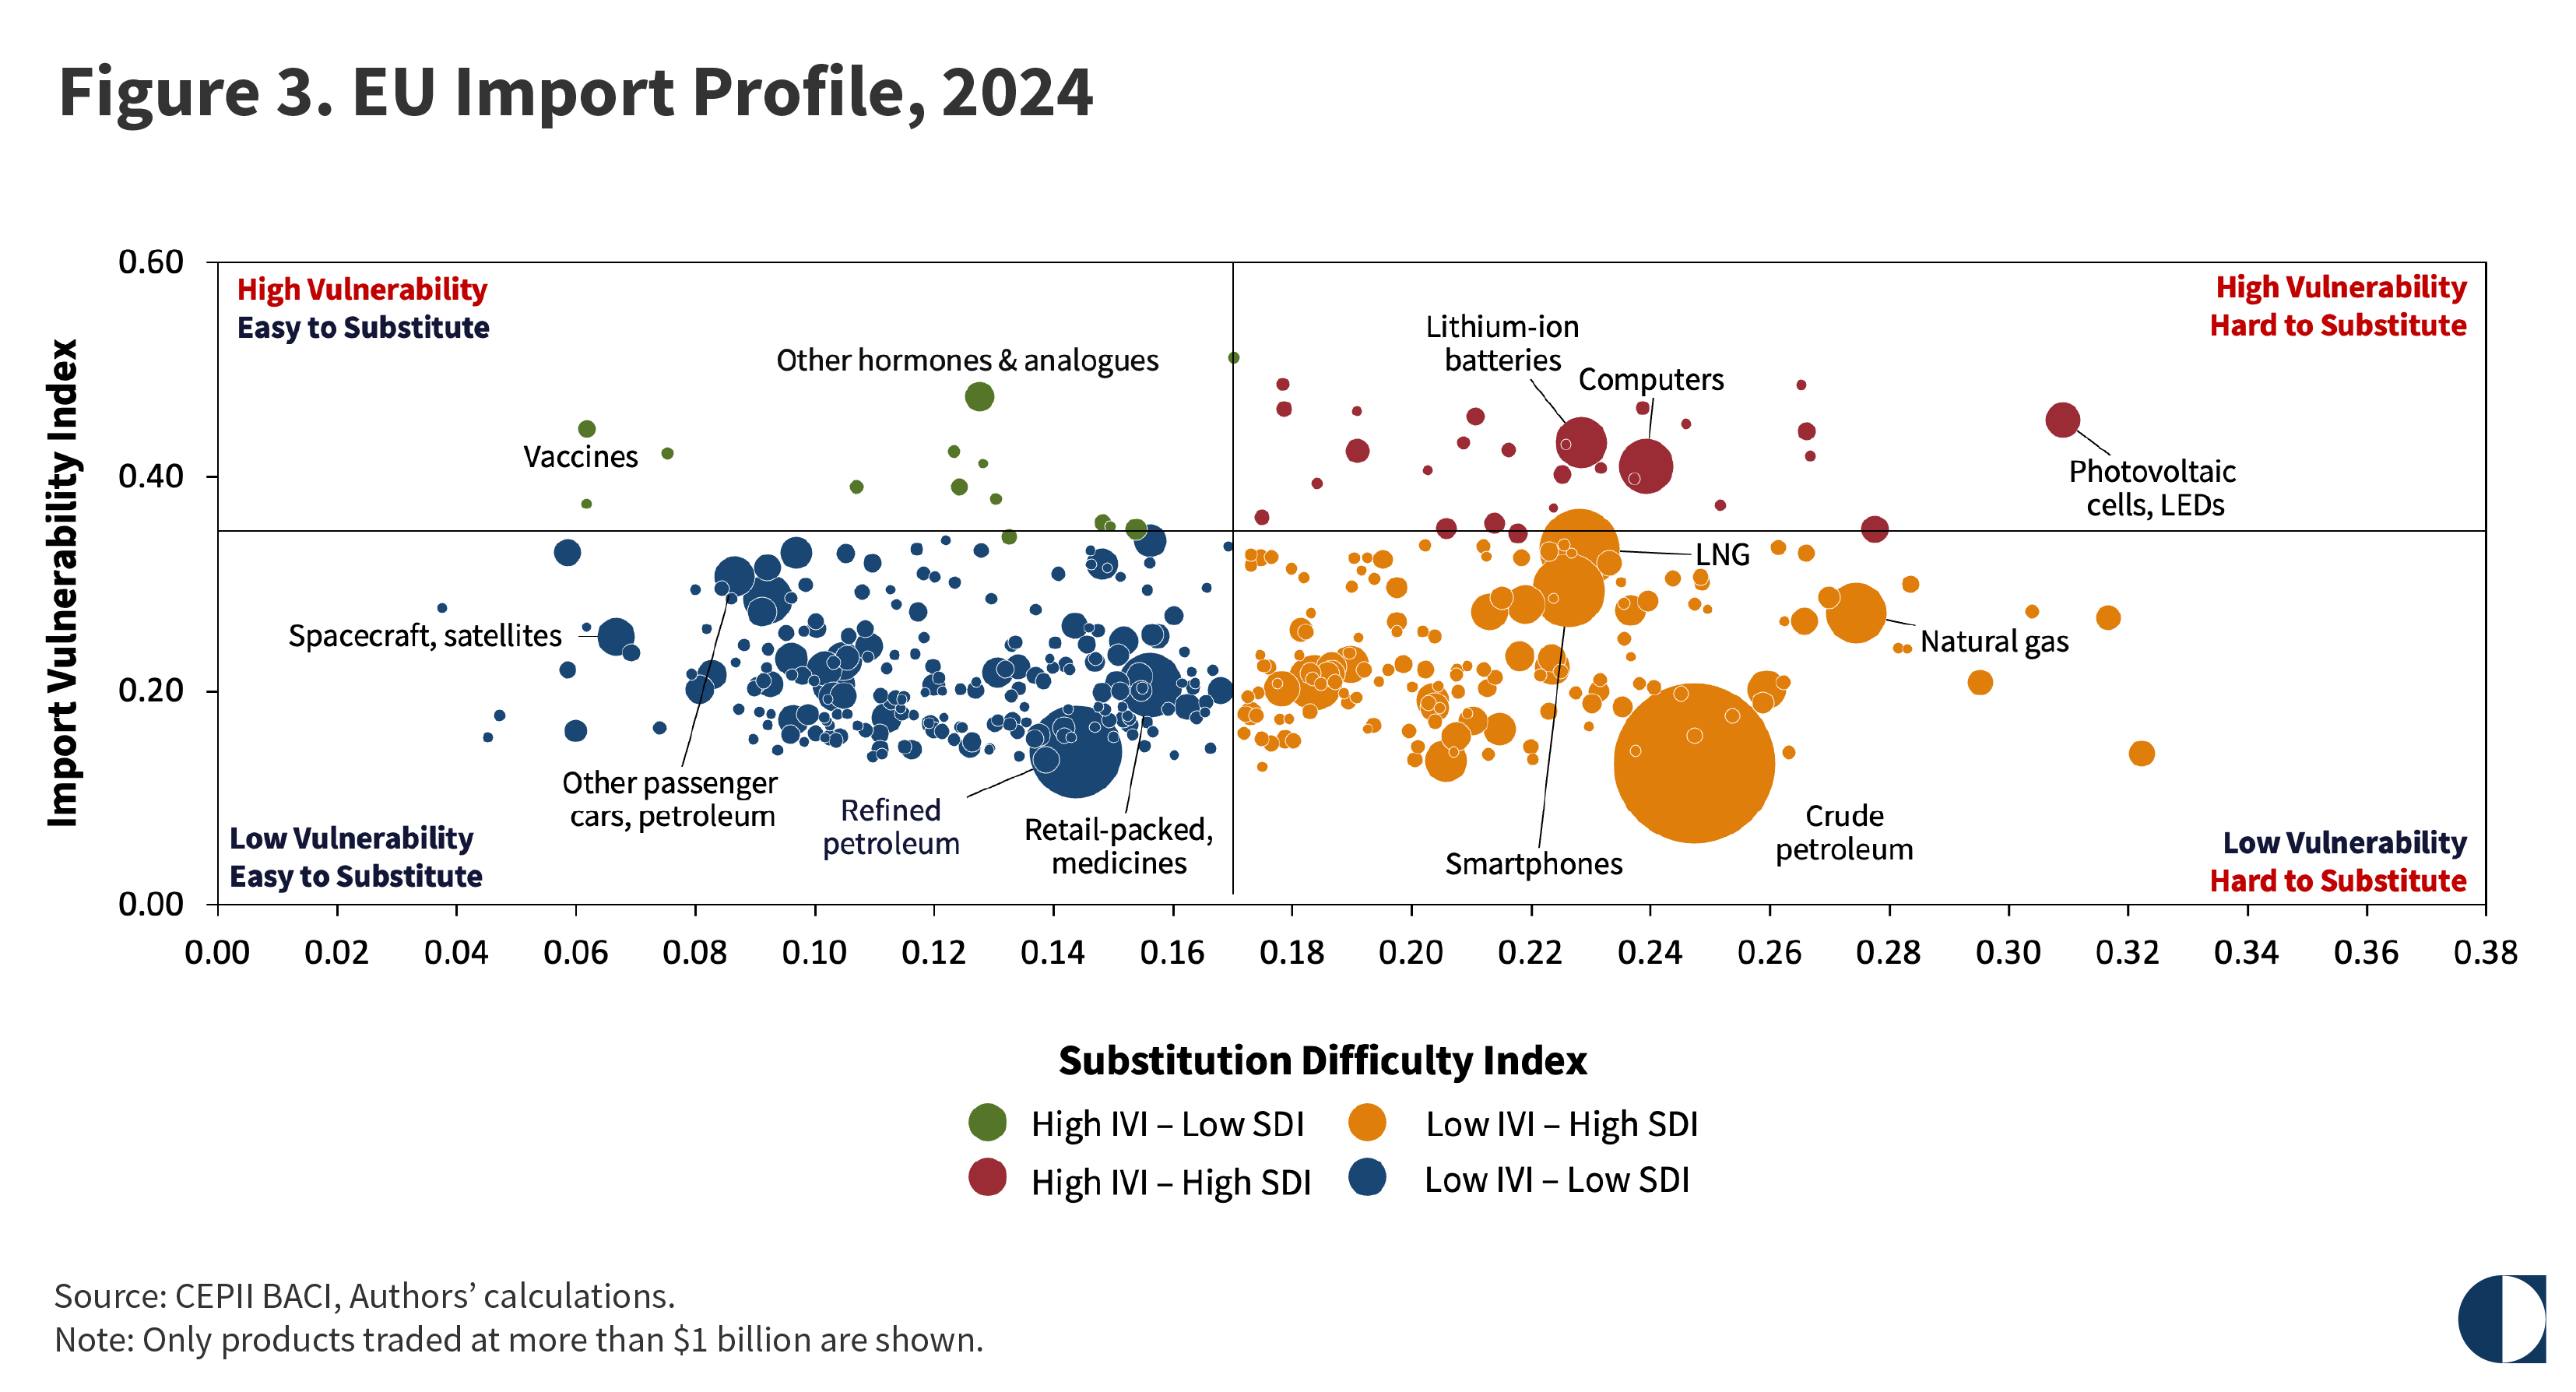
By 2024, the percentage of EU imports in the two low-vulnerability quadrants had increased to 89.4 percent, with the overall import structure remaining similar to the situation five years earlier (see figure 3). The percentage of high-vulnerability, hard-to-substitute products had risen to 7.5 percent, in part because of the growing importance of lithium-ion batteries, which are used in consumer electronics and electric vehicles.
This part of the analysis builds on the economic evaluation by complementing it with a geoeconomic dimension. Concretely, the imports on which the EU has a high level of dependence are matched with their countries of supply to provide a geoeconomic mapping of the union’s trade dependencies.
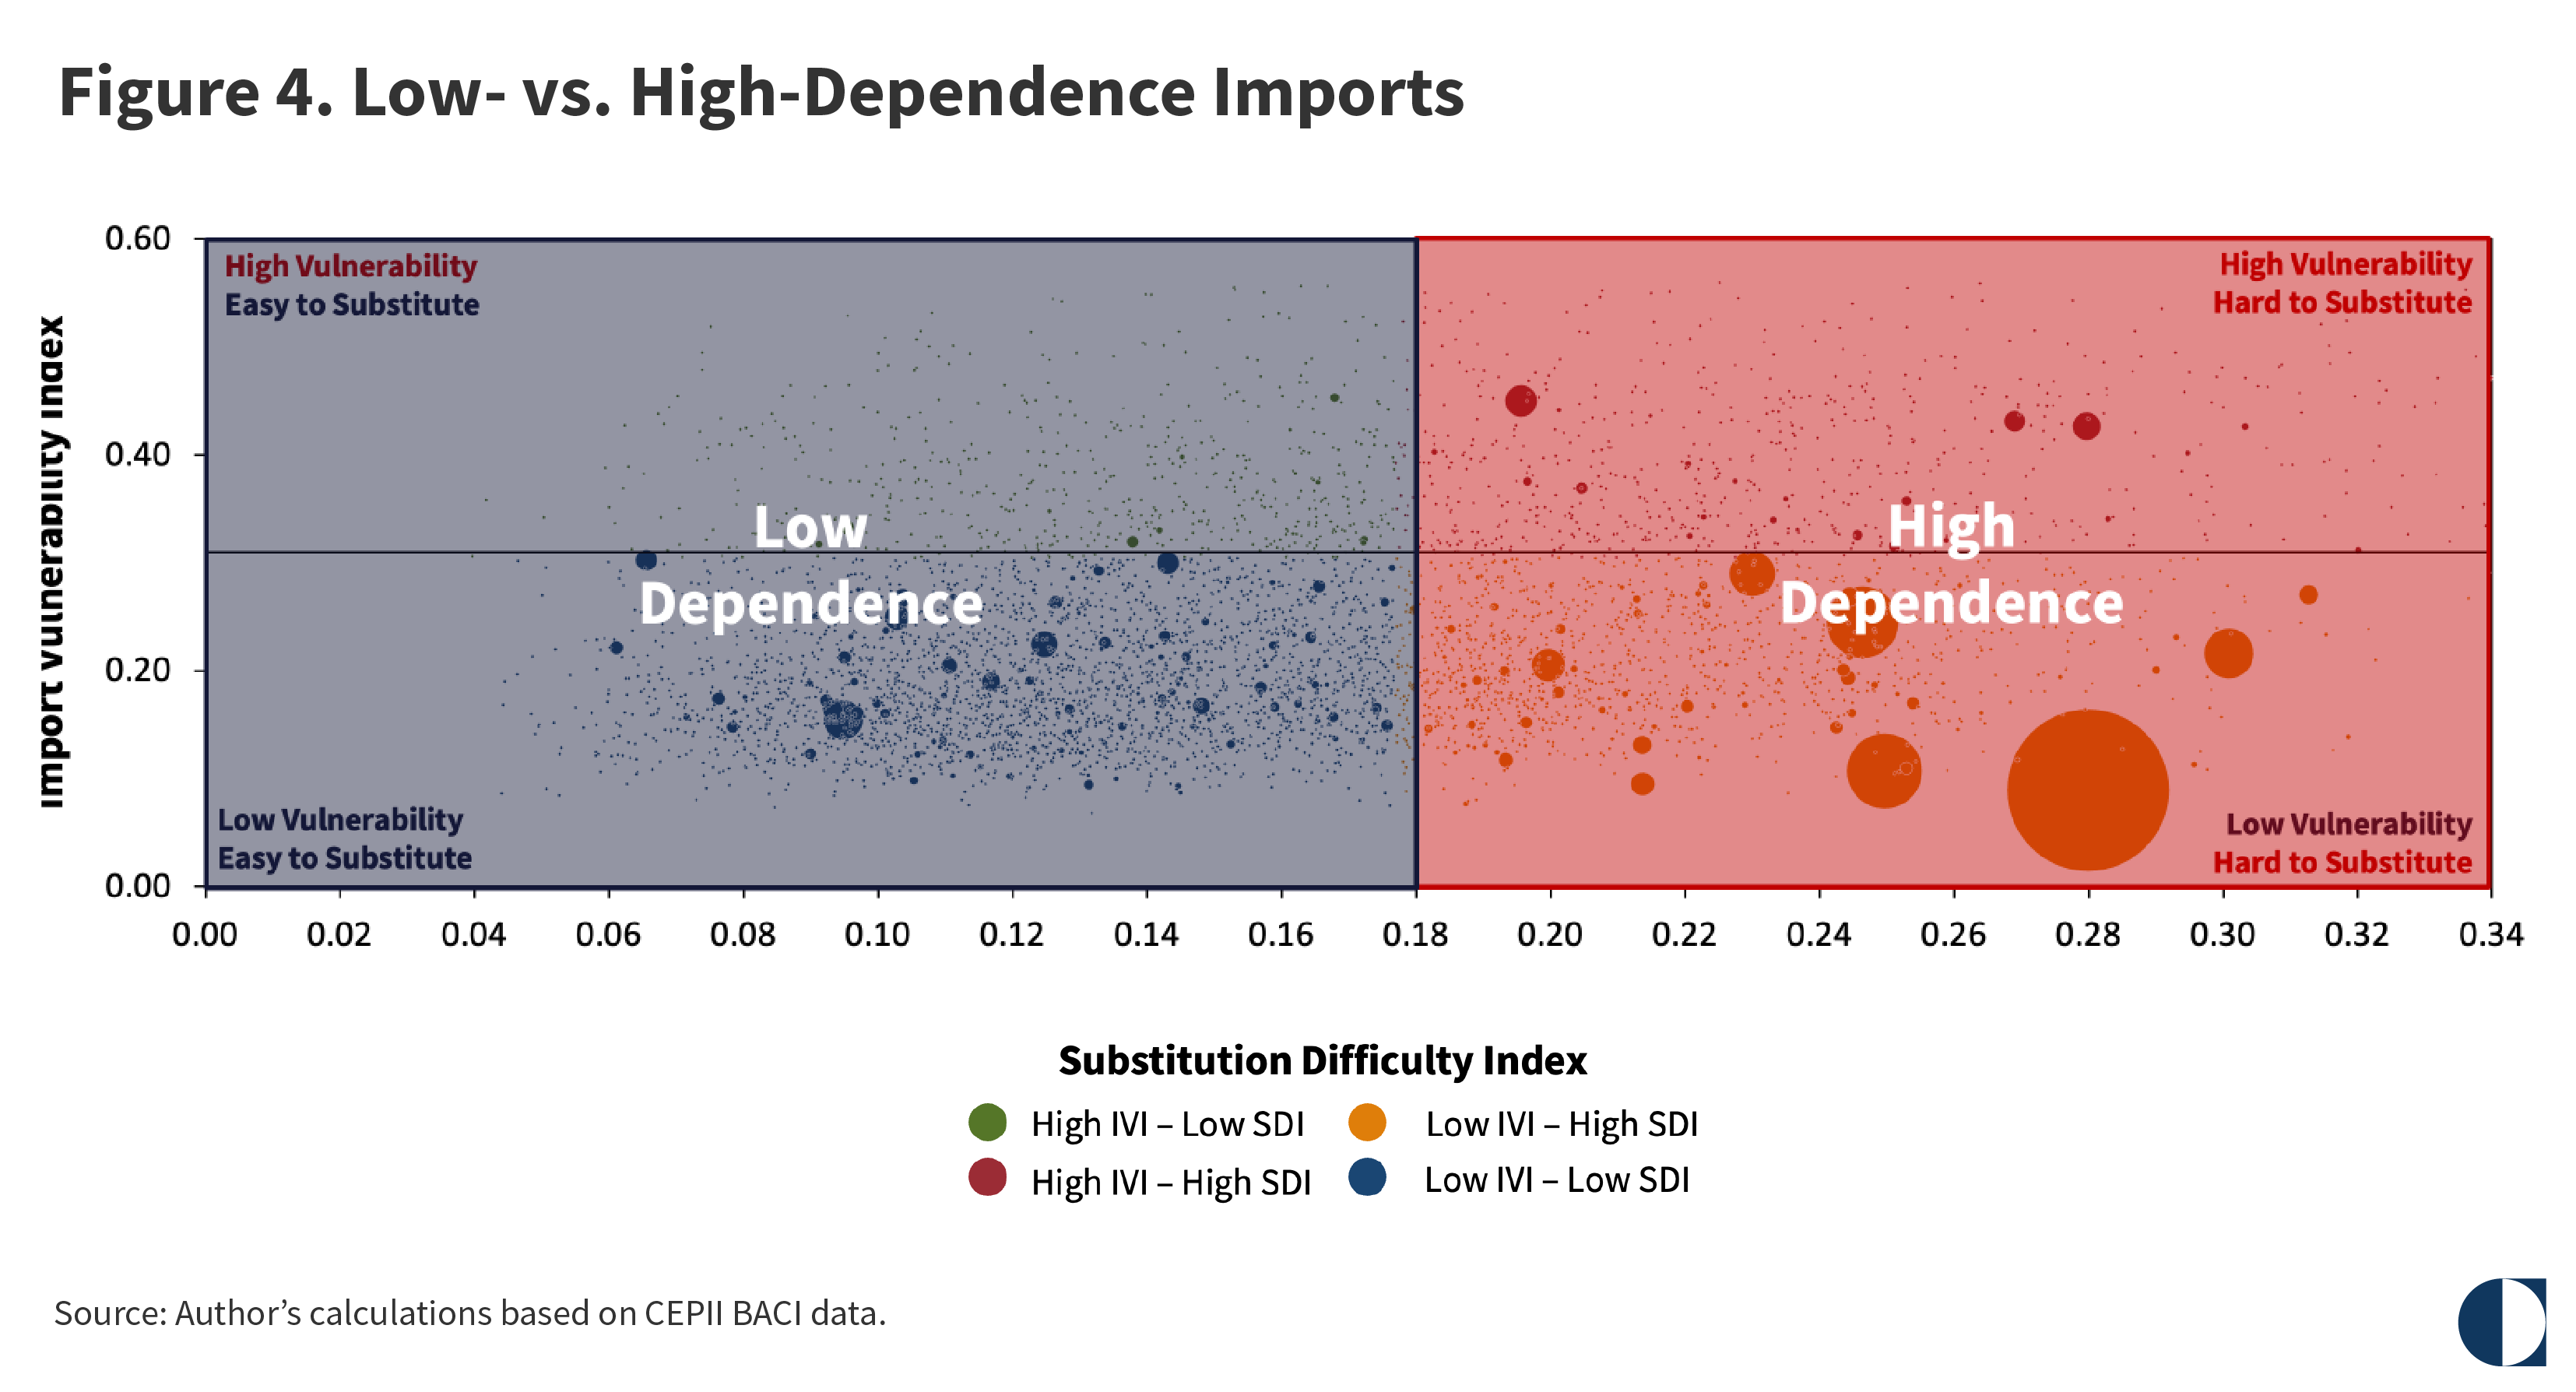
First, it is necessary to identify the imports with high SDI scores—that is, those products that pose significant challenges for replacement, regardless of their import vulnerability (see figure 4). For these high-dependence products, a short-term disruption can cause a significant economic impact, since replacement is extremely difficult or time consuming. High-dependence imports demand sustained policy attention to mitigate the strategic risks posed by substitution difficulties in an era of geoeconomic fragmentation.
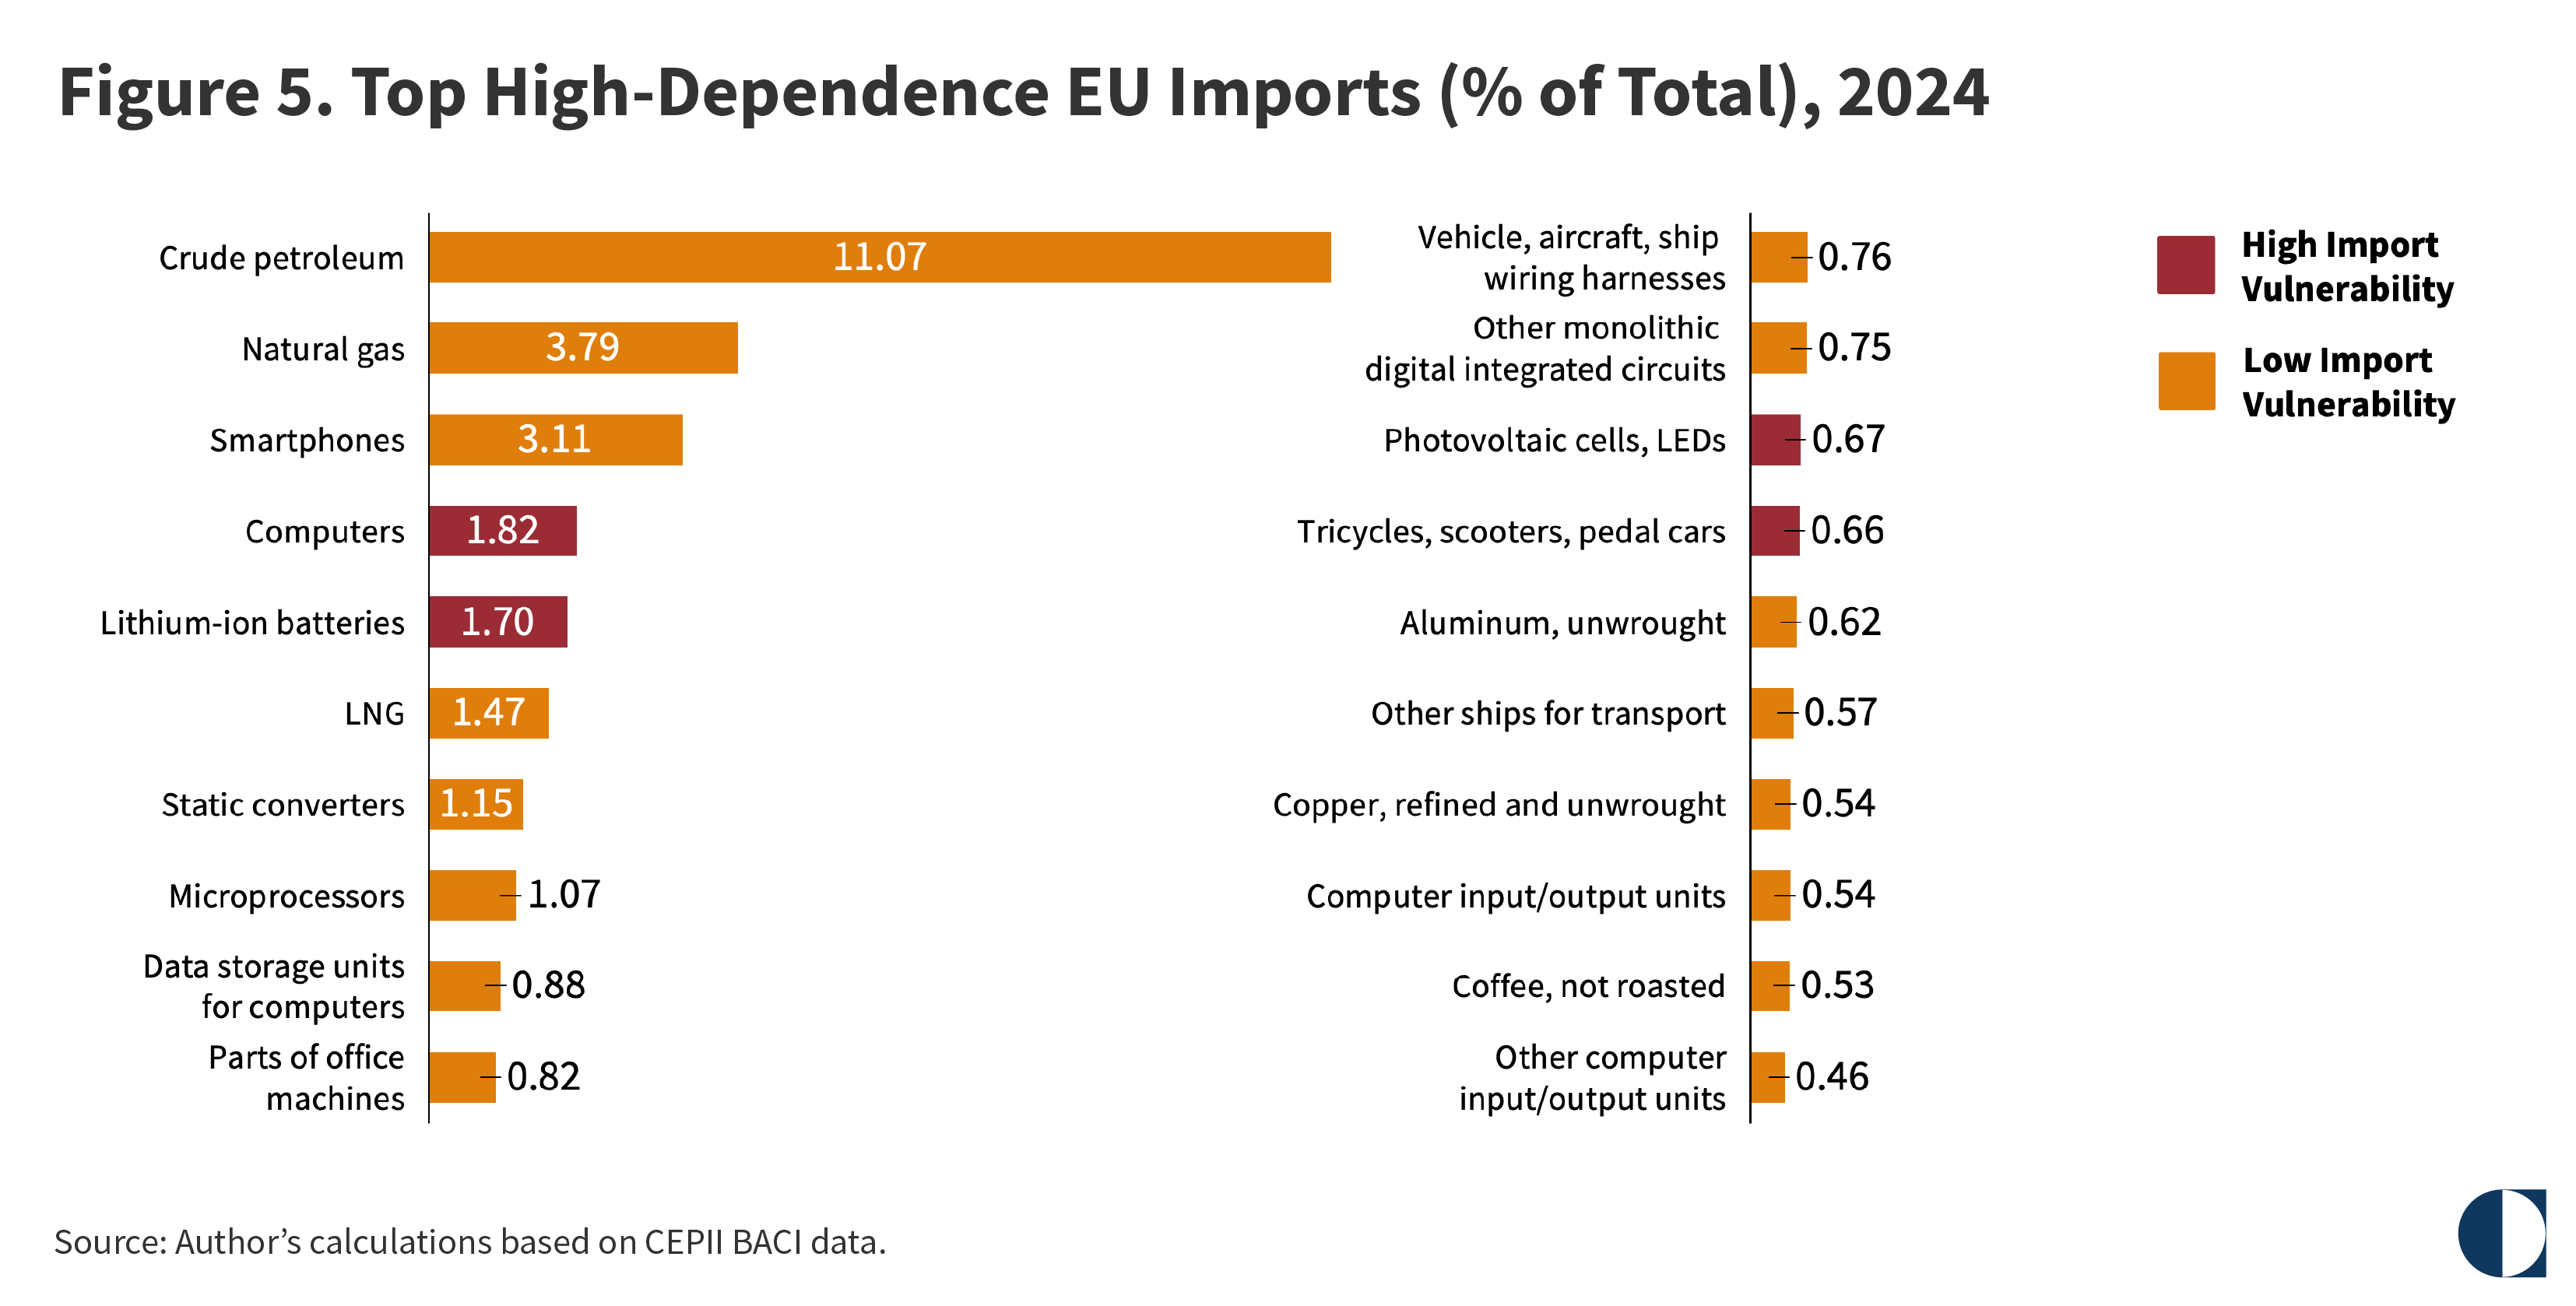
The EU’s top twenty high-dependence imports include energy products, such as crude petroleum, natural gas, and LNG; consumer electronics, like smartphones and computers; and electronic imports in manufacturing, such as lithium-ion batteries, static converters, microprocessors, data-storage units for computers, photovoltaic cells, monolithic digital integrated circuits, and wiring harnesses for vehicles (see figure 5).
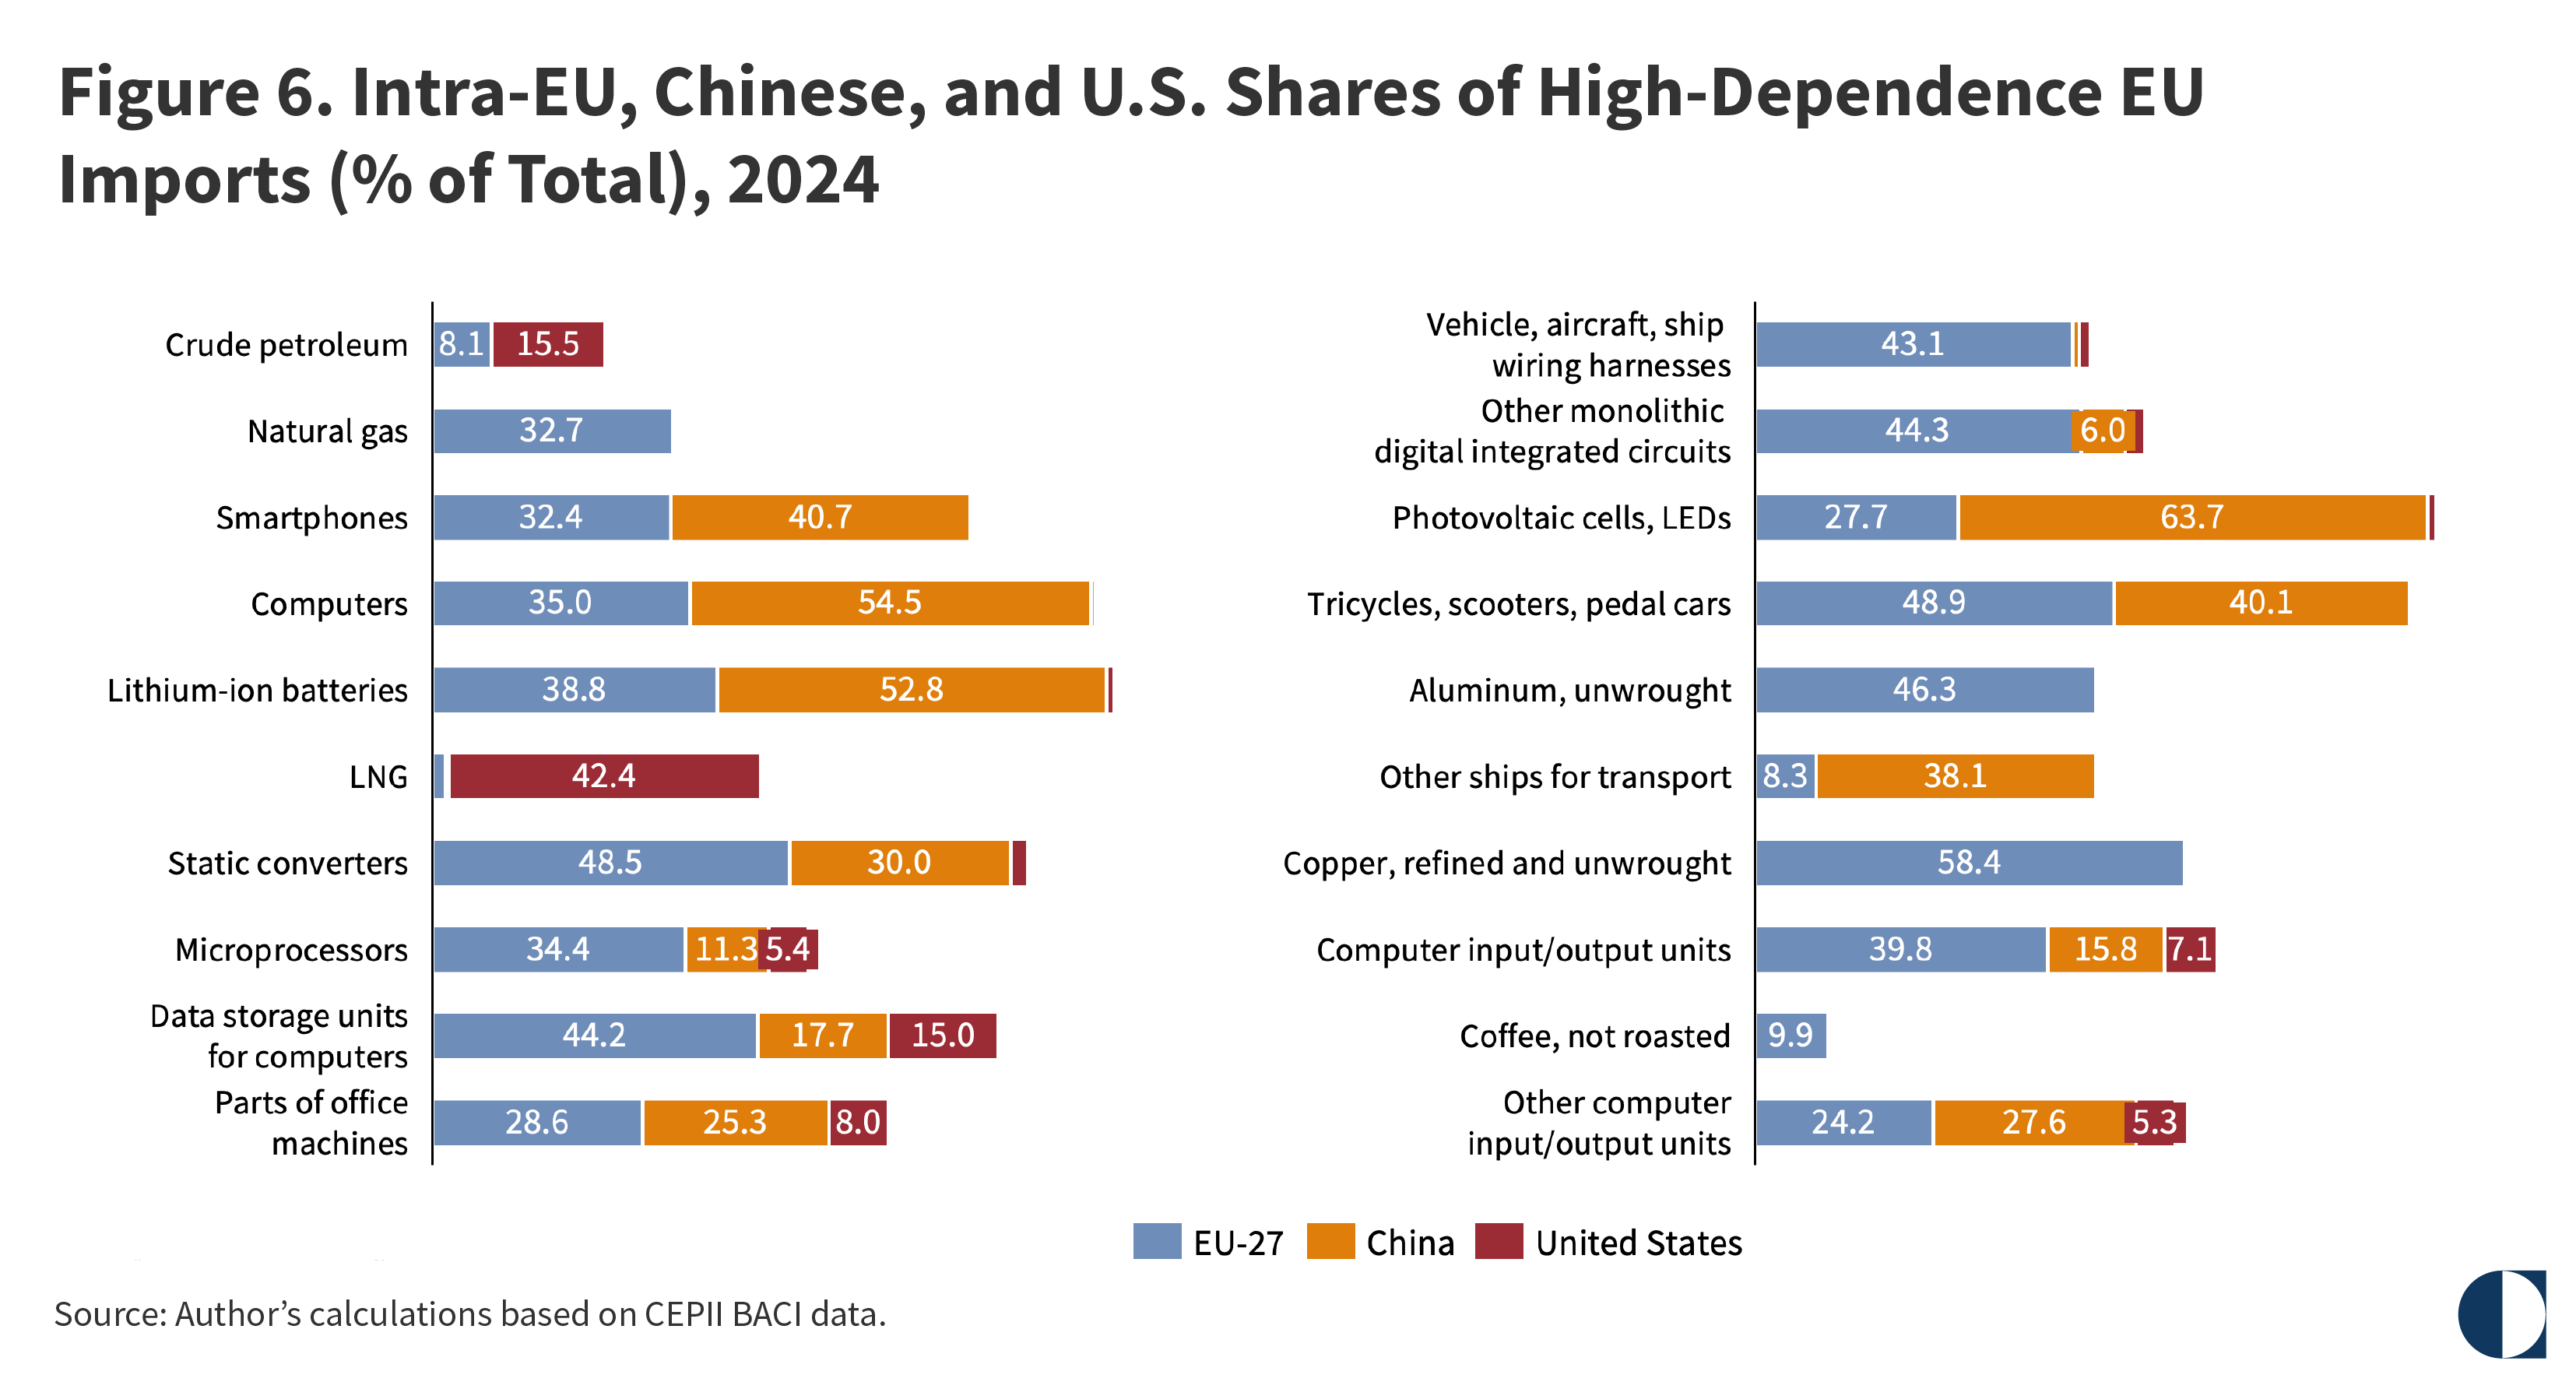
One important finding is that within the top twenty high-dependence imports, the EU has some capacity—at least on the surface—to reduce its reliance on external suppliers. In several industrial sectors in which China dominates EU imports, intra-EU trade also makes up a significant share. For instance, while China accounts for 52.8 percent of EU imports of lithium-ion batteries, intra-EU trade constitutes 38.8 percent. Similarly, in computers, China’s share stands at 54.5 percent, compared with 35 percent for intra-EU trade; in smartphones, China accounts for 40.7 percent, against 32.4 percent for trade within the EU; and in photovoltaic cells, China represents 63.7 percent, while intra-EU trade comprises 27.7 percent (see figure 6).
Some of these products are imported from China and then integrated into intra-EU trade flows, while others are manufactured within the EU by Chinese-affiliated firms. As a result, a more sophisticated analysis—one that examines trade dynamics from the standpoint of added value—would be needed to assess more robustly the EU’s internal capacity to be a genuine alternative to external partners. As things stand, the EU’s diversification efforts have been constrained by the energy-supply gap that emerged after the start of Russia’s war in Ukraine, combined with the EU’s growing dependence on crude petroleum and LNG, predominantly from the United States. This situation has critically impeded the EU’s strategic autonomy.
Once the high-dependence imports have been identified, the second step is to map the exporting countries that are relevant to the supply chains of these imports.
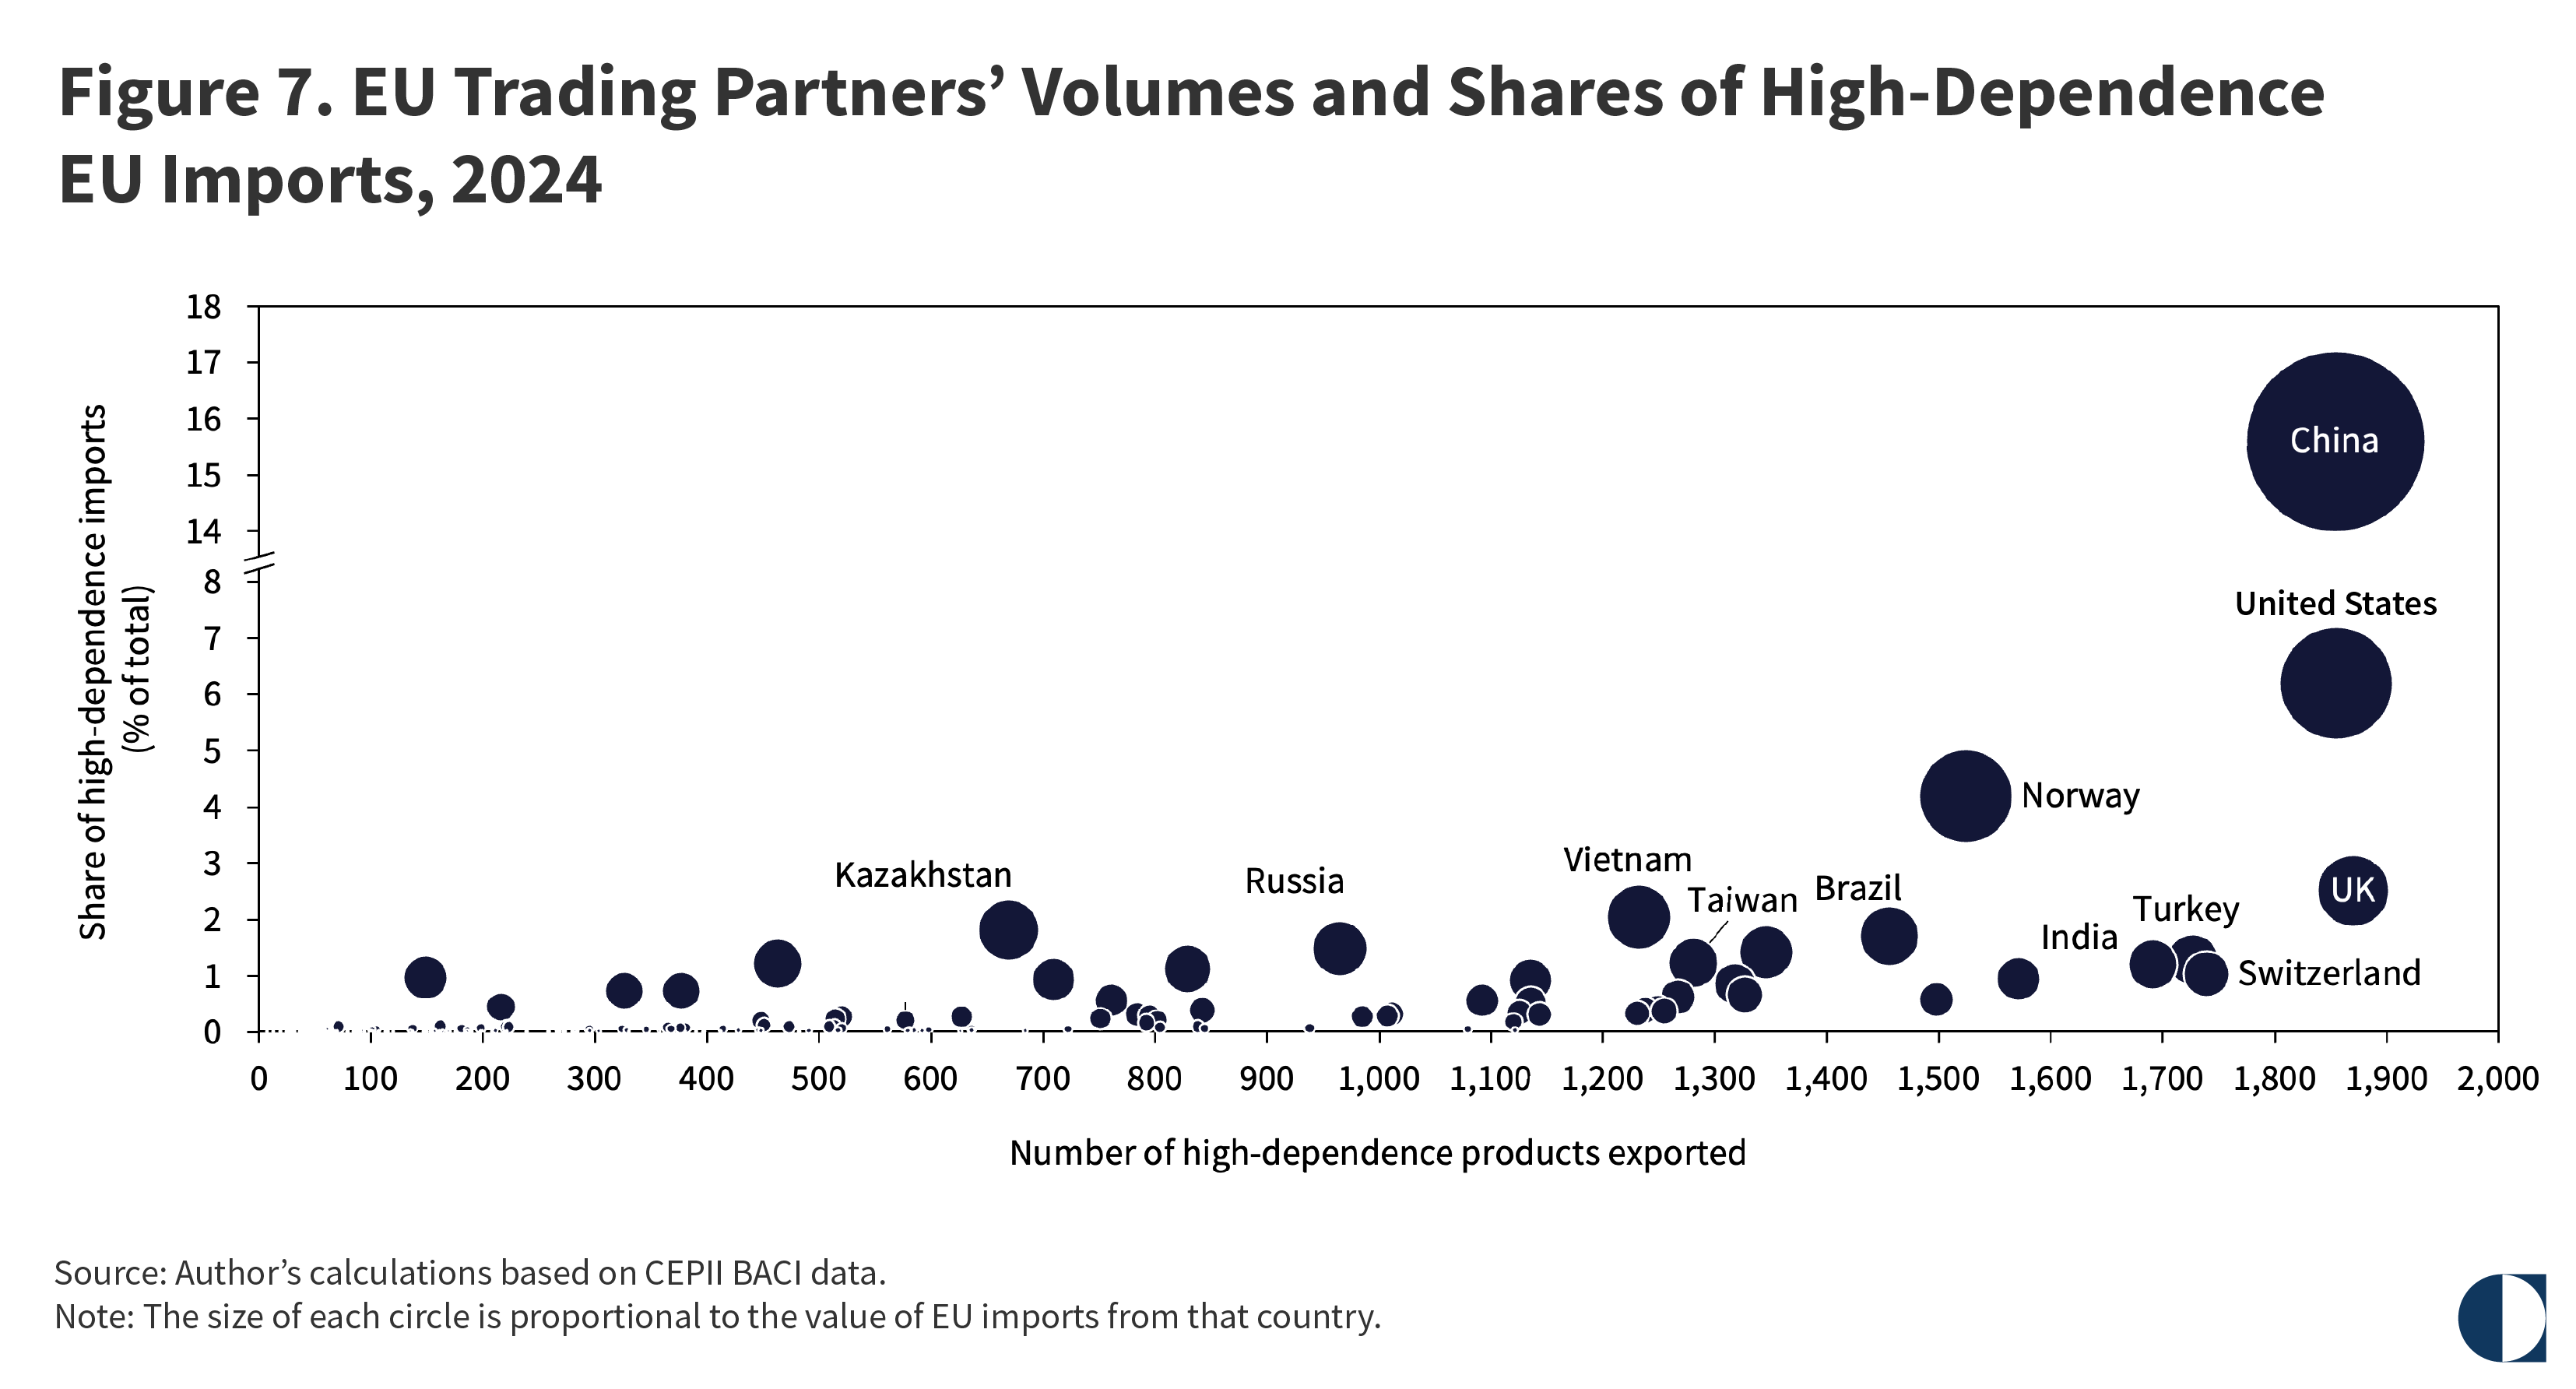
Among the non-EU countries that export high-dependence products to the EU, the United Kingdom (UK) leads with 1,870 products, followed closely by the United States with 1,855 products and China with 1,854. Switzerland, Turkey, and India are next, each with around 1,700 products. However, when measured in terms of import value rather than the number of products, these countries’ shares of high-dependence EU imports vary considerably. China accounts for 15.6 percent of all such imports, while the United States contributes 6.2 percent, Norway 4.2 percent, and the UK 2.5 percent (see figure 7).
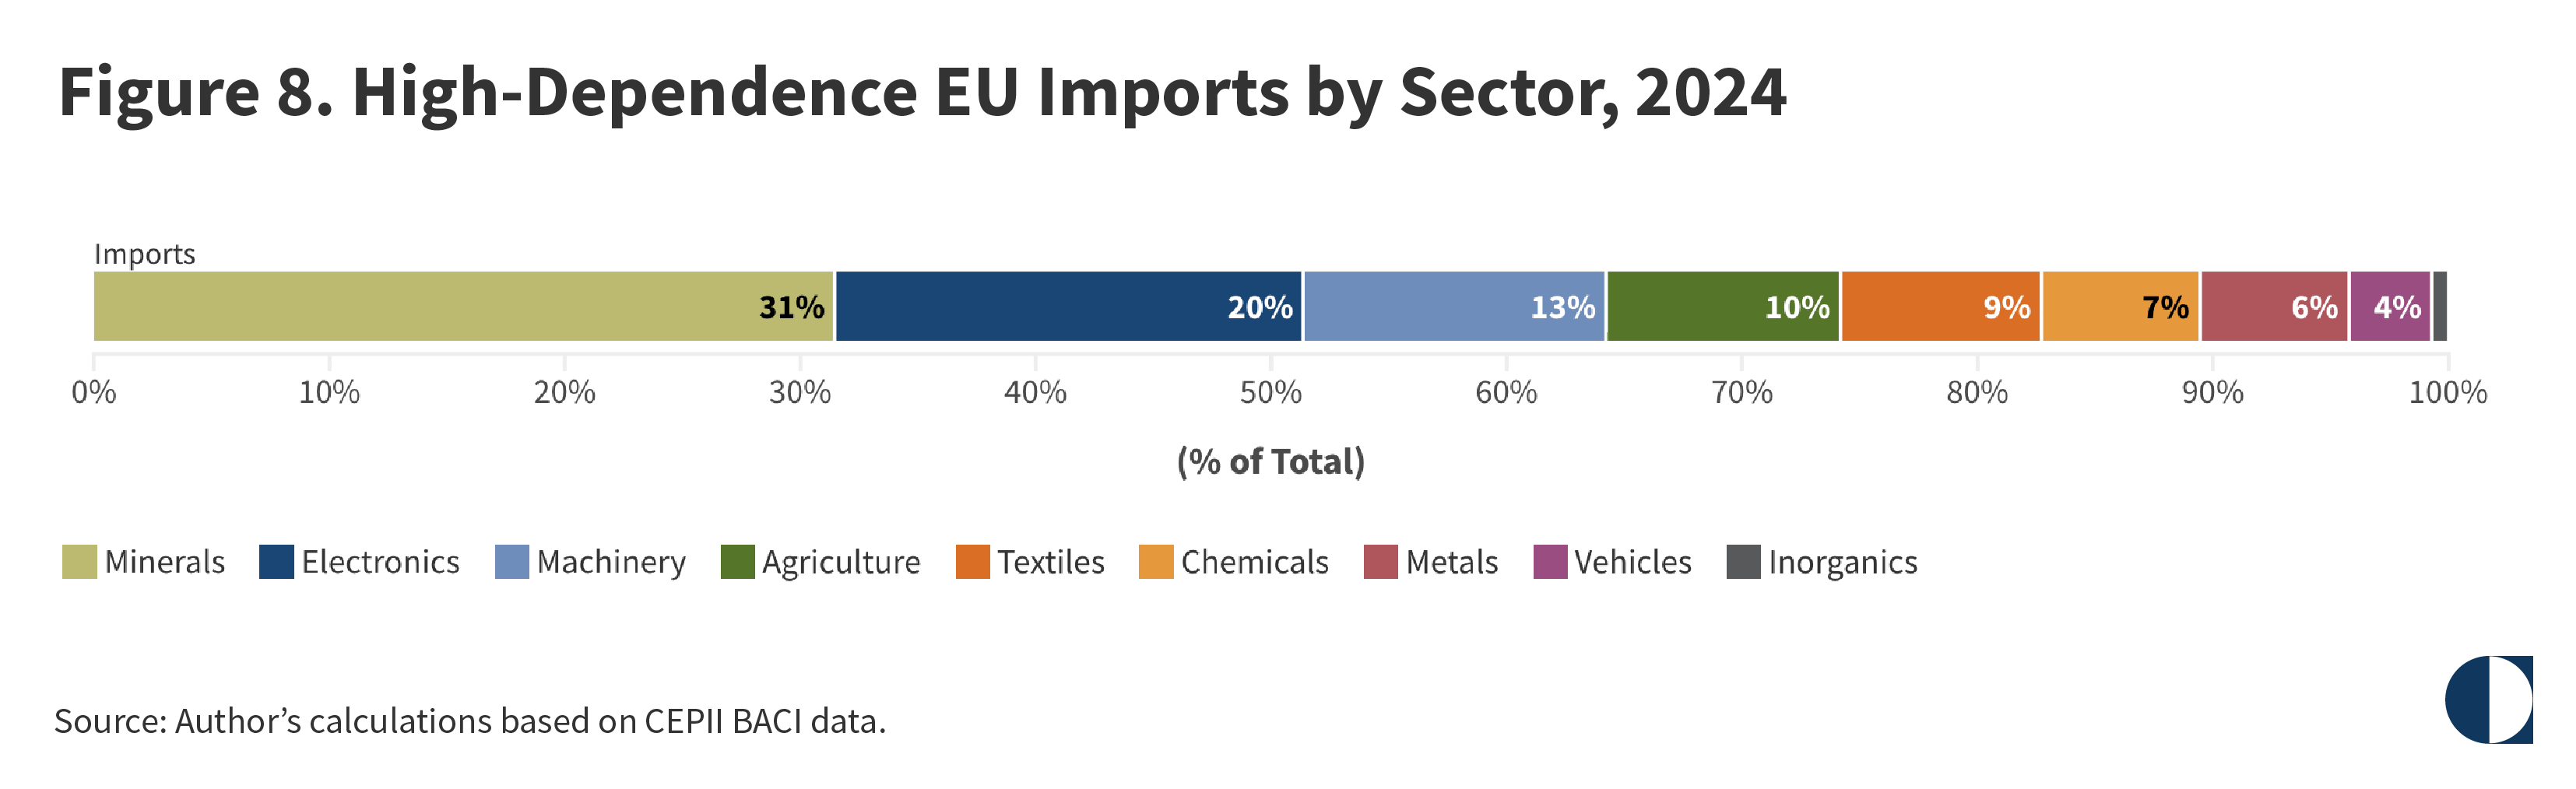
Meanwhile, a sectoral analysis of the EU’s high-dependence imports reveals that minerals constitute the largest product group, accounting for 31.3 percent of total imports, followed by electronics products (19.9 percent) and machinery (12.8 percent) (see figure 8). These figures also include intra-EU trade.
The distribution of the EU’s trading partners across high-dependence product groups reveals a striking variation in the union’s reliance on external suppliers. In minerals and agriculture, intra-EU trade dominates, making up 77 percent and 70.6 percent of each sector’s total imports, respectively, indicating that member states largely source these critical inputs from one another. Chemicals and metals similarly exhibit high EU-internal sourcing, although both show a notable presence of non-EU suppliers: The United States accounts for 8.9 percent of EU imports of chemicals and China for 8.0 percent of metals imports (see figure 9).
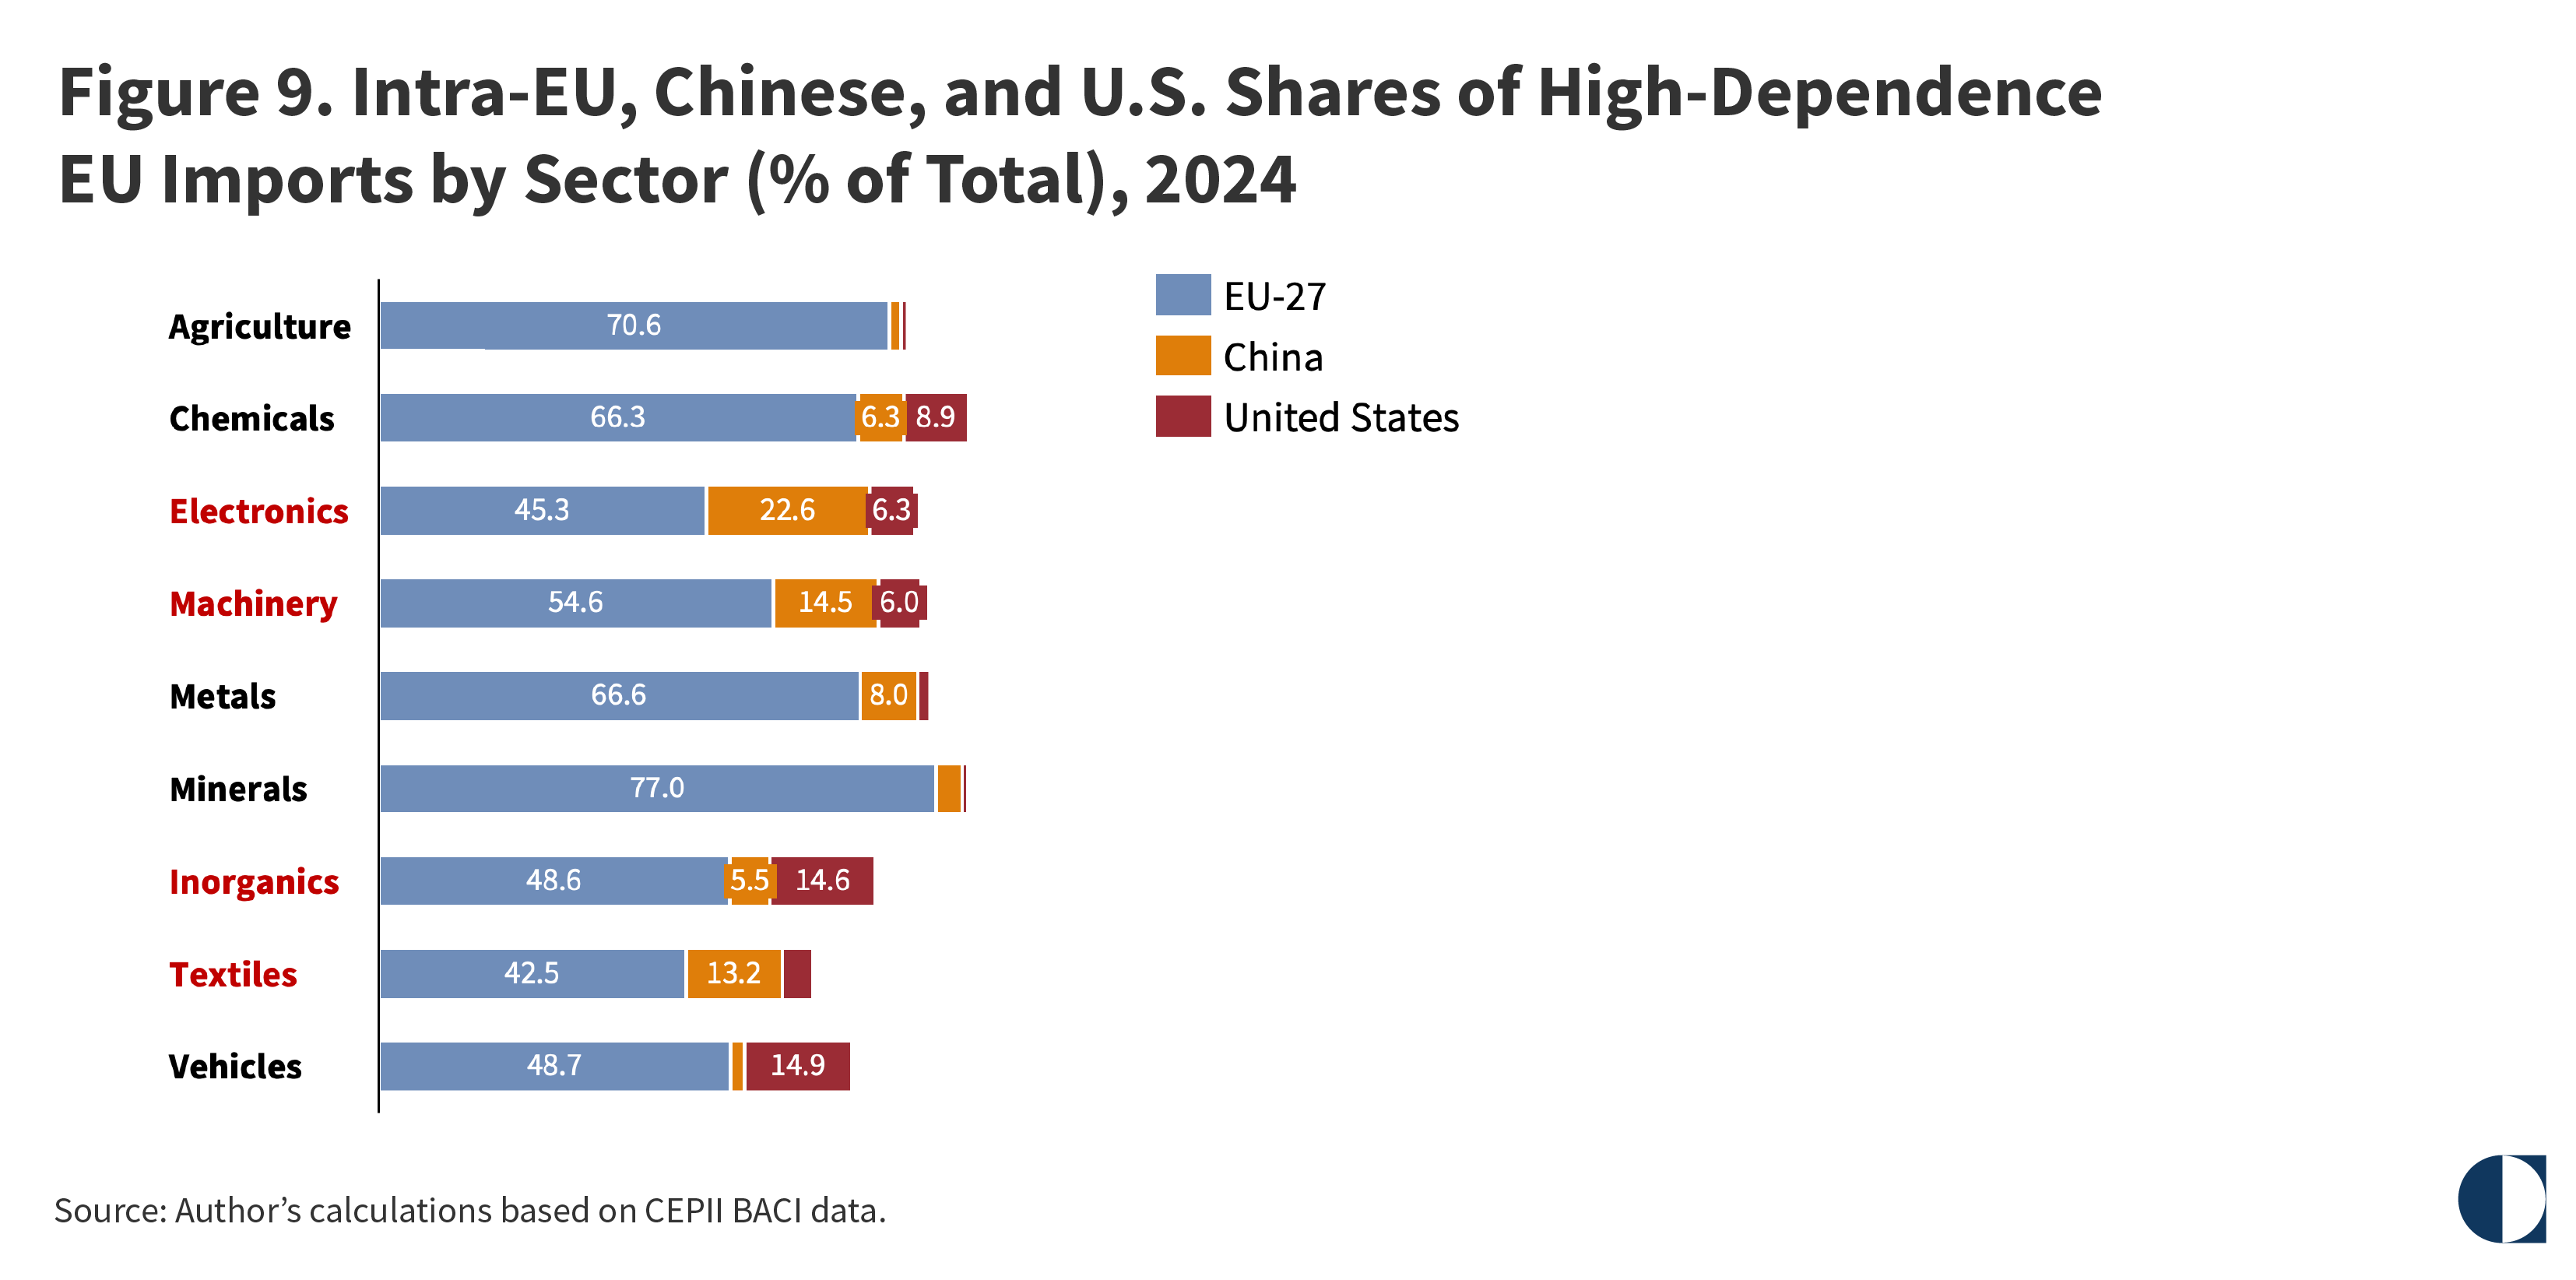
The picture shifts markedly for electronics, textiles, and vehicles, where the share of EU-internal imports falls below 50 percent. Textiles register the lowest share of intra-EU imports, at 42.5 percent, followed by electronics (45.3 percent) and inorganics (48.6 percent)—signaling that for these sectors, the union is structurally dependent on external supply chains. In electronics, China is the EU’s dominant external supplier, with 22.6 percent of total imports, more than triple the U.S. share. Machinery follows a similar pattern, with China at 14.5 percent outweighing the United States at 6.0 percent.
The China-U.S. balance is not uniform across all sectors, however. In inorganics, the United States has a nearly threefold advantage over China, and in vehicles, the United States is the EU’s sole significant external partner, with no visible Chinese presence. This suggests that U.S. supply-chain linkages with the EU are concentrated in capital-intensive and regulation-heavy sectors, whereas China’s penetration is strongest in labor-intensive manufacturing and consumer technology.
Notably, for several sectors—agriculture, minerals, and metals—neither China nor the United States appears as a significant supplier, pointing to the roles of other trading partners, such as Russia, Norway, Brazil, and various African and Middle Eastern nations.
The economic significance of these high-dependence products can be measured by their composite vulnerability-substitution score—a combination of the products’ IVI and SDI values—and by the share of EU gross domestic product (GDP) they represent. Doing so reveals important strategic distinctions. At the product level, crude petroleum stands out with the largest GDP footprint at approximately 1.45 percent, despite a moderate composite score of around 0.21. LNG and natural gas also occupy substantial positions, with GDP shares of roughly 0.35 percent and 0.25 percent, respectively, and notably higher composite scores (see figure 10).
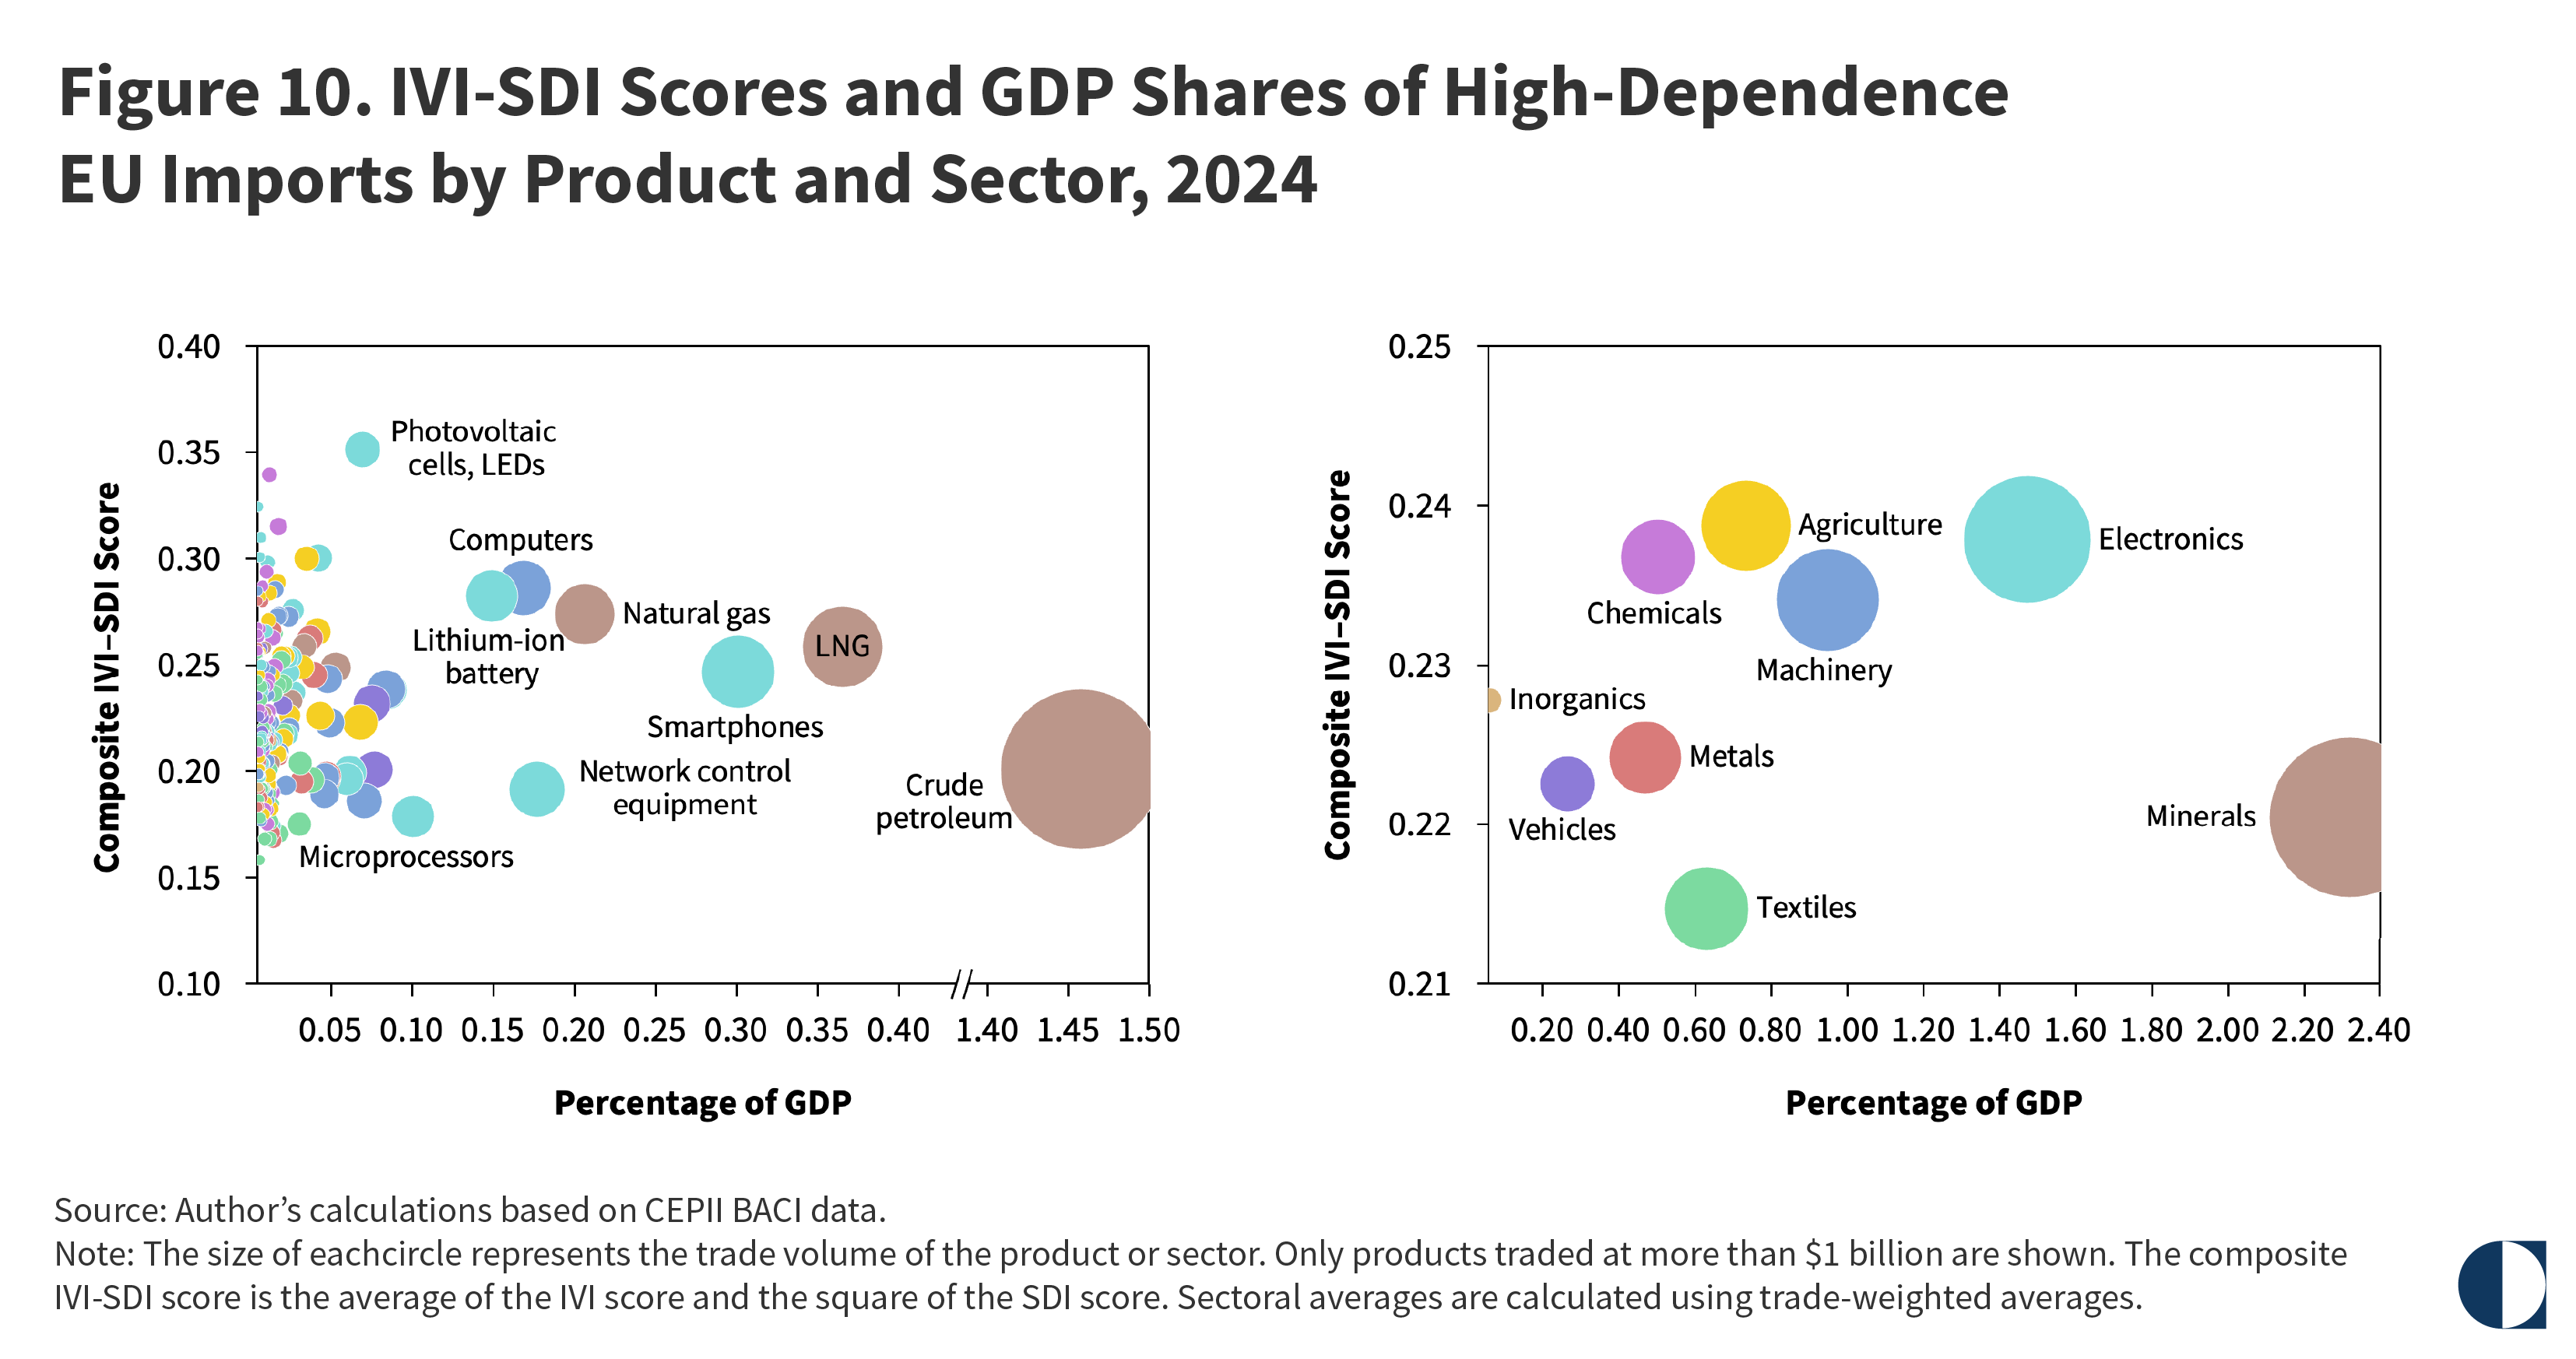
At the upper end of the spectrum, photovoltaic cells and light-emitting diodes (LEDs) have the highest combined level of supply vulnerability and substitution difficulty but a relatively small share of GDP. Computers, lithium-ion batteries, smartphones, network control equipment, and microprocessors cluster in the mid-range, each representing modest shares of GDP but elevated composite scores. This underscores that supply-side risk in electronics is distributed across multiple product lines.
When these products are aggregated to the sectoral level, the minerals sector emerges as especially critical: It accounts for approximately 2.3 percent of EU GDP—the largest share of any sector—and has an IVI-SDI score of around 0.22, reflecting both supply-side constraints, including limited diversity of suppliers, and substantial economic weight. Electronics and agriculture follow as the next most significant sectors, combining high composite scores with GDP shares of approximately 1 percent each. Machinery occupies a similar position. Chemicals and metals have moderate GDP footprints and mid-range composite scores.
In summary, the sectors that pose the greatest strategic concern are those that combine high economic significance with high potential disruption in terms of supply vulnerability and difficulty of substitution: minerals, electronics, agriculture, and machinery.
In reality, supply dependencies represent a dynamic equilibrium. They can change considerably over time, depending on industrial policy outcomes and international developments. From an economic security perspective, it is important to identify whether the new equilibrium after a given time period has increased or decreased the overall supply dependence. Here, the two years 2019 and 2024 are examined to assess the dynamic nature of EU economic security. This time frame allows for an evaluation of the transformative effects of the COVID-19 pandemic.
The data show that after the pandemic, some products that in 2019 had been easy to substitute because of their diverse supplier base became harder to replace as market supply became more concentrated among fewer countries. To capture this transformation, the affected products can be classified into two groups. In the first group are those products that between 2019 and 2024 moved into the high-vulnerability, hard-to-substitute quadrant of the vulnerability-substitution matrix; these are termed high-risk products. In the second group are products that were readily substitutable in 2019 but that by 2024, while retaining relatively low vulnerability, had become difficult to replace; that is, they moved into the low-vulnerability, hard-to-substitute quadrant. These are classified as emerging-risk products.
Together, these two classifications reveal products that have taken on renewed strategic importance in the evolving technological landscape. These developments require calibrated adjustments in the EU’s short-term trade policy and underscore the need for policymakers to direct their attention to specific products and technologies.
High-risk products are those that moved from a state of relative security in 2019, characterized by diversity of supply and ease of substitution, to one of acute strategic vulnerability by 2024, marked by exposure to supply-chain disruptions and significant substitution challenges. This category is particularly relevant in an era of geoeconomic fragmentation, when supply-chain dependencies can be leveraged as pressure points against the EU. Consequently, these products demand immediate policy attention through measures like accelerated reshoring or the negotiation of diversified sourcing agreements with allied nations to safeguard the EU market against the potential high risk of critical imports.
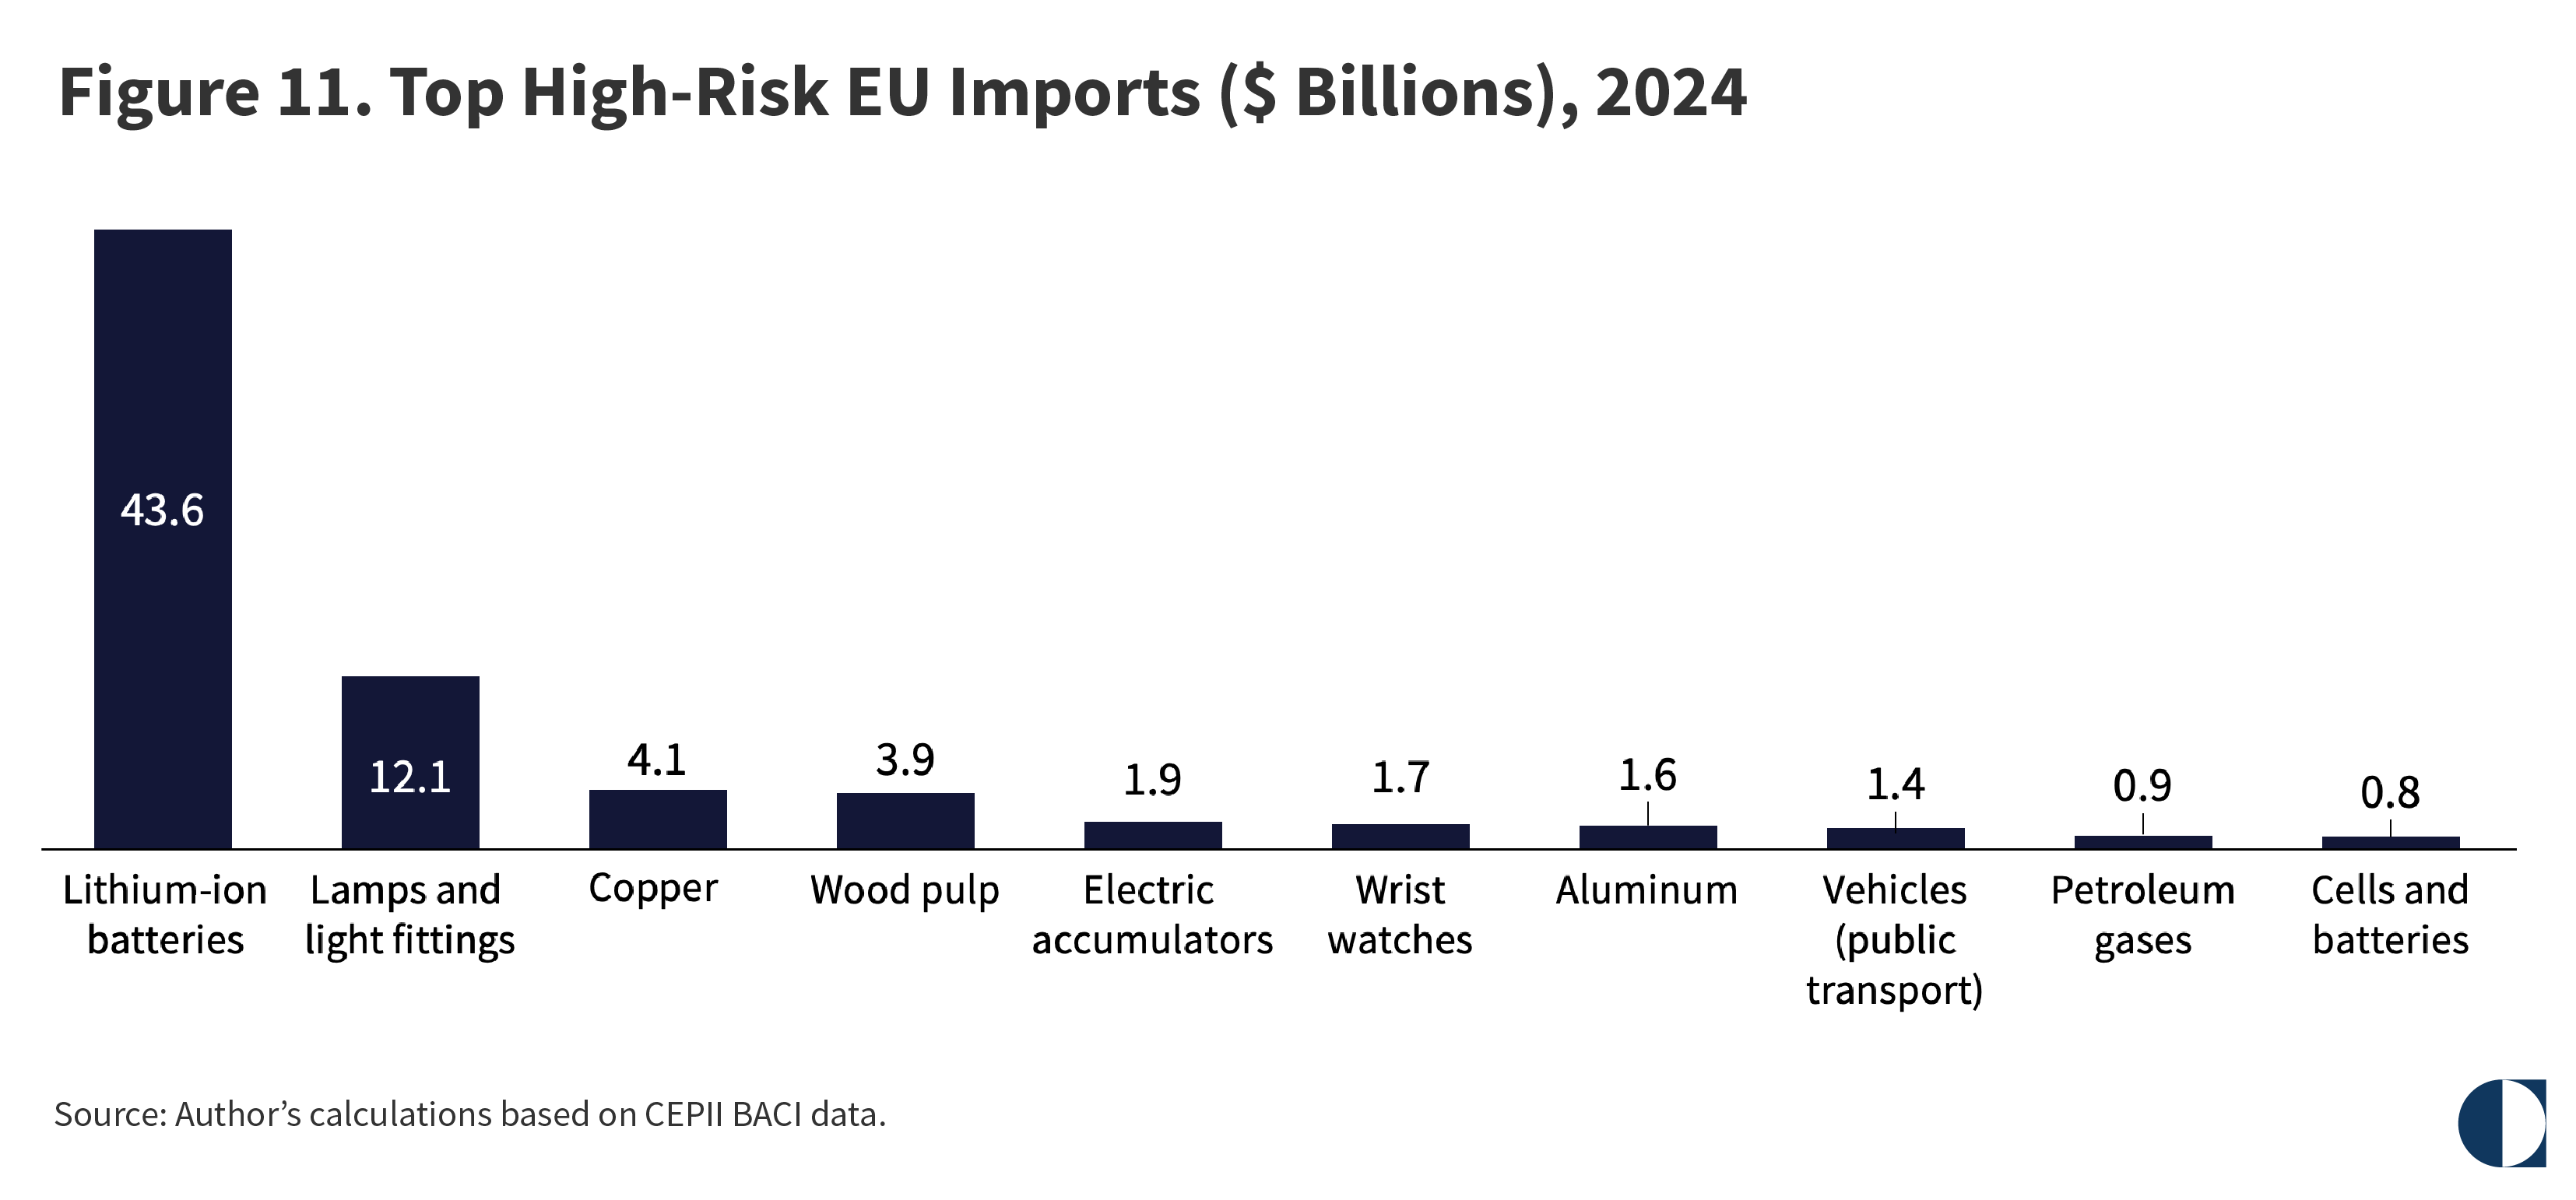
The total value of the high-risk products imported by the EU in 2024 was around $128 billion, accounting for 4.62 percent of the union’s overall imports. Although the product groups in this category are diverse, lithium-ion batteries emerge as the most significant, representing $47.6 billion, or nearly 37 percent of all high-risk imports (see figure 11). Initially used in consumer electronics, these batteries are now also integral to electric vehicles, mobility devices, and storage systems for solar power plants. These uses make these batteries a high-risk product and technology for digital and green transformations.
A sectoral analysis of the EU’s high-risk imports—which is different from the analysis of high-dependence imports above—reveals that electronics, mostly lithium-ion batteries, are the most significant sector, accounting for 40.6 percent of all high-risk imports by value. Despite Europe’s rapid expansion in battery manufacturing through domestic champions like Northvolt and ACC, along with significant Asian investments in Hungary and Germany, the EU remains strategically dependent on Chinese technology and imports for lithium-ion batteries. Even though battery production exists in the EU, the battery supply chain still relies on Chinese intellectual property, critical components, and finished cells. This persistent dual dependence on both Chinese technology and Chinese imports creates a structural vulnerability for the EU, as the union’s domestic production capacity cannot guarantee technological sovereignty or supply-chain resilience.
As for the suppliers of the EU’s high-risk imports, intra-EU sourcing dominates in several categories, particularly vehicles, metals, chemicals, and agriculture (see figure 12). This suggests that even among high-risk products, European supply networks provide an important degree of resilience in these sectors. However, external exposure remains relevant: China accounts for about a quarter of high-risk chemicals imports and just under one-fifth of machinery imports, while the United States plays a smaller but visible role in selected sectors, especially minerals.
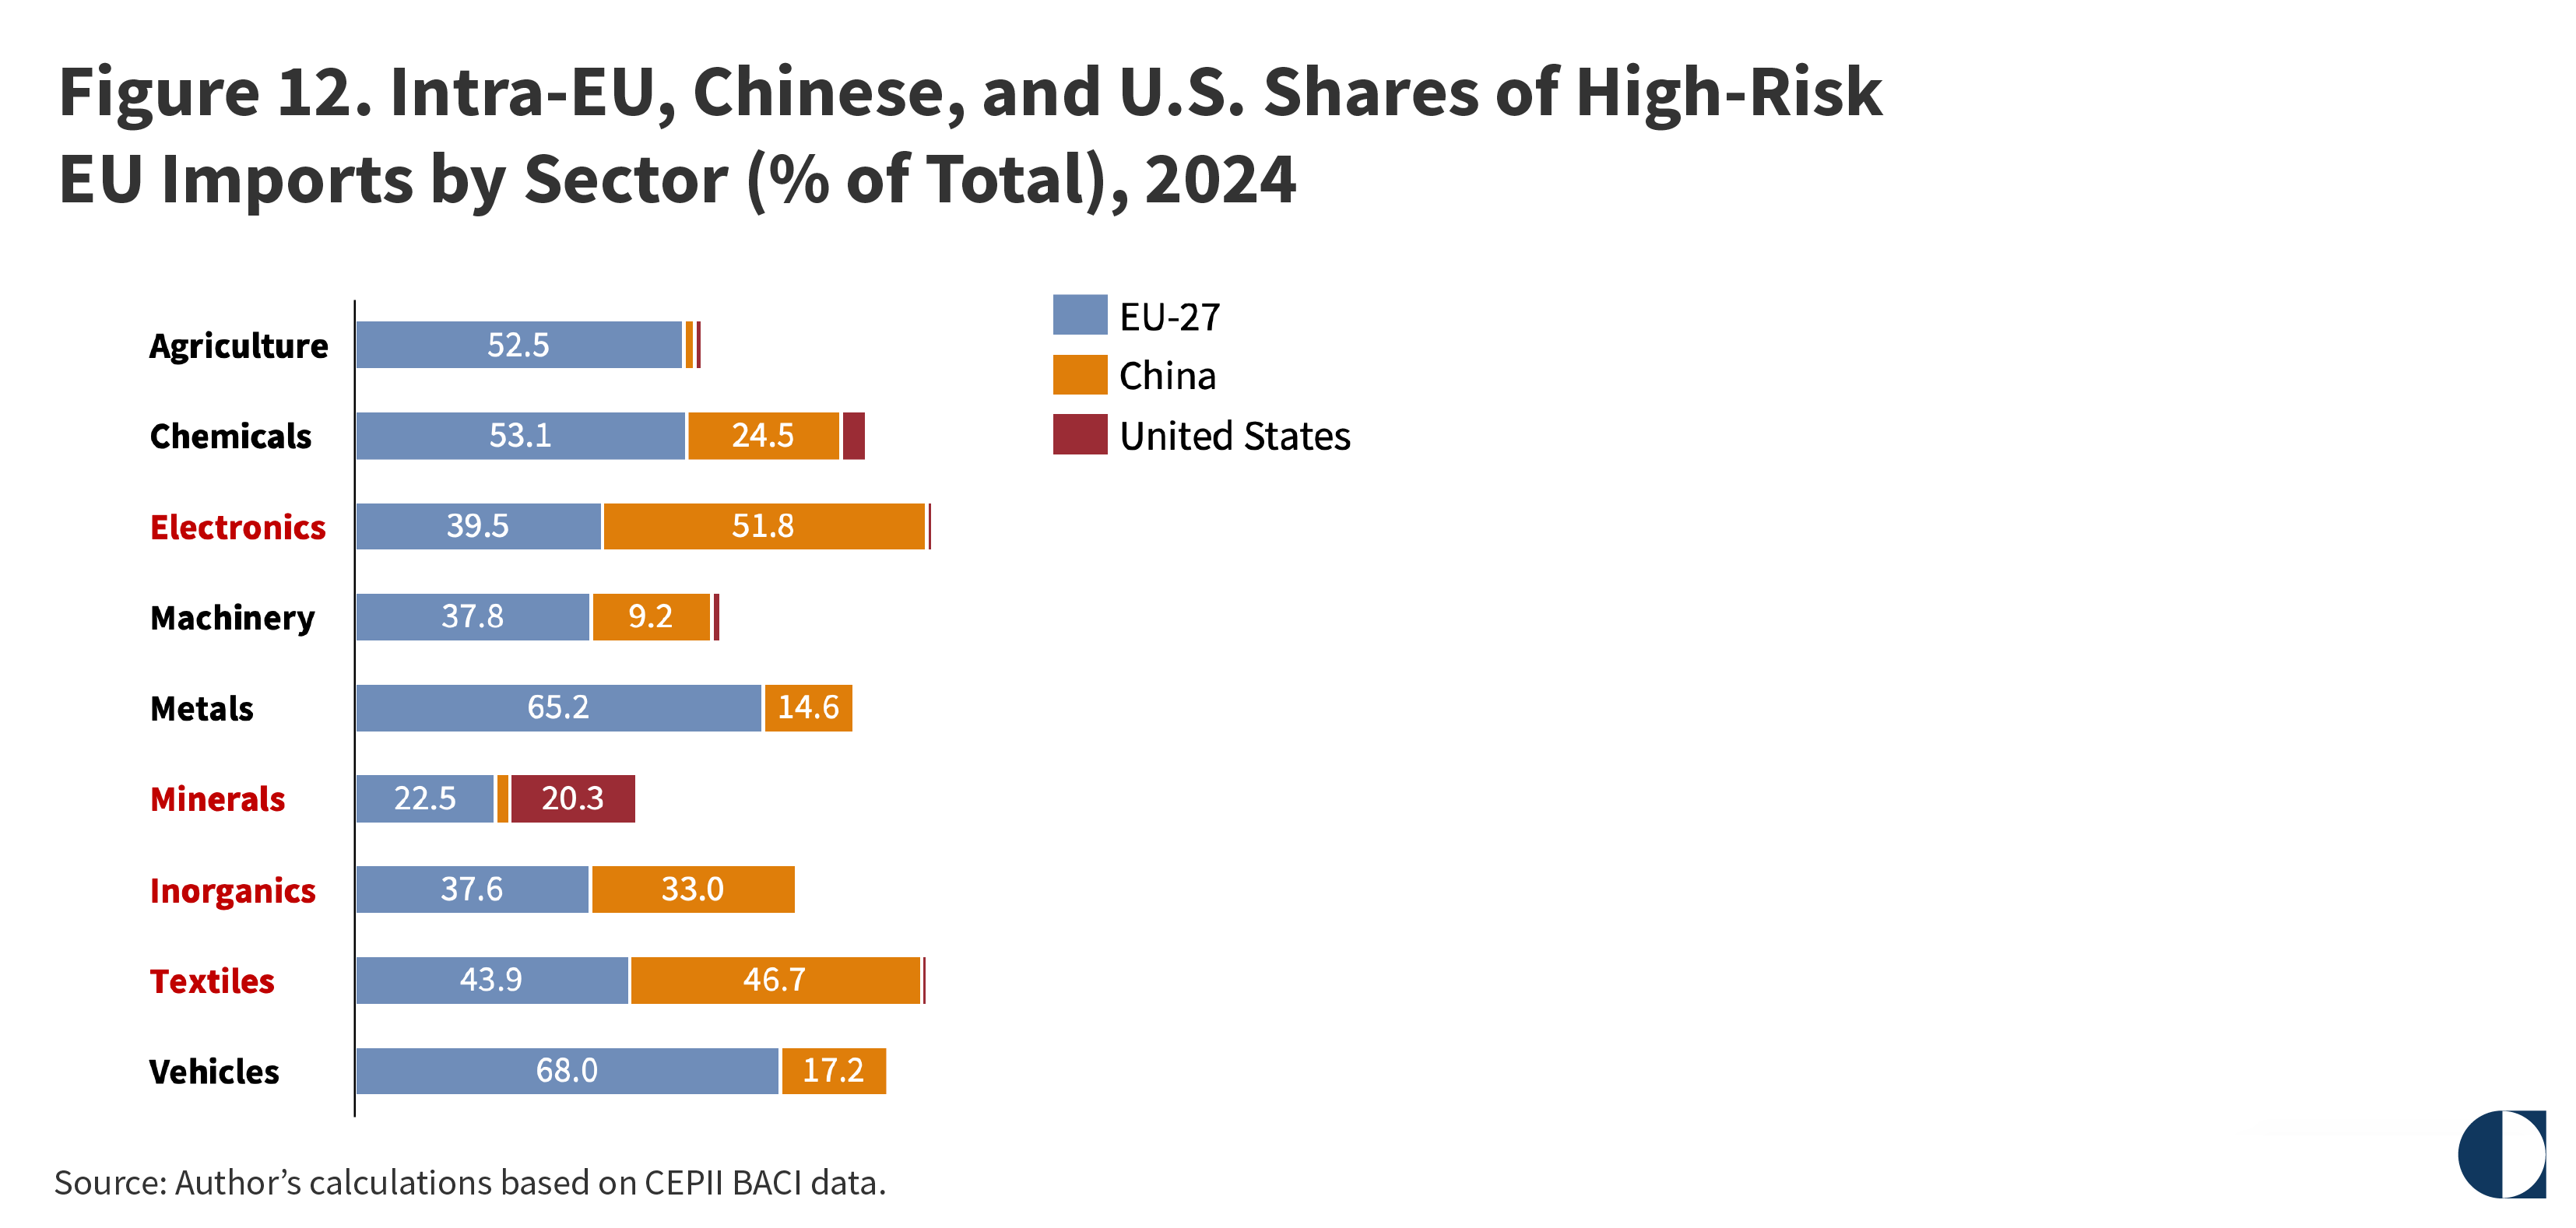
The sectors of greatest concern are those in which intra-EU sourcing is comparatively weaker and China has a particularly strong position. Electronics stand out most clearly, with China accounting for just over half of all EU high-risk imports, well above the intra-EU share of around 40 percent. Textiles show a similar pattern, with China’s share of the EU’s imports in this sector slightly exceeding the intra-EU share, indicating substantial exposure to Chinese supply. Inorganics also deserve attention, as China’s share is close to that of the EU, suggesting a relatively balanced but potentially vulnerable sourcing structure.
By contrast, minerals present a distinctive pattern. The intra-EU share is relatively low at 22.5 percent of the total, while the United States accounts for 20.3 percent, making minerals the only sector in which the United States plays a role comparable to that of the EU itself. This suggests that for minerals, high-risk exposure is driven primarily not by China but by broader dependence on external suppliers, including transatlantic sources. This distinction is strategically relevant given ongoing uncertainty about U.S. trade policy and the potential need to reinforce more secure and diversified supply chains.
Emerging-risk products are those that transitioned from a diversity of suppliers in 2019 to a gradual consolidation of supply by 2024 but without suffering import vulnerability. Despite import flows remaining stable, production has become concentrated in a limited number of countries. Given accelerating shifts in trade policy, emerging-risk products may rapidly become high risk, potentially outpacing policy responses. In this context, it is crucial to identify affected supply chains early and take preemptive action to diversify them. Targeted measures, such as maintaining supplier diversity, securing long-term agreements with key partners, and holding low to moderate precautionary stocks, are essential elements of strategic trade policy for these products.
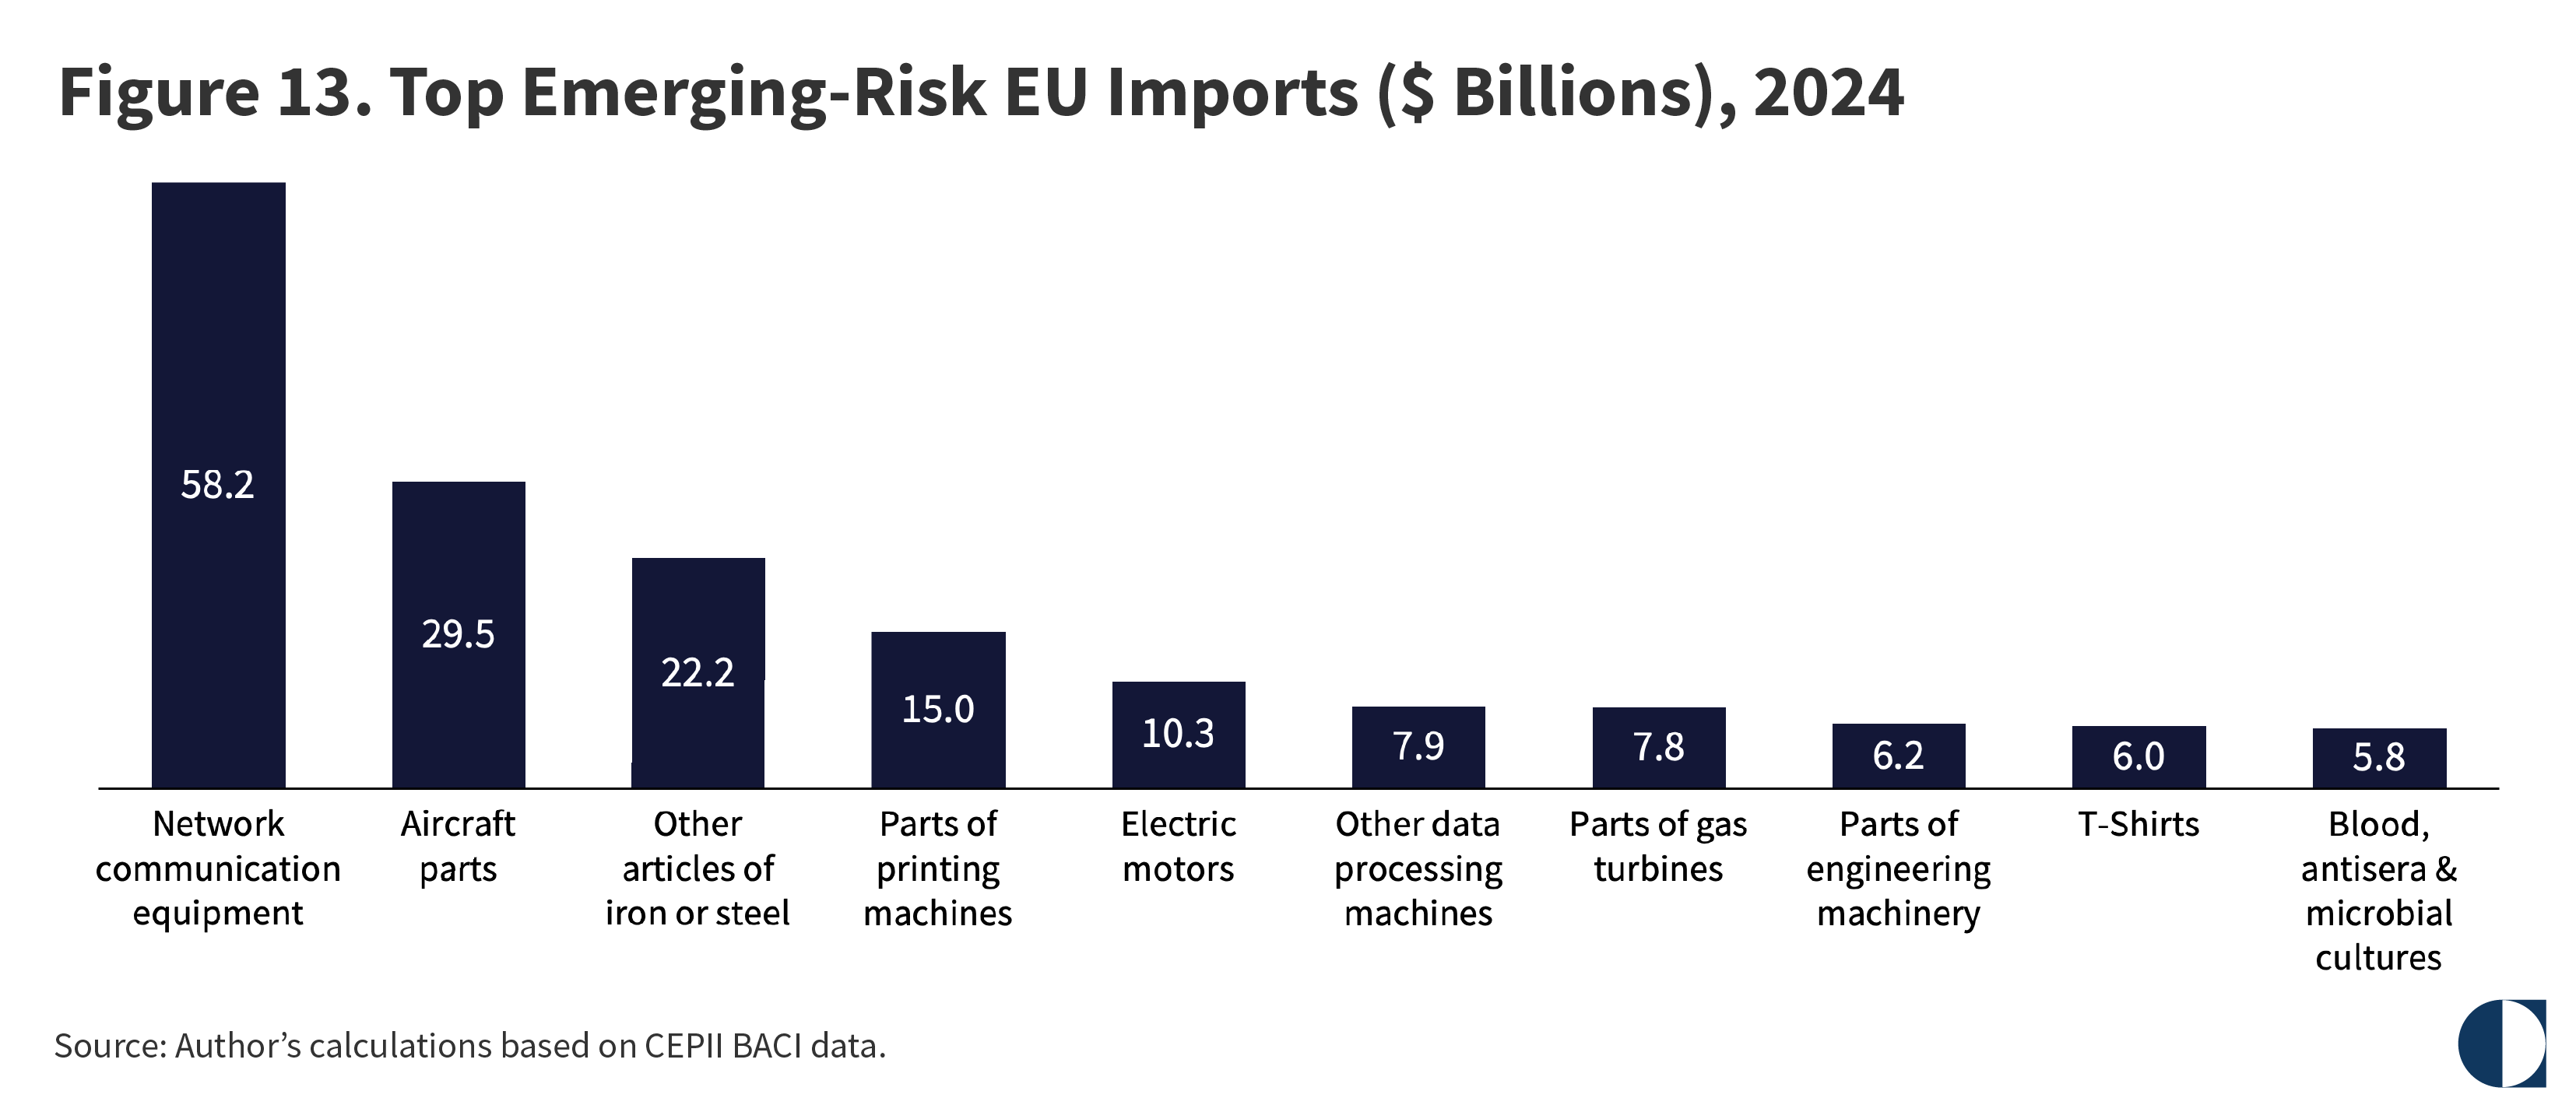
In 2024, the EU imported 267 emerging-risk products out of a total of 5,238. The total value of these emerging-risk imports was around $341 billion, accounting for 12.2 percent of the union’s overall imports. Major product groups included network communication equipment, electric motors, and other data-processing machines, whose imports were together worth $76.4 billion (see figure 13). Also significant were aircraft parts, printing machines, and engineering machines.
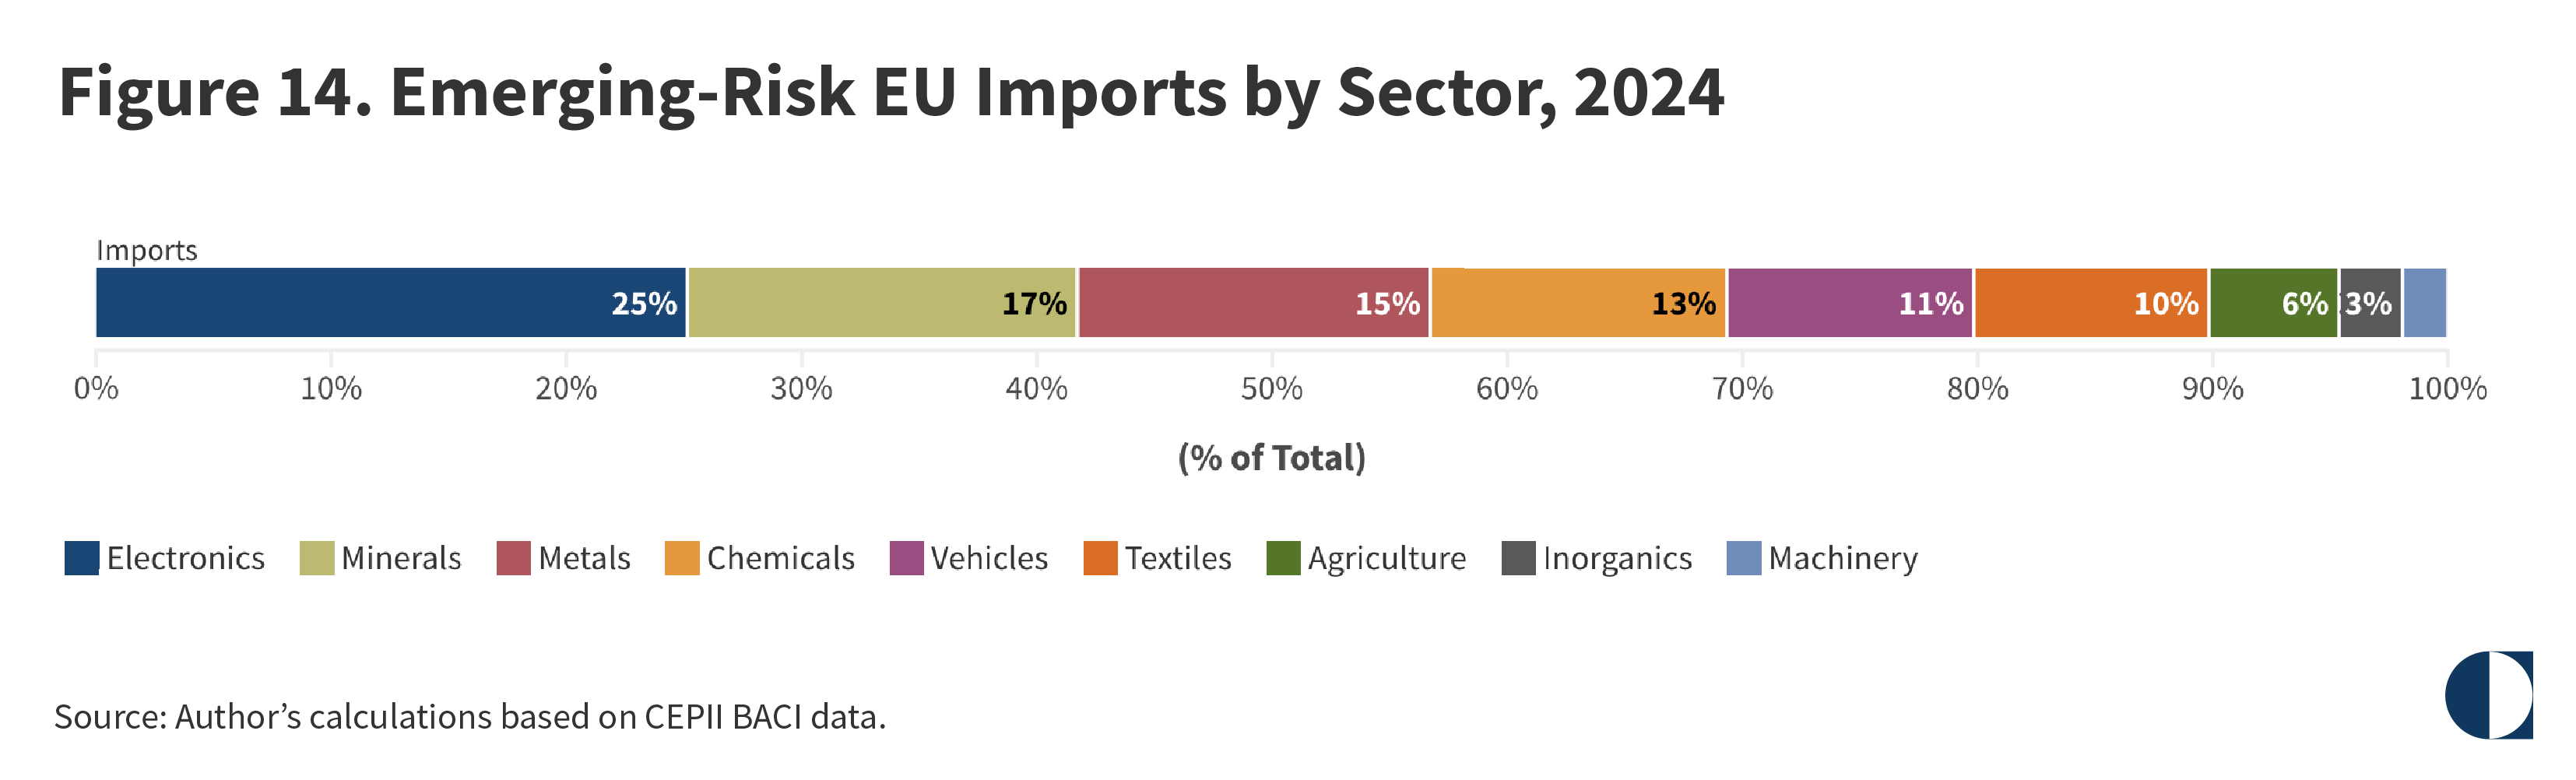
The sectoral composition of emerging-risk products is markedly different from that of high-dependence imports. Whereas minerals dominate the high-dependence category, they account for only a marginal share of emerging-risk products. Instead, electronics lead the makeup of emerging-risk EU imports, with 25.1 percent of the total, followed by machinery, metals, chemicals, vehicles, and textiles. Agriculture and inorganics occupy smaller shares (see figure 14).
These observations have significant implications. The prominence of electronics and machinery in the emerging-risk category suggests that the EU’s future vulnerabilities will be increasingly concentrated in technology-intensive and capital-goods sectors—precisely those in which China’s role as an external supplier is most pronounced. Metals and chemicals, which occupy moderate positions in both the EU’s high-dependence imports and its emerging-risk imports, appear to be transitioning from manageable exposure toward more acute vulnerability.
Notably, the lower share of minerals in the emerging-risk category does not signal reduced concern for this sector. Rather, it reflects the fact that mineral dependencies have already been consolidated into the high-dependence category. By contrast, the higher shares of vehicles and textiles among the EU’s emerging-risk imports—compared with their modest presence in the high-dependence group—indicate that these sectors may be approaching a tipping point at which supply concentration starts to become a strategic liability.
The overall picture suggests that the EU’s dependence frontier is shifting from primary commodities toward manufactured and technology-intensive goods, a trend that aligns with broader patterns of Chinese industrial upgrading and export diversification.
The distribution of the EU’s trading partners across these emerging-risk product groups broadly mirrors the patterns observed for high-dependence imports, but the policy implications differ: These are sectors in which early intervention and supply-chain diversification could prevent future strategic exposure.
The fact that external suppliers’ shares of the EU’s emerging-risk imports closely resemble their shares of high-dependence imports underscores a critical warning: The EU’s current patterns of supplier concentration are self-reinforcing. Without an active policy of diversification, today’s emerging risks are likely to become tomorrow’s entrenched dependencies.
The most important insight of this section, captured by the distinction between high risk and emerging risk, is that the gravest vulnerabilities may stem not from goods already recognized as high risk but from those whose risk profiles are still taking shape. For the EU, the strategic problem lies less in goods that have already been identified as high risk—which are visible as such and are increasingly subject to mitigation—than in those whose exposure is accumulating more quietly. In these cases, the concentration of suppliers is deepening gradually, the scope for substitution is narrowing, and the political risk remains subdued but potentially significant.
This section explores the potential of politically induced threats to the integrity of the EU’s supply chains. In the realm of security studies, threat analysis generally involves a twin determination of capability and intent. In other words, a country is viewed as a real threat if it is both able and willing to harm the national interests of another.
The same paradigm can be applied to the EU’s supply-chain vulnerabilities. In the multipolar era, supply chains function as latent instruments of coercion. In this context, the geopolitical salience of a trade partner depends not only on its trade volume but also on its ability to disrupt system-enabling inputs and its political willingness to do so. This geopolitical analysis therefore focuses on both the potential and the likelihood of an EU trade partner weaponizing its supply relationship with the union.
First, the question of capability is addressed by reformulating the mapping of trade dependencies. The rationale is that a trade partner’s capability to inflict harm on the integrity of EU supply chains depends not only on the total number of product groups that underpin these dependencies (the so-called extensive margin) but also on the real and negative impact that a discontinuity in the supply relationship would have across the value chain of the productive economy (the intensive margin). The latter element is derived by ranking the trade dependencies based on the depth of forward linkages of identified product groups.
This produces a list of EU supply dependencies weighted according to their criticality in industrial production, resulting in a remapping of the EU’s trade vulnerabilities (see figure 15). This mapping determines the potential arena for the EU’s trading partners to exert their disruptive capabilities.
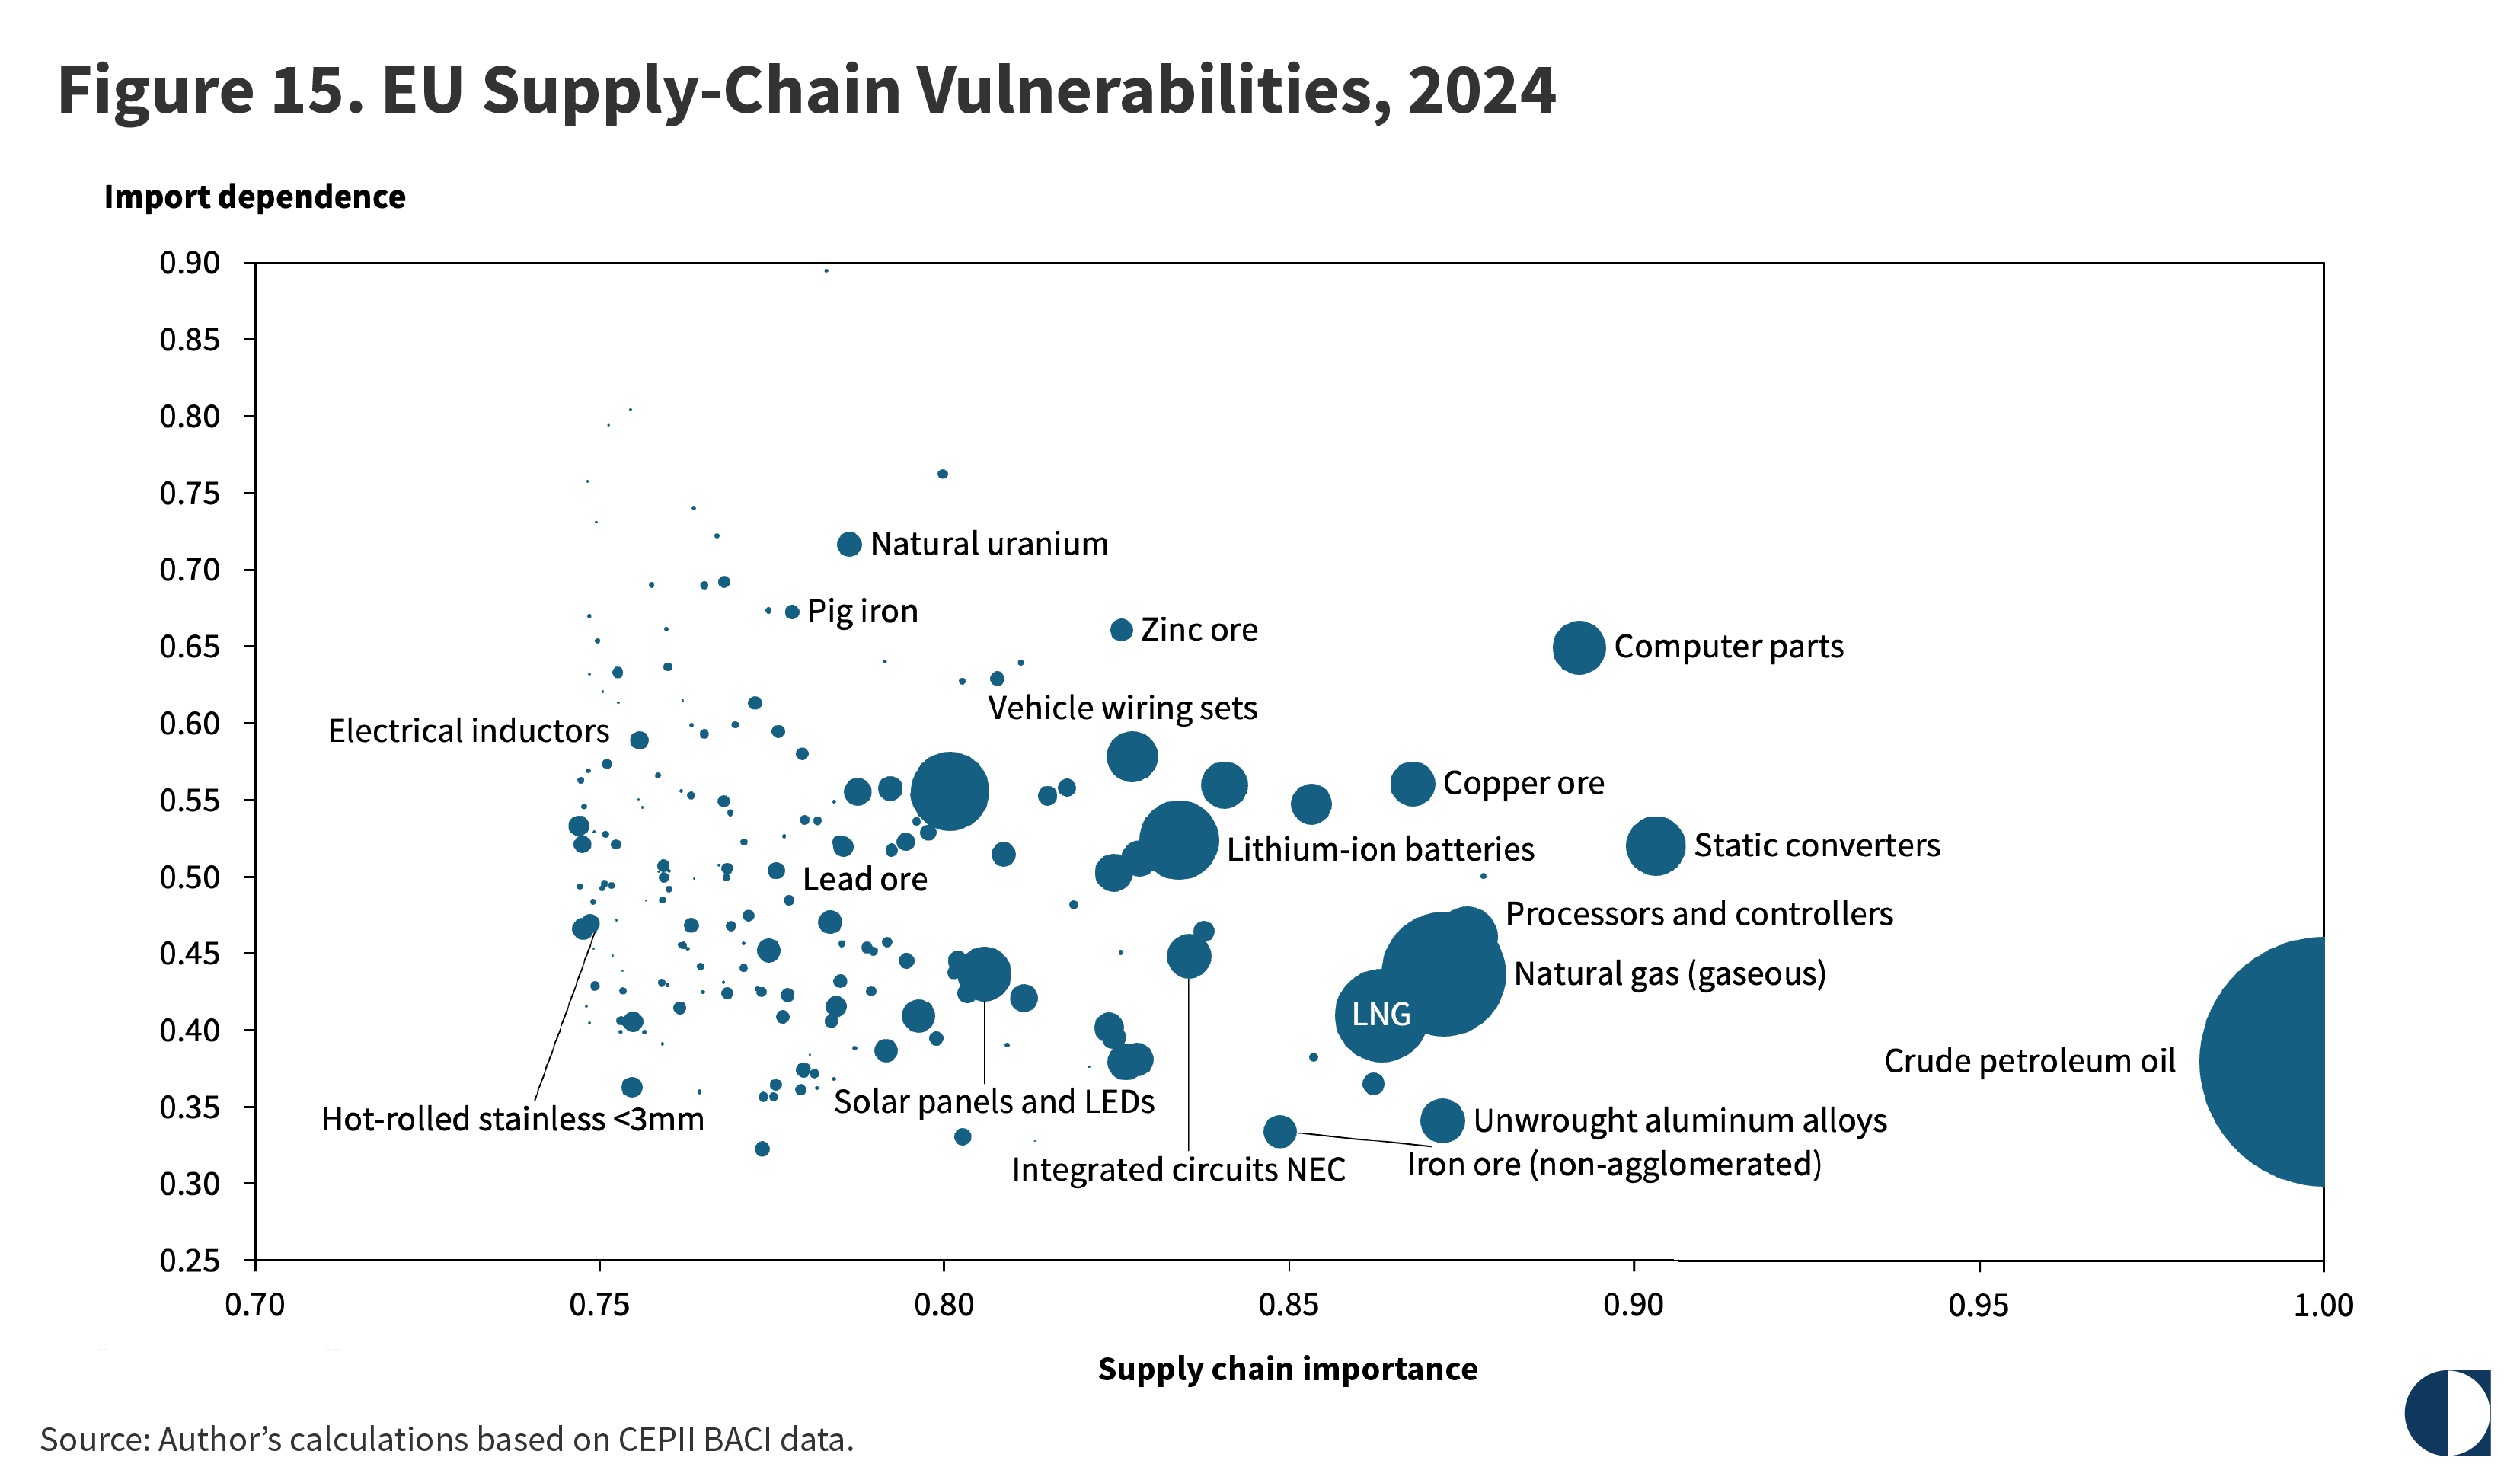
As may be expected, raw materials like crude oil and natural gas rank highly in terms of supply-chain importance. Intermediate goods that are critical for downstream industries, like computer parts, lithium-ion batteries, and integrated circuits, also score highly.
The overall degree of import concentration in the EU’s critical supply chains may also be a risk factor to be monitored. In 2024, five countries accounted for 16 percent of the EU’s total imports of critical supplies, rising sharply to 28.6 percent for the EU’s top ten import partners and 46.4 percent for the top twenty. By the time the thirty most important suppliers are included, cumulative concentration reaches 60.3 percent (see figure 16).
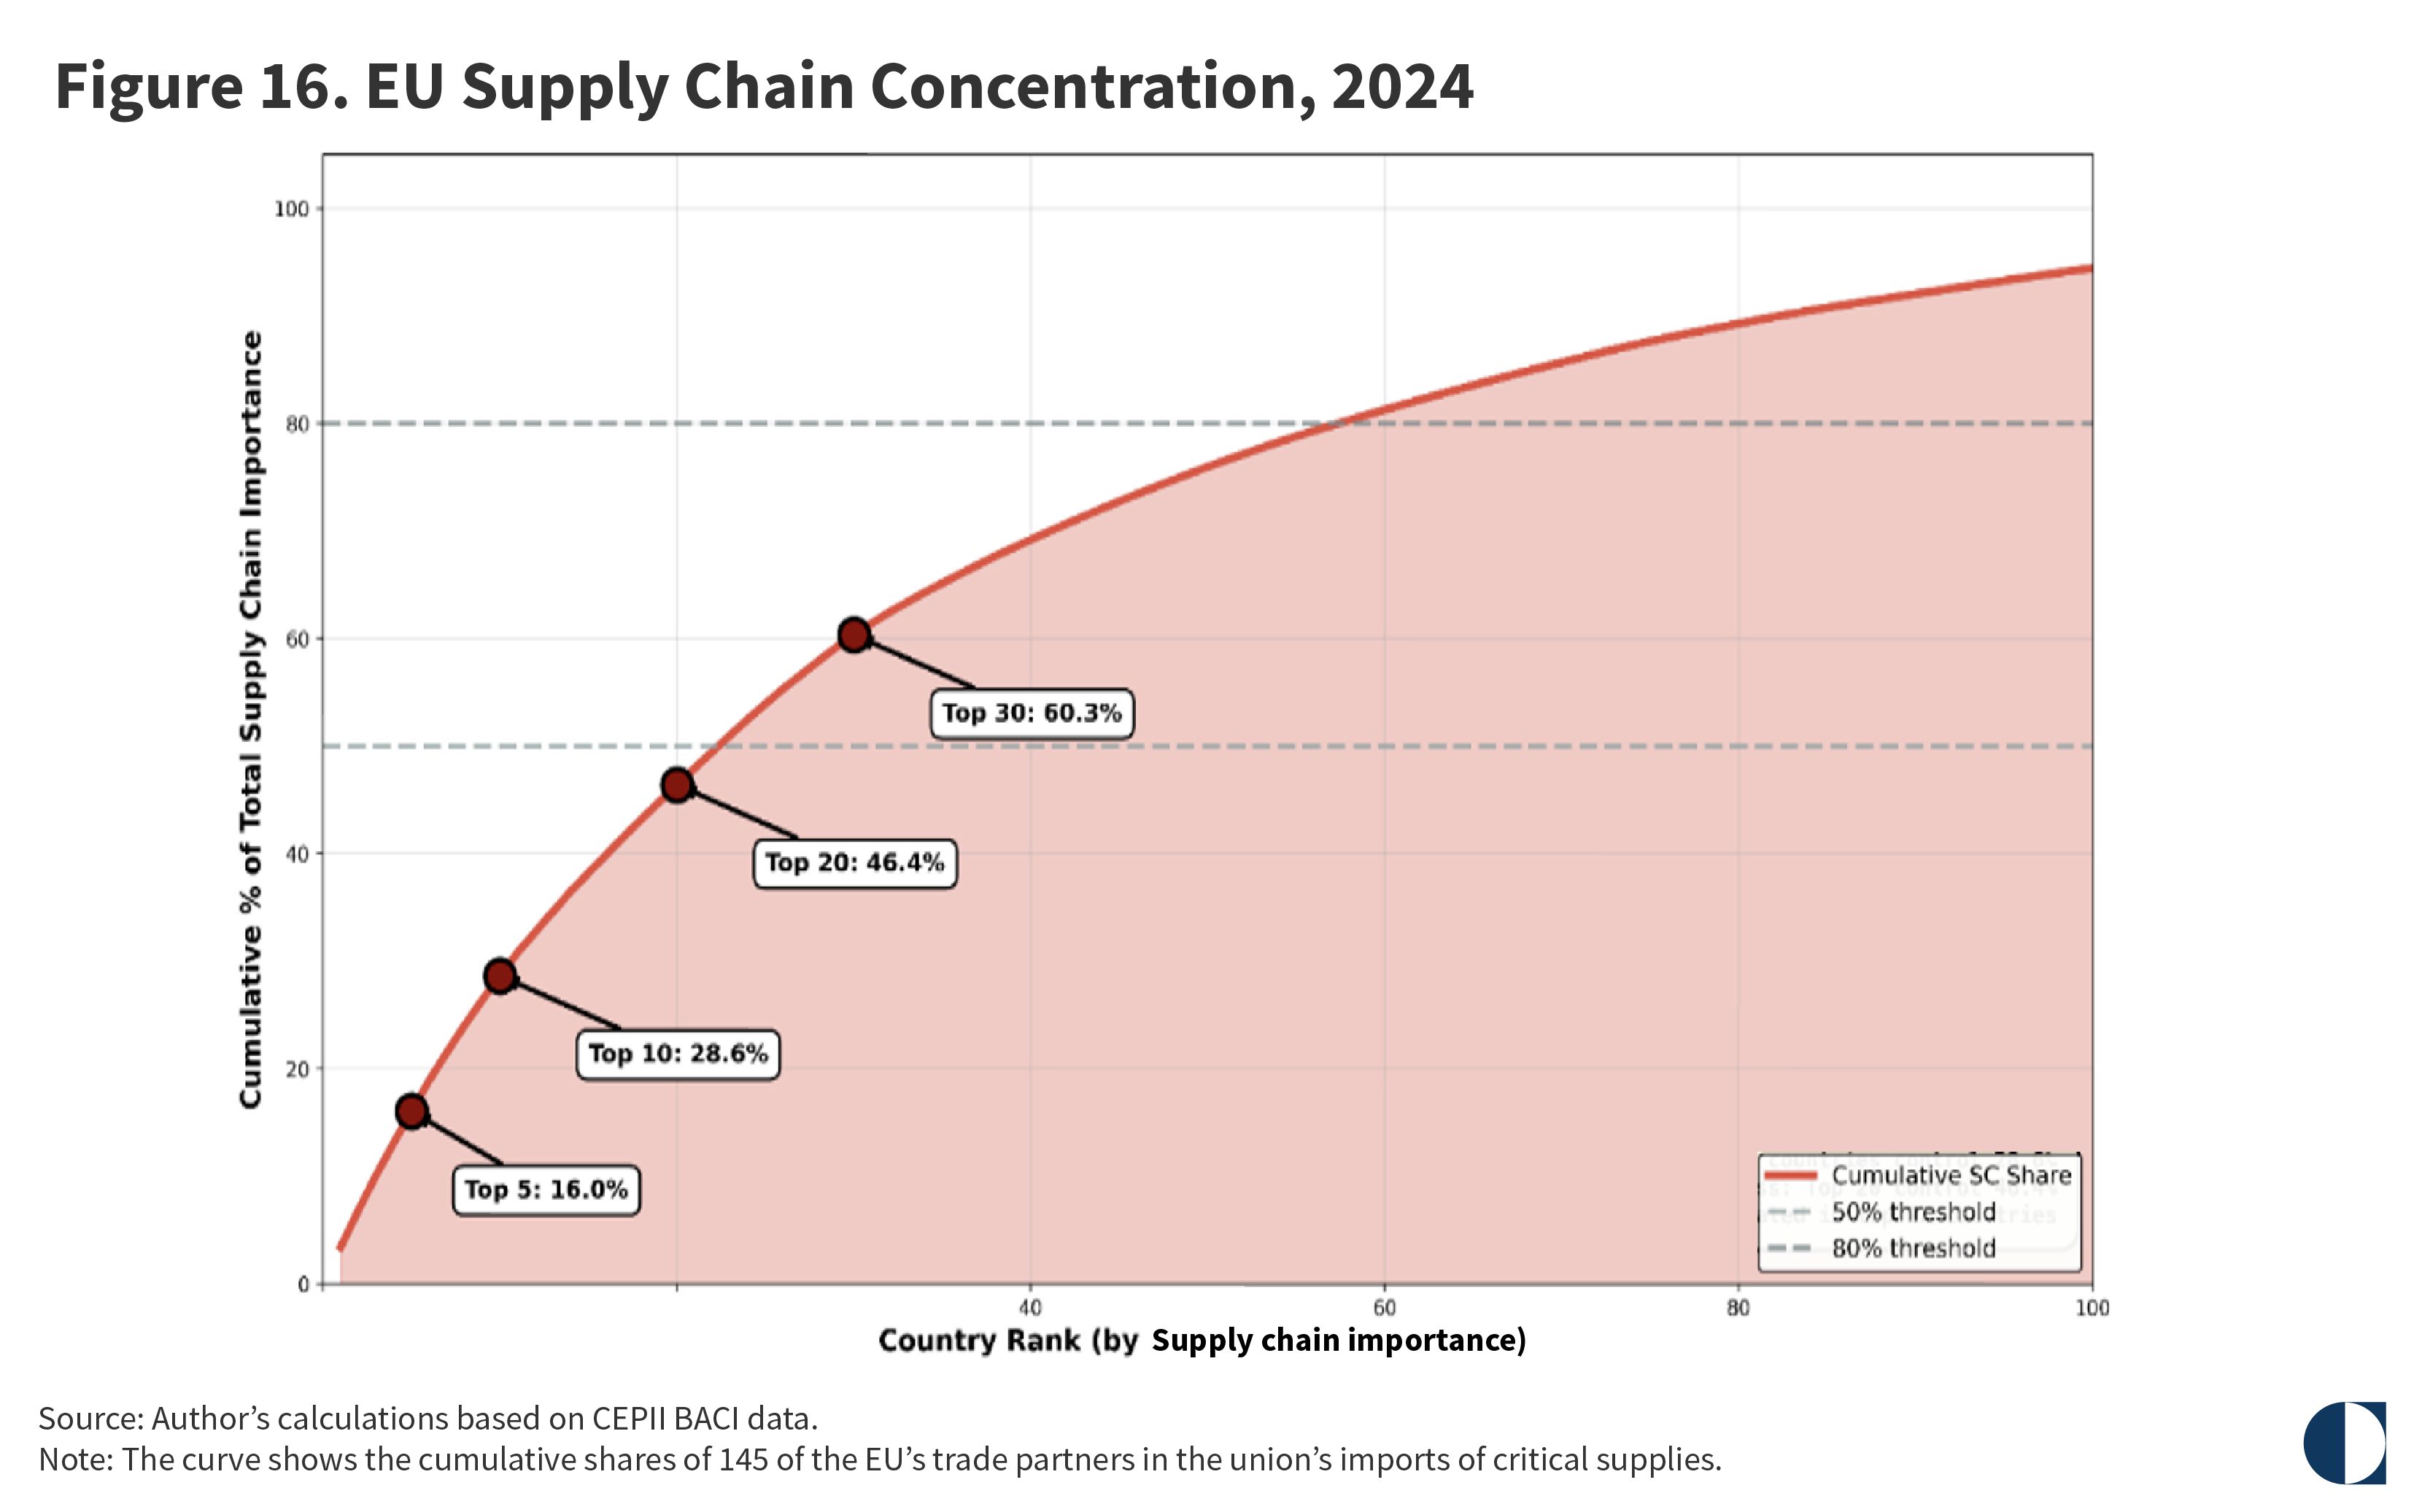
The shape of the curve is particularly instructive. The steep initial gradient indicates that a small number of countries have disproportionate influence over the EU’s supply-chain architecture. The 50 percent threshold—the point at which half of all supply-chain importance is captured—is crossed at between twenty and twenty-five countries, meaning that the EU’s supply-chain exposure is effectively concentrated in roughly one-sixth of its trading partners. The 80 percent threshold, meanwhile, is not reached until well beyond the top fifty countries, indicating a long tail of minor suppliers whose individual contributions are marginal but whose collective role provides a degree of diversification.
This is the central asymmetry in the EU’s supply position. The vulnerability arises not from a broad dependence across the full spectrum of imports but from concentrated exposure in a limited number of inputs of high systemic importance. In other words, the EU’s strategic problem is not the overall scale of its dependence but the fact that it is clustered in goods whose disruption would spread through multiple downstream sectors. What matters, therefore, is less the volume of trade involved than the structural role these goods play in the productive economy.
The next step is to combine the capability framework with a measure of intent. To put it another way, which countries are more likely to weaponize their supply relationships with the EU? To this end, states’ voting patterns in the UN General Assembly since 2020 are used as a proxy for their affinity with the EU. The degree of divergence between a country’s voting behavior and the EU’s voting history indicates the state’s geopolitical distance from the union. In the absence of a common EU vote, a simulation of this measure was calculated based on the individual voting patterns of the EU member states.
Combining the proxy for geopolitical affinity with the proxy for supply-chain importance produces four groups of EU trade partner: the strategic core, the diplomatic circle, the zone of dependence, and the zone of periphery (see figure 17).
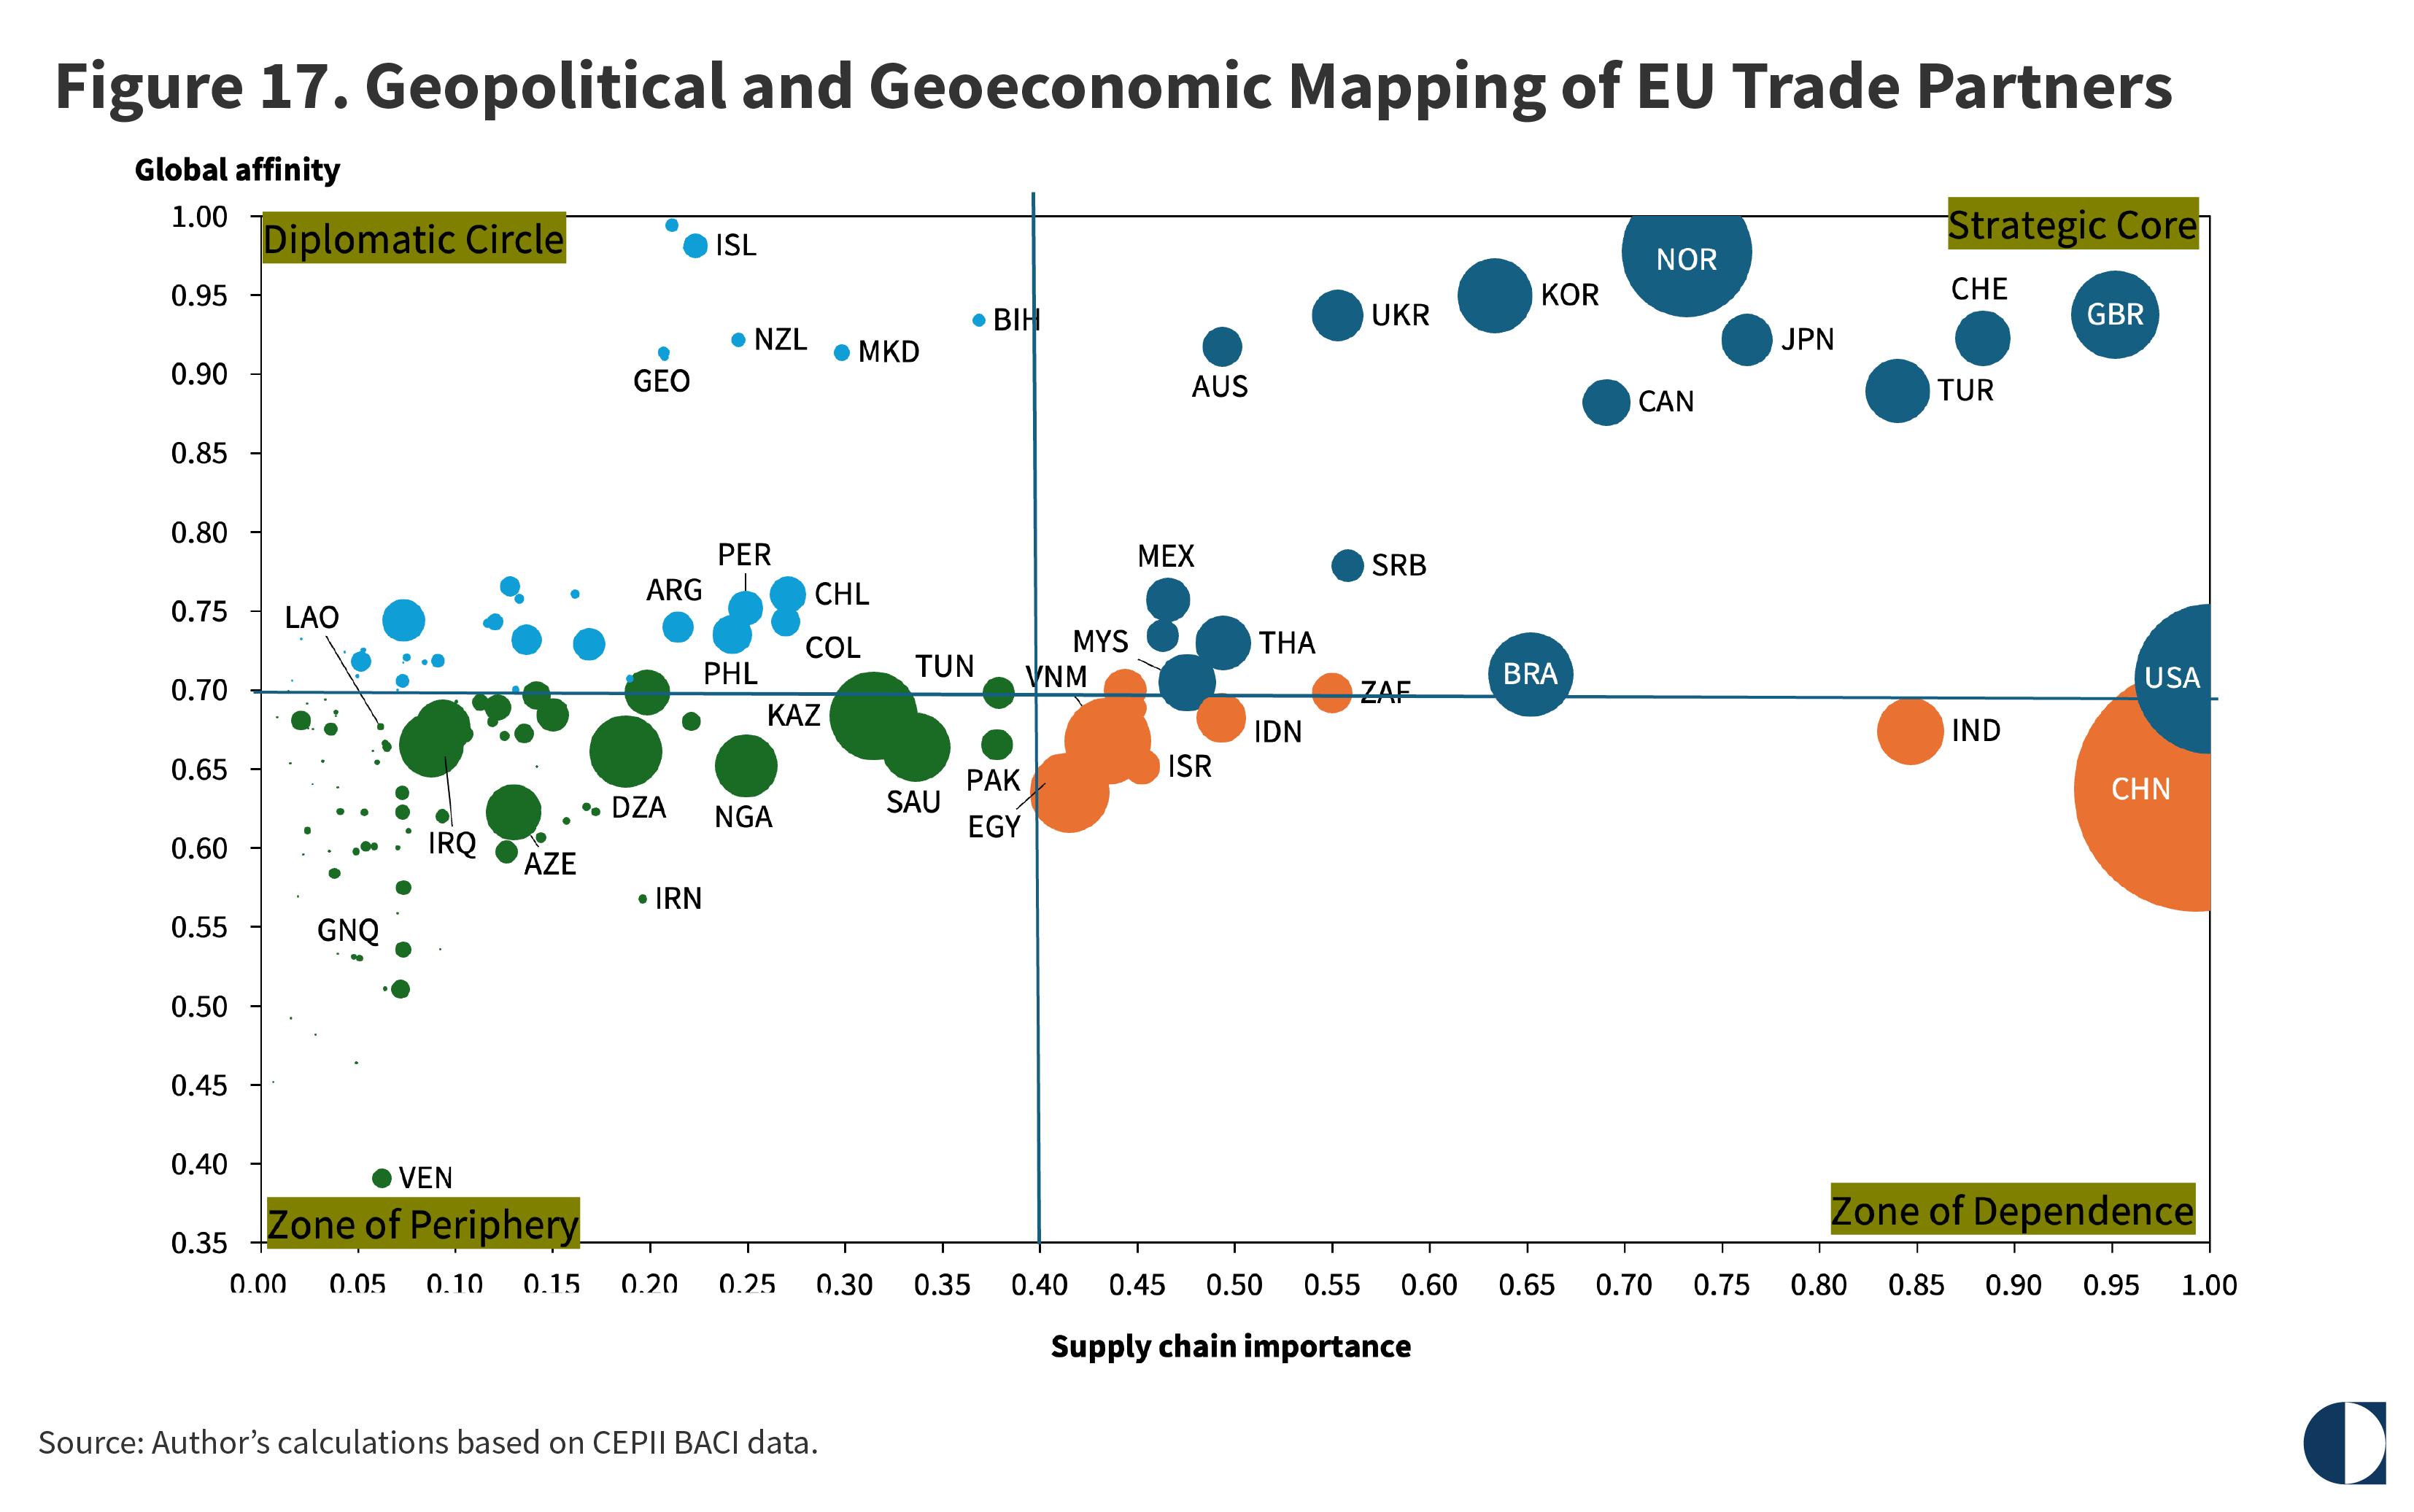
The strategic core includes eighteen countries with high importance for critical supply chains and a close geopolitical affinity with the EU (see table 2). This quadrant brings together the EU’s reliable and structurally capable trade partners, such as the United States, Norway, and the UK. Together, the countries in the strategic core accounted for €485 billion ($567 billion) of EU high-dependence imports in 2024. This figure corresponds to 39 percent of all critical supplies, with the United States alone accounting for 9.6 percent.
The zone of dependence includes ten countries—a small number compared with the other groups—with a significant degree of relevance for critical supply chains but a weak geopolitical affinity with the EU (see table 3). Among these states are China, Brazil, and India. The most dangerous supply dependencies are those at the intersection of high substitution difficulty, high forward-linkage intensity, and low political convergence, as represented by this category. And yet, together these countries accounted for €462 billion ($540 billion) of EU high-dependence imports in 2024. This equates to 37 percent of all critical supplies, with China alone making up 25 percent.
Meanwhile, the diplomatic circle includes thirty-four countries with a low degree of relevance for critical supply chains but a high geopolitical affinity with the EU (see table 4). These countries—among them, Iceland, Georgia, and Argentina—together represented €72 billion ($84 billion) of EU imports of high-dependence goods in 2024, or 5.8 percent of all critical supplies.
Finally, the zone of periphery includes eighty-two countries with low relevance for critical supply chains coupled with low geopolitical affinity with the EU (see table 5). In this quadrant are nations such as Qatar, Bangladesh, and Senegal. Together, the countries in this group accounted for €243 billion ($284 billion) of EU high-dependence imports in 2024, or 19.5 percent of total critical supplies.
This data-driven analysis has explored the overall geopolitical risk associated with the interdependencies created by the supply chains that serve the EU economy. The EU’s supply-chain risk is neither a product-level nor a country-level phenomenon. Rather, it stems from the interaction between product criticality, supplier concentration, and geopolitical alignment. The main conclusions point to a broadly robust situation that nonetheless reveals niche vulnerabilities.
In general terms, the EU is not particularly vulnerable. Of an estimated total import value of €2.45 trillion ($2.85 trillion) in 2024, 81 percent of imports were low risk. The union’s critical supply vulnerabilities, however, are highly concentrated in system-enabling inputs, such as energy products, electronics, advanced components, and critical minerals. In other words, the EU’s exposure is not extensive but structurally intensive.
In this context, the EU faces an energy-technology double bind: an increasing energy dependence on the United States alongside a technology dependence on China. The latter is not a particularly novel finding. By contrast, the United States is the EU’s most paradoxical partner. The country is the largest supply-chain anchor in the strategic core of EU trade partners, yet the political convergence between the two blocs is declining. The growing unpredictability of U.S. trade policy, intertwined with a visibly less transatlantic-friendly foreign policy, is transforming the EU’s primary security partner into one of its largest systemic supply-chain risk multipliers.
A second observation is that the EU’s most dangerous vulnerabilities are not today’s high-risk goods but emerging-risk products. The strategic challenge for the union does not lie primarily in goods that have already been identified as high risk, as these are visible and increasingly subject to mitigation policies. Rather, the more consequential exposure lies in emerging-risk imports, where suppliers are becoming more concentrated, substitution is becoming more difficult, and political risk remains latent. In a multipolar system, in which economic dependence often precedes geopolitical leverage, failure to respond during this phase of consolidation may allow manageable commercial ties to harden into future instruments of coercion. Strategic autonomy, therefore, depends not only on resilience in the face of present shocks but also on the foresight to guard against long-term structural lock-in.
Preventing this lock-in requires the EU to revitalize its trading arrangements with its key partners. The union’s January 2026 conclusion of an ambitious free-trade agreement with India, for instance, is an instrumental step toward securing the long-term cohesion of this partnership. By the same token, the lack of progress on modernizing the EU-Turkey Customs Union stands in stark contrast to these aspirations—especially since Turkey ranks as the sixth-most-critical trading partner from the standpoint of the EU’s economic security, in a list led by the United States, China, and the UK.
Ultimately, the EU does not face a generalized supply-chain crisis but rather concentrated geopolitical exposure embedded in a narrow set of system-enabling inputs. The interaction between substitution difficulty, forward-linkage intensity, and geopolitical alignment shows that vulnerability is a function not of trade volume alone but of structurally critical goods controlled by politically distant or strategically autonomous partners.
Because the union’s vulnerabilities are clustered in a narrow range of system-enabling goods, the policy response cannot be organized around a generalized reduction of external dependence. That would be both economically unrealistic and strategically imprecise. The real task is selective de-risking: identifying those inputs whose disruption would have cascading effects across the European economy and treating them differently from the wider universe of ordinary imports. This calls for a more discriminating policy mix—combining diversification, stockpiling, industrial support, and external economic diplomacy—focused not on the largest trade flows but on the points at which limited dependence translates into disproportionate strategic exposure.
In the emerging multipolar order, resilience is therefore not equivalent to self-sufficiency. It requires calibrated management of asymmetric interdependence: reducing exposure where criticality and divergence overlap while preserving and leveraging the EU’s upstream technological advantages. Strategic autonomy, in this sense, is neither decoupling nor alignment but disciplined governance of the power embedded in supply chains.

Senior Fellow, Carnegie Europe
Sinan Ülgen is a senior fellow at Carnegie Europe in Brussels, where his research focuses on Turkish foreign policy, transatlantic relations, international trade, economic security, and digital policy.
Recent Work

Alper Coşkun, Fatih Ceylan, Tacan İldem, …
Sinan Ülgen
Carnegie India does not take institutional positions on public policy issues; the views represented herein are those of the author(s) and do not necessarily reflect the views of Carnegie, its staff, or its trustees.

How is AI reshaping space security, creating governance challenges, and where does international diplomacy stand today?


Tejas Bharadwaj, Almudena Azcárate Ortega
After the chill in ties between 2020 and 2024 that brought India–China relations to their lowest point in several decades, the two countries have engaged each other afresh. This paper argues that there are predominantly four imperatives guiding India’s approach to China, and they exist in an order of priority.

Saheb Singh Chadha

This piece argues that India’s central challenge is not managing a single flashpoint but resolving the underlying tension between expansion and institutional coherency of the BRICS grouping.

Vrinda Sahai
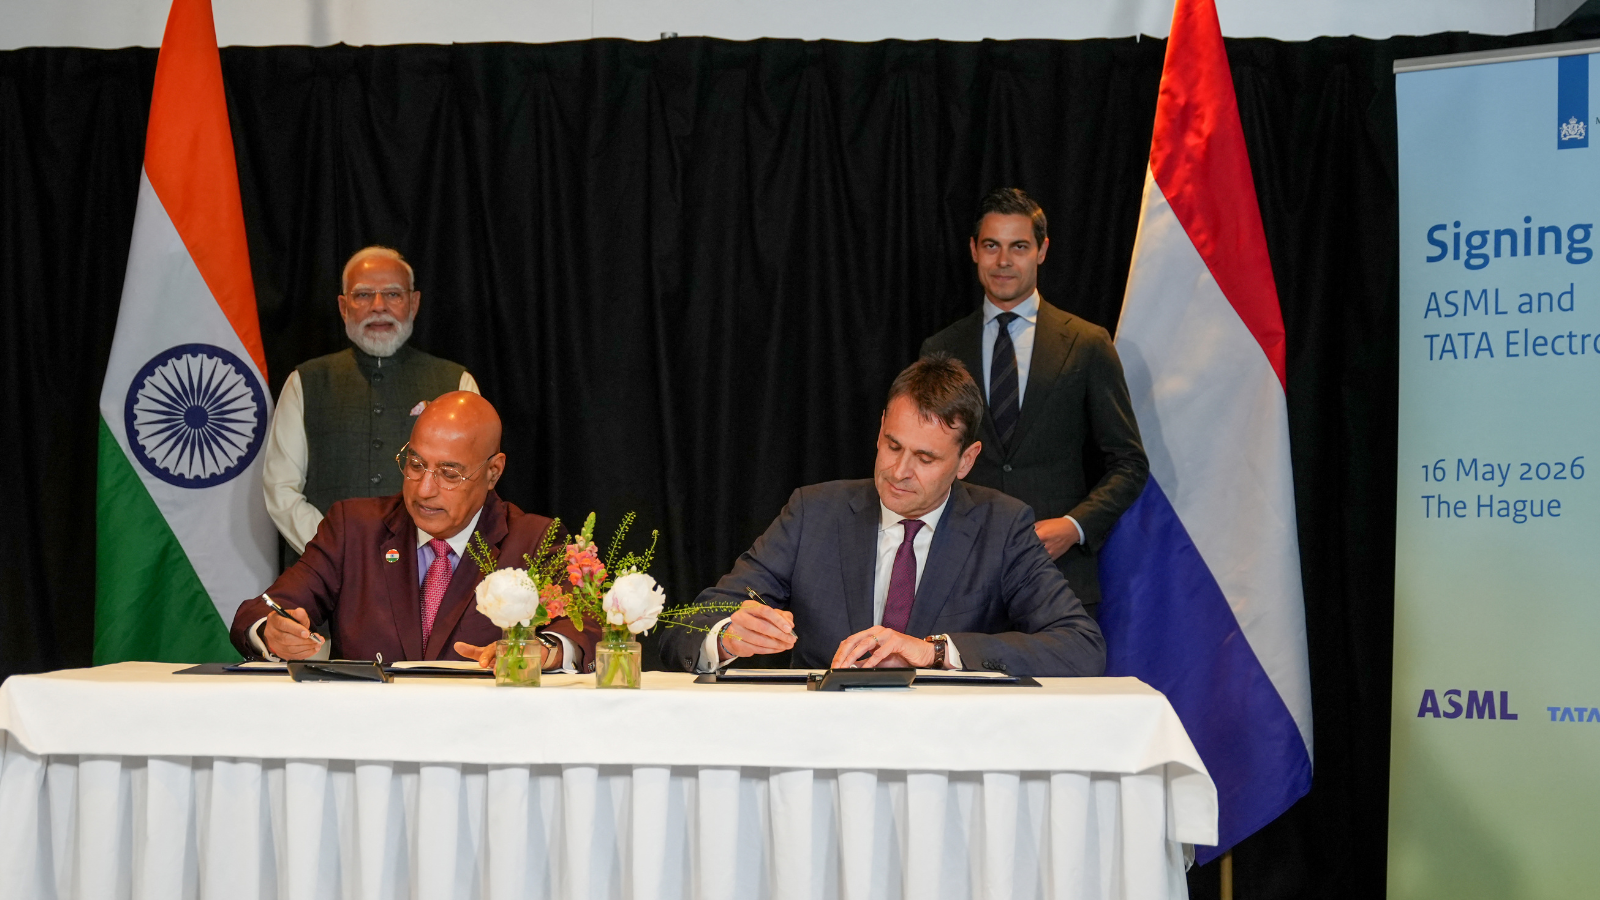
The ASML MoU with Tata Electronics is an indicator of how far the Indian semiconductor ecosystem has come. This ecosystem has been years in the making and represents real commercial logic.

Konark Bhandari

A partnership between India, a country of subcontinental size, and Africa, a continent of fifty-four countries, may seem asymmetric until one notes that both are home to nearly the same number of people—1.4 billion. This essay spells out the existing challenges to the partnership, its optimal potential, and the possible pathways to realize it over the next quarter-century.

Rajiv Bhatia