Even though Indian Americans comprise slightly more than 1 percent of the total U.S. population—and less than 1 percent of all registered voters—both major parties are leaving no stone unturned in reaching out to this community. Yet, despite the rising political profile of Indian Americans, their political attitudes are woefully under-studied.
Source: Getty
Indian Americans at the Ballot Box: Results From the 2024 Indian American Attitudes Survey
Ahead of the November U.S. election, a new Carnegie survey reveals the political preferences and issues animating Indian Americans, many of which challenge conventional electoral wisdom.
Summary
There are more than 5.2 million people of Indian origin residing in the United States today. Indian Americans are now the second-largest immigrant group in the United States and have emerged as an important political actor thanks to the community’s rapid demographic growth, the close margins in modern presidential elections, and the diaspora’s remarkable professional success.
In 2024, there is another reason Indian Americans have been thrust into the limelight: the possibility that for the first time in the nation’s history a candidate of Indian heritage, the Democratic nominee and incumbent vice president Kamala Harris, could occupy the highest office in the land.
Although Indian Americans have historically favored the Democratic Party in overwhelming numbers, the Republican Party has long felt that the community’s votes are up for grabs, touting the party’s policies on the economy, social issues, and stewardship of the U.S.-India bilateral relationship.
Despite the rising political profile of Indian Americans, their political attitudes have not been the subject of extensive empirical analysis. To remedy this, in 2020, the authors conducted the Indian American Attitudes Survey (IAAS), one of the first nationally representative surveys designed to analyze the political, social, and foreign policy attitudes of the Indian American community.
Four years later, a follow-up survey by the authors—in partnership with research and analytics firm YouGov—finds that, as the November 5 elections approach, Indian Americans remain solidly behind the Democratic Party, though there is a modest uptick in support for Republican candidate and former president Donald Trump. The analysis is based on a second round of the IAAS, a nationally representative online survey of 714 Indian American citizens that was conducted between September 18 and October 15, 2024. The survey has an overall margin of error of +/- 3.7 percent.
The data offer compelling evidence that Indian Americans continue to solidly favor the Democratic Party. However, one in three survey respondents intends to vote for Donald Trump. This modest drift toward Trump appears to be driven by Indian American men, particularly young men born in the United States.1 Overall, the diaspora views Harris and other Democratic politicians favorably while possessing more unfavorable views of leading Republicans. But the parties’ respective policy platforms, not personalities alone, shape the voting behavior of this increasingly influential demographic.
The findings in this study are briefly summarized below:
- Indian Americans remain committed to the Democratic Party, but their attachment has declined. Forty-seven percent of respondents identify as Democrats, down from 56 percent in 2020. The share of Republican identifiers has held steady while the percentage of independents has grown. However, when considering independents who lean toward one party, the decline in Democratic respondents is perfectly offset by a rise in Republican identifiers. Despite this shift, the share of respondents who self-identify on the ideological left has grown since 2020.
- Six in ten Indian American registered voters intend to vote for Harris. Sixty-one percent of registered Indian American voter respondents plan to vote for Harris while 32 percent intend to vote for Trump. There has been a modest shift in the community’s preferences, with a greater share of respondents willing to vote for Trump since the last election.
- There is a new, striking gender gap in voting preferences. Sixty-seven percent of Indian American women intend to vote for Harris while 53 percent of men, a significantly smaller share, say they plan to vote for Harris. Twenty-two percent of women intend to vote for Trump while a significantly larger share of men, 39 percent, plan to cast their ballots for him. When further disaggregated by age, this gender gap appears starkest with younger voters. In the cohort above the age of 40, more than 70 percent of women and 60 percent of men plan to vote for Harris. However, in the cohort under 40, 60 percent of women say they will vote for Harris, but men say they will vote for Harris and Trump in roughly equal proportions.
- Indian Americans hold lukewarm views toward prominent Indian American Republicans. Respondents rate Indian American Republicans such as Nikki Haley, Vivek Ramaswamy, and Usha Vance (the wife of Republican vice presidential nominee JD Vance) unfavorably. However, there is evidence of asymmetric polarization: Democrats rate prominent Republicans worse than Republicans assess leading Democrats.
- Abortion has emerged as a top-tier policy issue, especially for Democrats and women. Abortion and reproductive rights are a highly salient issue for Indian Americans this election year, ranking as their second-most-important policy concern (after inflation/prices and tied with the economy and jobs). Democrats and women are especially motivated by abortion this election cycle.
- The Republican disadvantage with Indian Americans is rooted in policy. Although Indian Americans hold a dim view of many prominent Republican leaders, the party’s disadvantage with Indian Americans goes beyond personalities. The data suggest that the Republican Party is out of sync with multiple policy positions held by members of the community. When Democrats are asked why they do not identify as Republicans, they cite the latter’s intolerance of minorities, its stance on abortion, and ties to Christian evangelicalism above all.
Introduction
As Election Day in the United States rapidly approaches, the race between former president Donald Trump and Vice President Kamala Harris appears to be extremely close. While national polls indicate a slim lead for Harris in the popular vote, the outcome will likely turn on tens of thousands of voters in a handful of key swing states. According to leading pollsters and polling aggregators, the race in these states is too close to call.
In this hotly contested race, one demographic whose political preferences are much discussed, though less studied, are Indian Americans. There are approximately 5.2 million people of Indian origin residing in the United States today, of which 3.9 million are eighteen or older. Based on 2022 data, the authors estimate that there are roughly 2.6 million eligible Indian American voters today.2 While the Indian diaspora comprises a small share of the overall electorate, several factors account for the heightened attention to this group in this election year.
For starters, the community is rapidly growing: Between 2010 and 2020, the Indian American community has grown by 50 percent, making it the second-largest immigrant community by country of origin, trailing only Mexican Americans. Of those born outside the United States, 70 percent entered the country after the year 2000.3 Furthermore, Indian Americans are what are called “high propensity” voters; data from the Indian American Attitudes Survey (IAAS) suggest that 96 percent of registered Indian American voters are likely to vote in this November’s elections.4
Second, the community’s elevated socioeconomic status has made it an attractive target for campaigns run by both parties; the median household income for Indian Americans is roughly $153,000, more than double the figure for the country as a whole. Simultaneously, a significantly higher share of Indian Americans, relative to other groups, holds higher education degrees. For these reasons, the community is being actively courted by political donors, activists, and parties from across the spectrum, both Democrat and Republican. Moreover, as the share of Indian Americans becoming U.S. citizens increases every year, these new voters are less likely to be guided by deeply entrenched partisan beliefs relative to those born in the United States. These factors imply that Indian Americans could potentially be swayed by both sides of the aisle.
Third, there is undoubtedly increased attention on the political views of Indian Americans this election year because Kamala Harris, whose mother was an Indian immigrant, is on the ballot. While Harris has long identified as an African American woman, she also acknowledges and embraces her Indian heritage. Harris’s identity in this election is worth underscoring because findings from academic research have demonstrated that, among Asian Americans, Indian Americans are especially inclined to mobilize behind candidates who share their ethnicity.
Last but not least, there is some evidence suggesting that Asian Americans may be gradually shifting their allegiance from the Democratic Party, their traditional home, toward the Republican Party. Compared to other racial groups, Asian Americans tend to have weaker attachments to political parties, and recent elections have seen an incremental shift in this group’s voting behavior in favor of the Republican Party, a trend observed among other non-White voters as well.
As evidence of this group’s potentially pivotal nature, both major party campaigns have actively wooed the Indian American diaspora’s votes ahead of the election. In a campaign television advertisement, Harris explicitly invokes her mother, an immigrant from the Indian state of Tamil Nadu, as “a brilliant, 5-foot tall, brown woman with an accent.” The Republican campaign has also turned the spotlight on the Indian American community, due to the Indian roots of Usha Vance, the wife of Trump’s vice presidential candidate JD Vance whose parents immigrated to the United States.
Despite the rising political profile of Indian Americans, their political attitudes are rarely analyzed closely, with most surveys collecting limited data on the diaspora as part of a broader examination of Asian Americans more generally.5 To remedy this, the authors conducted the 2024 IAAS with the goal of collecting new empirical data that can help characterize the political attitudes and preferences of Indian Americans. IAAS 2024 is a nationally representative survey of 714 Indian American citizens conducted between September 18 and October 15, 2024, in partnership with YouGov. The survey was conducted online using YouGov’s proprietary panel of U.S.-based participants and has an overall margin of error of +/- 3.7 percent.
Findings from this survey build on the IAAS 2020, a similar survey fielded by the authors on the eve of the 2020 presidential election. Both the 2020 and 2024 iterations are cross-sectional surveys of the Indian American population, each with its own margin of error. The IAAS is not a panel dataset that interviews the same respondents over time. Therefore, one must exercise caution in interpreting changes between the two surveys.
This study addresses five questions regarding Indian American voter behavior:
- How can we characterize Indian Americans’ political and ideological affiliations?
- How are Indian Americans likely to vote in the 2024 presidential election? And how does their vote vary according to key demographic characteristics?
- How is Kamala Harris’s presence on the ballot impacting political attitudes and voter enthusiasm?
- How do Indian Americans evaluate prominent political leaders, especially fellow Indian American politicians?
- What policy issues are animating the Indian American community this election year?
This is the first in a series of empirical analyses of Indians residing in the United States drawing on IAAS 2024 data. Subsequent articles will examine the attitudes of Indian Americans toward India and the community’s social attitudes.
Survey Overview
The data for this study are based on an original online survey—the 2024 Indian American Attitudes Survey—of 714 Indian American U.S. citizens. The survey was conducted by polling firm YouGov between September 18 and October 15, 2024. While the larger IAAS sample contains both U.S. citizen and noncitizen respondents, this study focuses on the subset of U.S. citizens since its primary objective is to shed light on political activities relevant to the 2024 presidential election.
YouGov recruited respondents from its proprietary panel comprised of 500,000 active U.S.-based residents. For the IAAS, only adult respondents (ages eighteen and above) who identify as Indian American or a person of (Asian) Indian origin were able to participate in the survey. YouGov employs a sophisticated sample matching procedure to ensure that the respondent pool is representative of the Indian American community in the United States. All the analyses in this study employ sampling weights to ensure representativeness.6
The overall maximum margin of error for the U.S. citizen subsample in the IAAS analyzed here is +/- 3.7 percent. This margin of error is calculated at the 95 percent confidence interval. Further methodological details can be found in appendix A, along with a state-wise map of survey respondents.
The survey instrument contains over one hundred questions organized across five modules: basic demographics; U.S. politics and voting behavior; foreign policy and U.S.-India relations; culture and social behavior; and Indian politics. Respondents were allowed to skip questions except for certain demographic questions that determined the flow of other survey items.
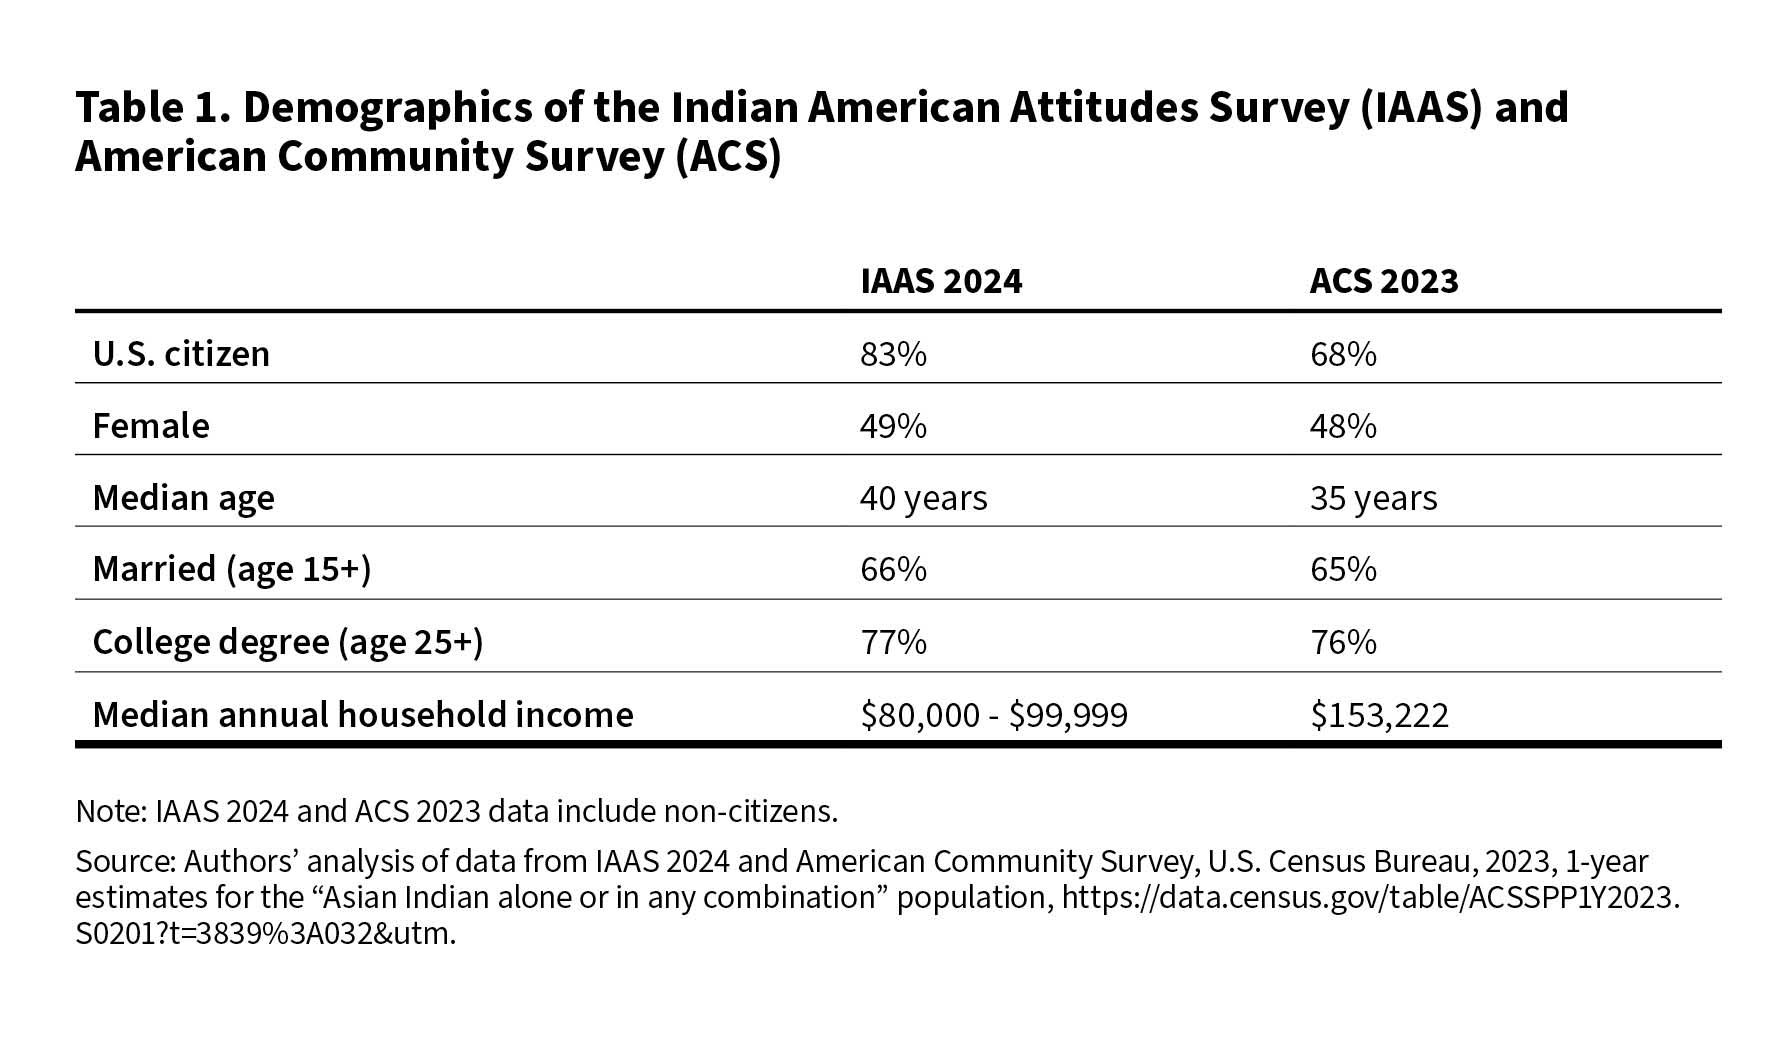
Table 1 provides a demographic profile of the IAAS sample in comparison to the Indian American population as a whole. The latter relies on data from the 2023 American Community Survey (ACS) on the Asian Indian population in the United States.7 The ACS is an annual demographic survey conducted by the U.S. Census Bureau and is widely used to construct sample survey frames in the United States.
Party Identification and Political Ideology
In line with prior studies of Indian American voting behavior, the IAAS 2024 finds that Indian Americans continue to strongly identify with the Democratic Party (see figure 1).
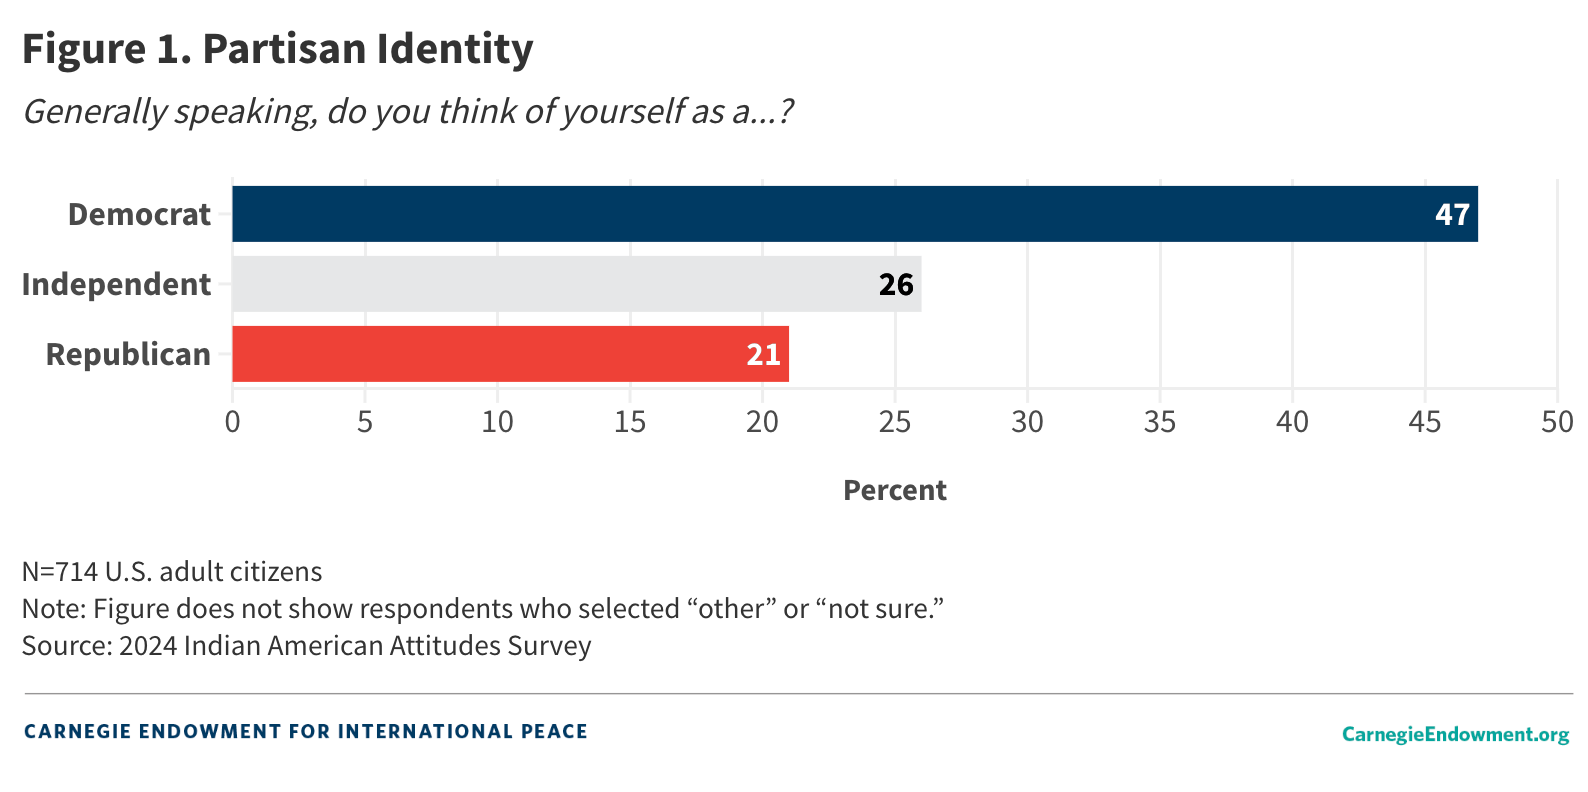
When asked with which party they identify, 47 percent of Indian Americans report that they consider themselves Democrats, 21 percent consider themselves Republicans, and another 26 percent identify as independents. Compared to findings from the 2020 IAAS, there has been a modest decline in the share of respondents who identify as Democrats. Four years ago, 56 percent of respondents identified as Democrats, 22 percent as Republicans, and 15 percent as independents.8 Over four years, while the Republican share hardly changed, the share of Democrats declined while the proportion of independents rose.
After inquiring about respondents’ party identification, the survey asked how strongly respondents identify with their chosen party (and asked independents whether they lean toward either major party). This measure of party identification attempts to address the fact that many respondents who declare themselves independents do in fact lean in the direction of one party (see figure 2).
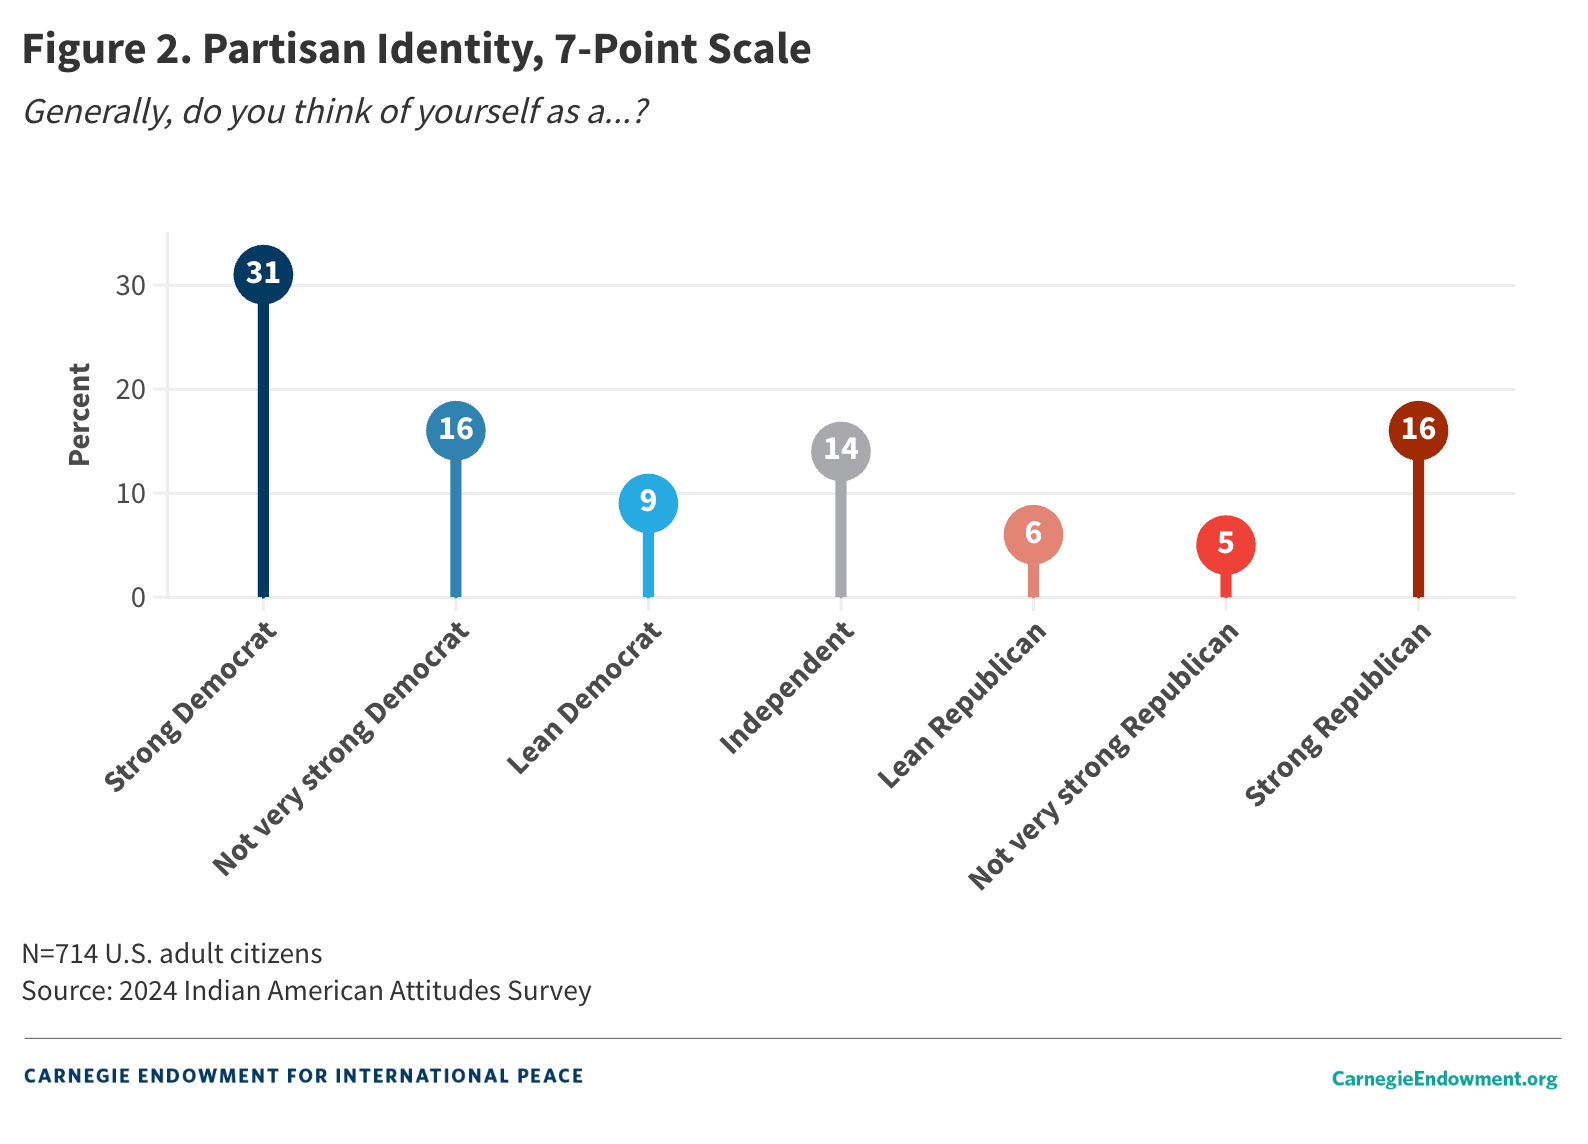
Thirty-one percent of respondents identify as strong Democrats, 16 percent identify as not very strong Democrats, and another 9 percent lean toward the Democratic Party. On the other side, 16 percent of respondents identify as strong Republicans while another 5 percent are not very strong Republicans and 6 percent lean Republican. All told, 57 percent of respondents tend toward the Democratic Party while 27 percent tend toward the Republican Party. Fourteen percent of respondents are “true” independents who do not lean toward either party, while 3 percent are unsure of where they stand. Using this measure of party identification, compared to the 2020 IAAS, the share of Democrats declined from 66 to 57 percent, while the share of Republicans grew from 18 to 27 percent. The share of true independents and those unsure remains largely unchanged.
In terms of political ideology, the 2024 IAAS shows that Indian Americans clearly skew left of center. Respondents are asked to place themselves on a standard seven-point ideological scale taken from the American National Election Studies, which ranges from extremely liberal to extremely conservative. As with the previous question on partisanship, there is a tendency among some survey respondents to select the centrist position (identifying themselves as “moderate”). To account for this, respondents who select this option (or who say they have not thought much about this issue) are asked whether, if compelled to choose, they would consider themselves to be liberal or conservative. For the purposes of this study, responses from these two questions were combined to place respondents on a single ideological spectrum (see figure 3).
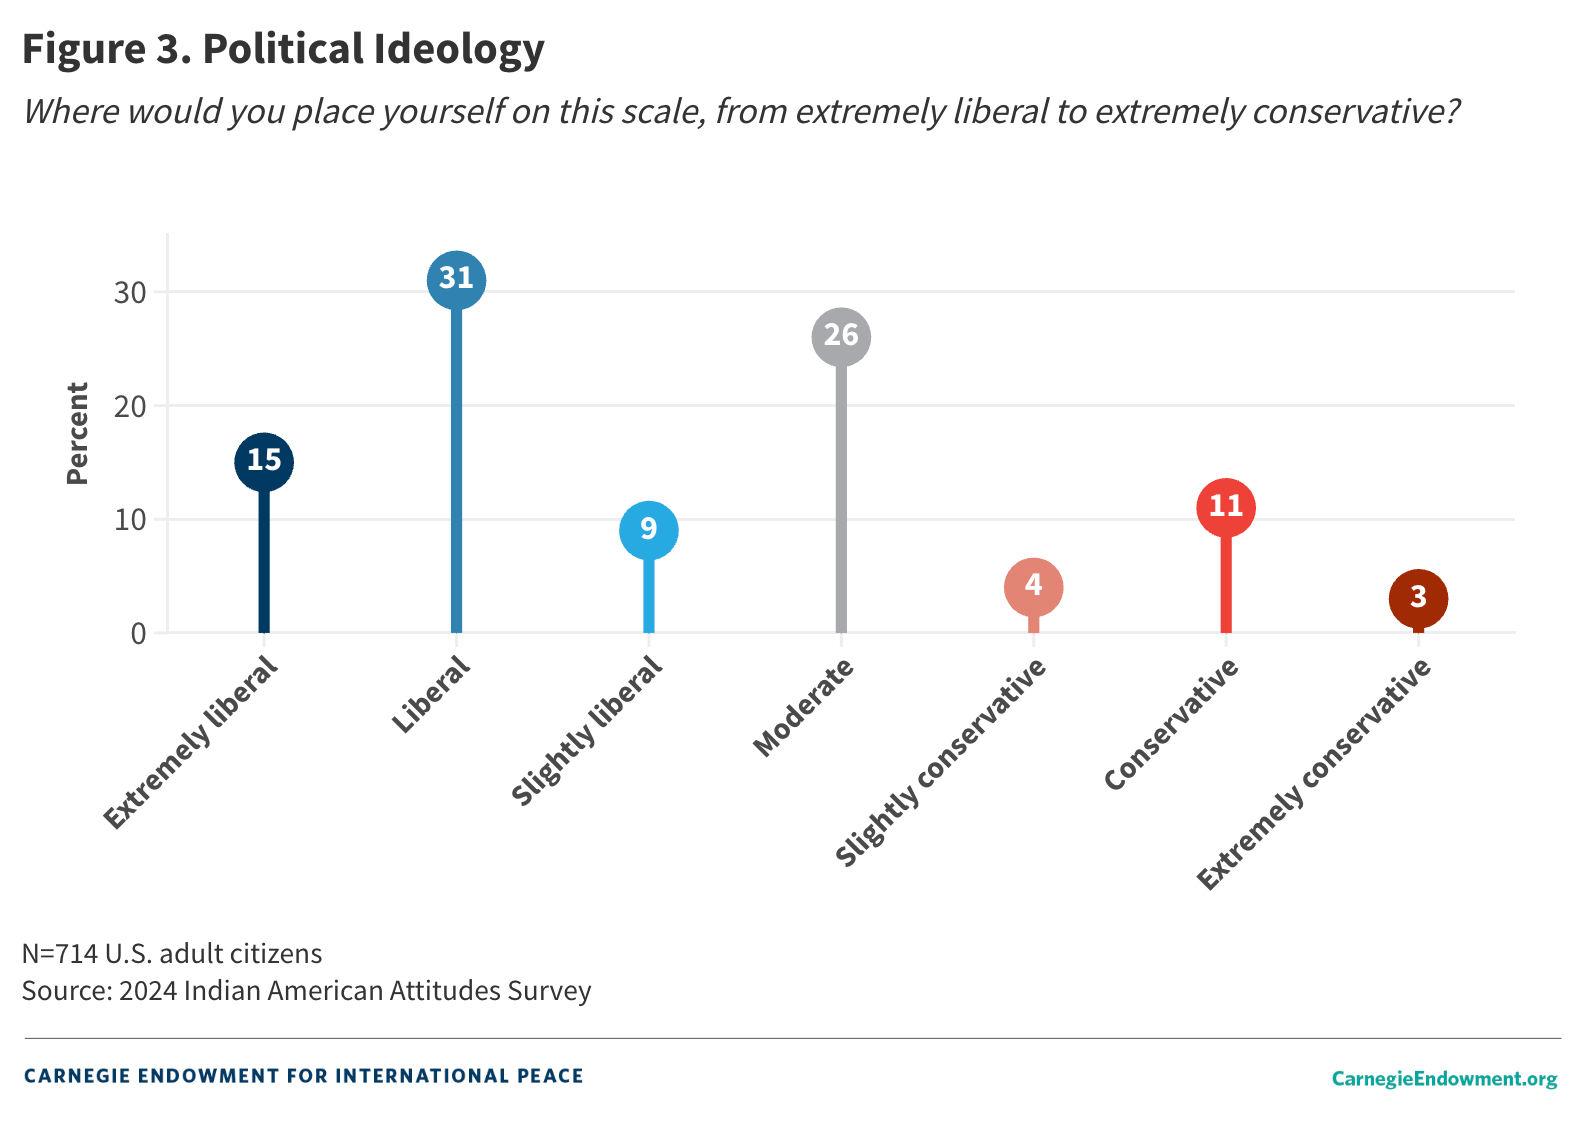
A plurality of Indian American respondents (55 percent) place themselves on the left side of the ideological spectrum: 15 percent identify as extremely liberal, 31 percent identify as liberal, and 9 percent identify as slightly liberal. In comparison, a much smaller percent of respondents (18 percent) place themselves on the right end of the ideological spectrum: 3 percent identify as extremely conservative, 11 percent identify as conservative, and an additional 4 percent identify as slightly conservative. In all, 26 percent of Indian American citizens self-identify as moderate, even after a follow-up question asked which side they would lean toward.
Interestingly, while the numbers on party identification show a modest shift away from the Democrats, the ideology data show a slightly leftward shift among Indian Americans. In the 2020 IAAS, 47 percent of respondents identified as liberal, 23 percent as conservative, and 29 percent as moderate. This seeming contradiction could reflect a dissatisfaction with the Democratic Party, its nominee, and/or the Trump-led Republican Party’s populist shift away from Reaganite conservativism.
Voting Behavior
This section explores Indian American voting behavior ahead of the November presidential election, followed by a look at their reported voting preferences for House of Representatives and Senate elections.
Presidential Election
A nationwide survey of Asian Americans that polled respondents in April and May demonstrated that the Democrats’ traditional advantage with Asian American voters was fading. This decline was visible across all national origin groups except for Vietnamese Americans. Notably, the drop in support for President Joe Biden in that survey was greatest among Indian Americans: Whereas 65 percent of registered Indian American voters reported supporting Biden in 2020, that share plummeted to 46 percent in July 2024.
Of course, Biden withdrew from the presidential race in July 2024, and Harris became the Democratic Party’s presidential nominee. More recent surveys on Asian Americans, including the September 2024 AAPI Voter Survey conducted by Asian & Pacific Islander American Vote and AAPI Data, suggest that Harris has recovered the Democrats’ lost ground since becoming the nominee.
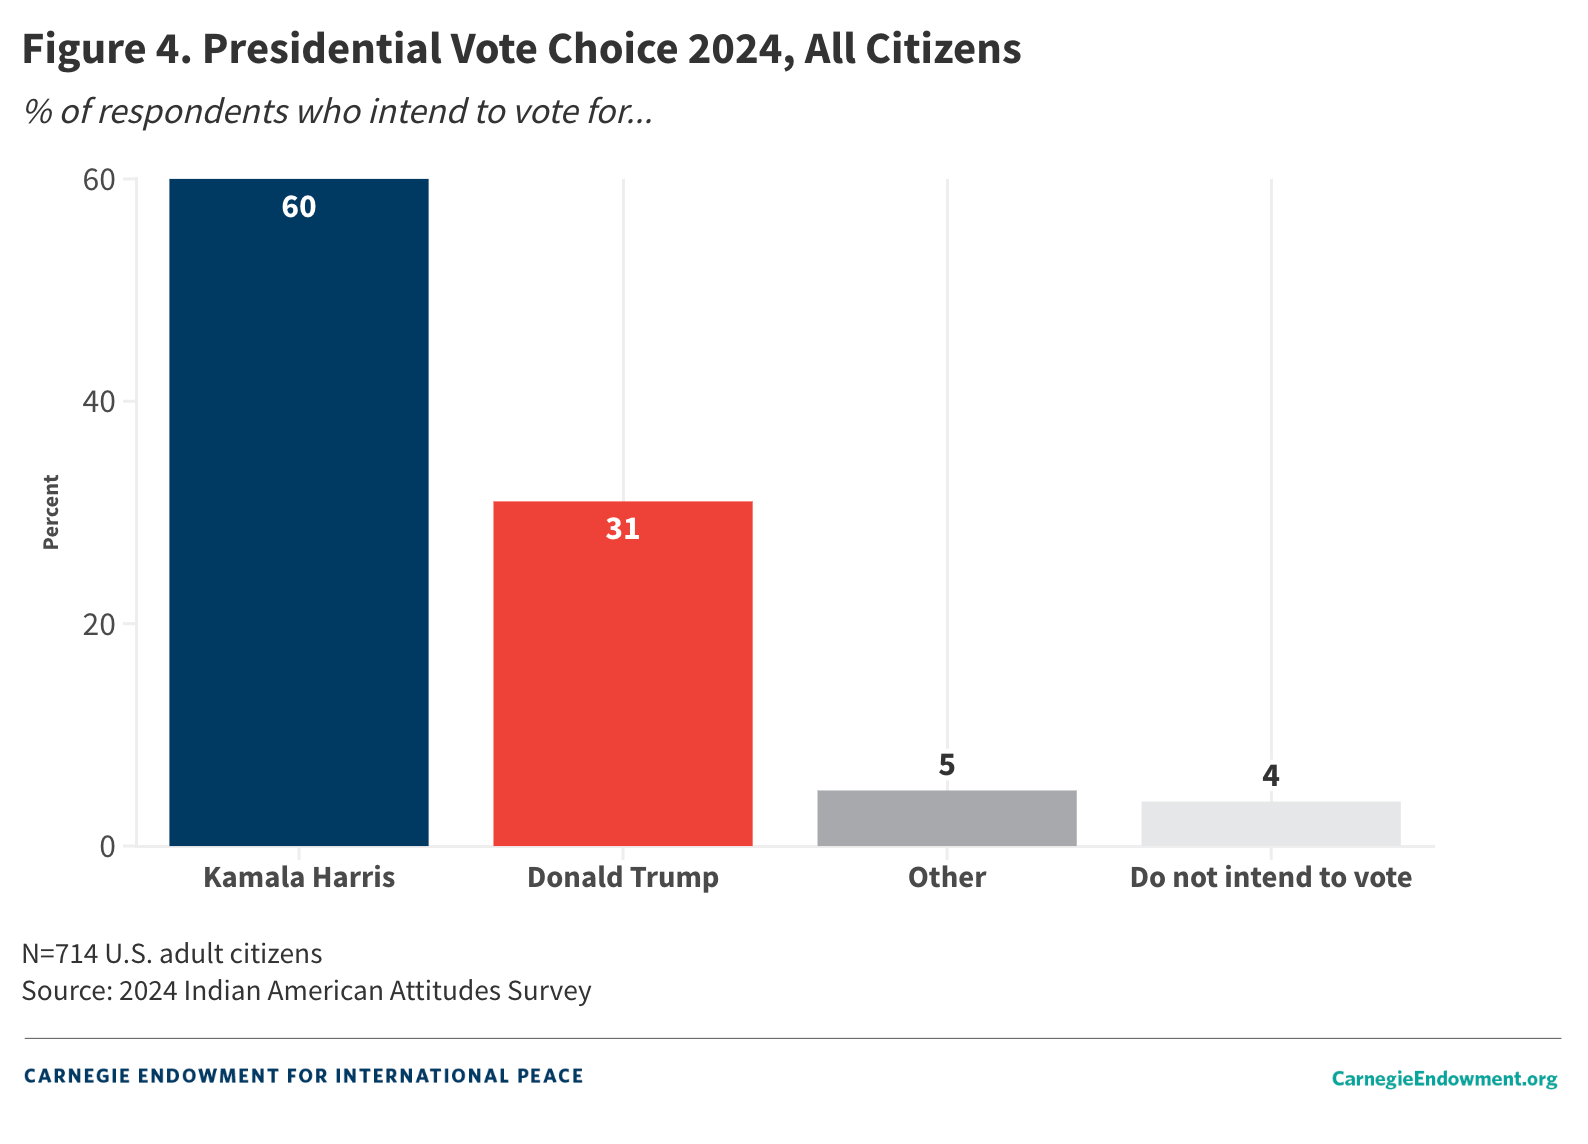
According to the current 2024 IAAS survey, 60 percent of Indian American citizens plan to vote for Harris compared to 31 percent for Trump (see figure 4). Five percent plan to vote for a third-party candidate, while 4 percent do not intend to vote at all in the election.
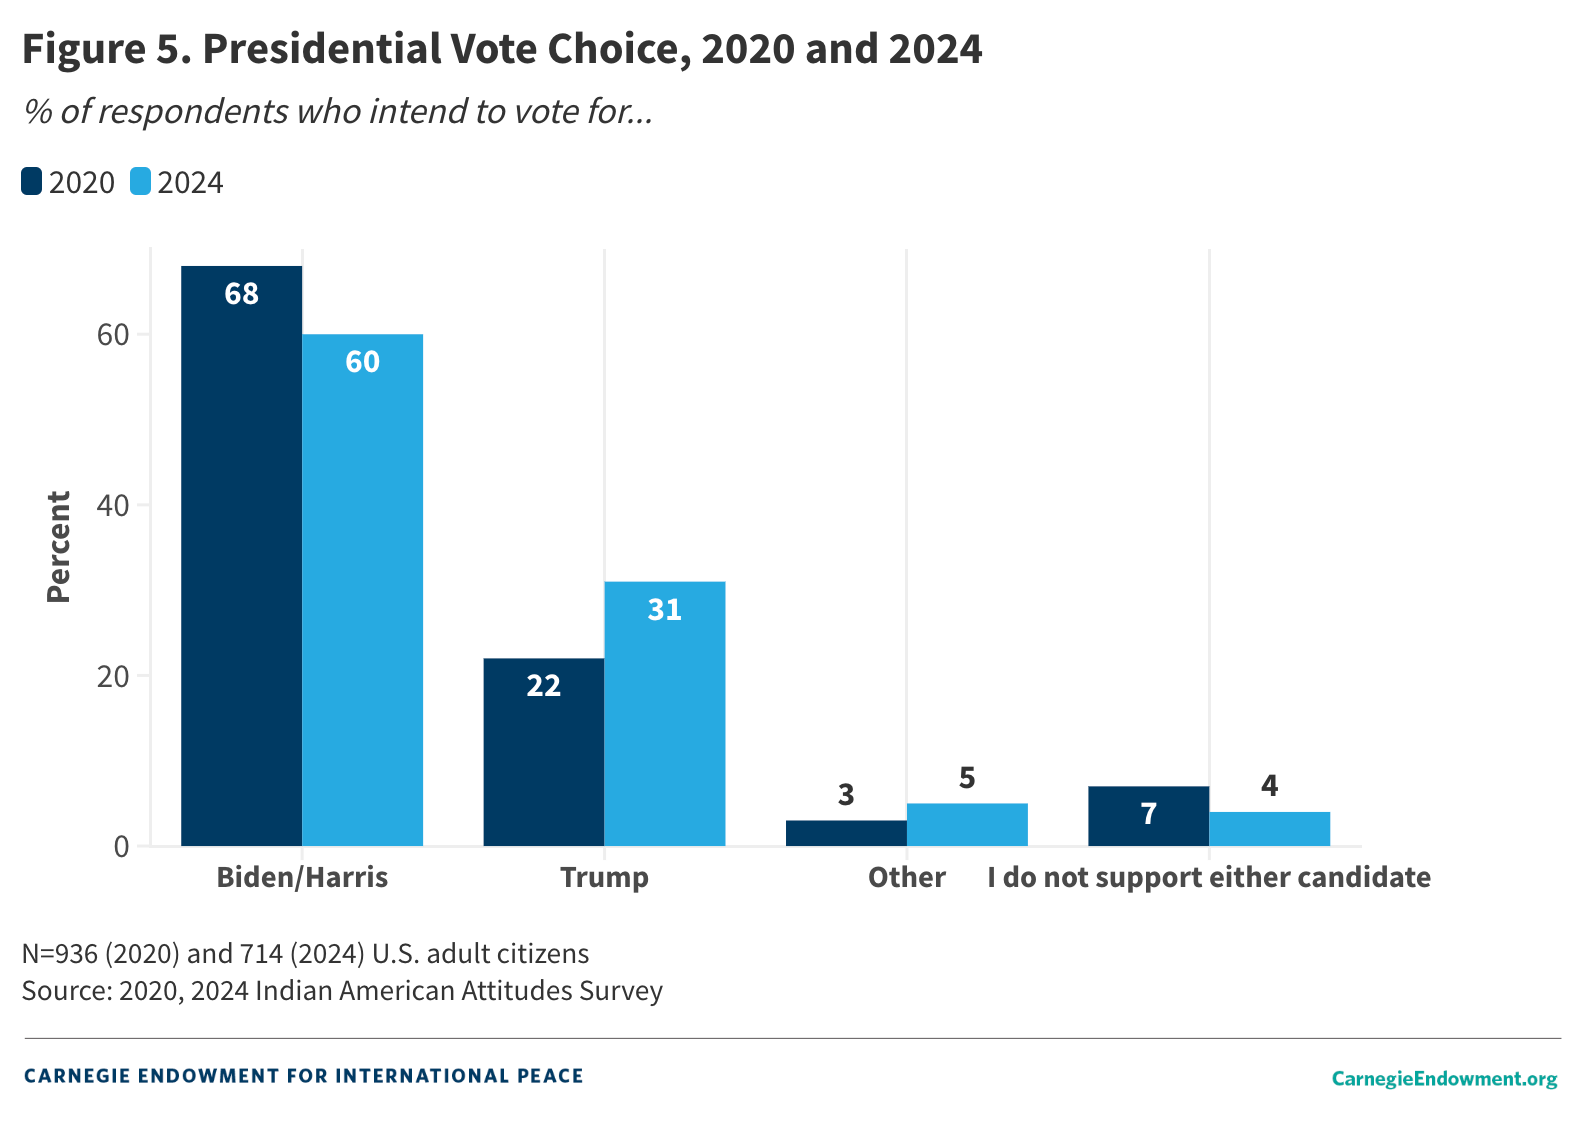
How do these results contrast with Indian American voting behavior in the 2020 election (see figure 5)? In the 2020 IAAS survey, 68 percent of Indian respondents reported they intended to vote for Democratic nominee Joe Biden while 22 percent indicated that they would vote for Republican incumbent Donald Trump. An additional 3 percent planned to vote for another candidate while 7 percent of respondents did not intend to cast their ballots for president.
In line with the figures on partisanship, the data suggest a small shift toward the Republican Party among Indian Americans. However, as noted earlier, the data come from repeated cross-sections, rather than a panel of respondents, so conclusions based on direct comparisons to the IAAS 2020 should be treated with care. While it is possible that the differences between 2020 and 2024 reflect true changes in the Indian American population, it is also possible that they reflect the influence of survey and sampling error, as the exact same respondents were not interviewed over time.
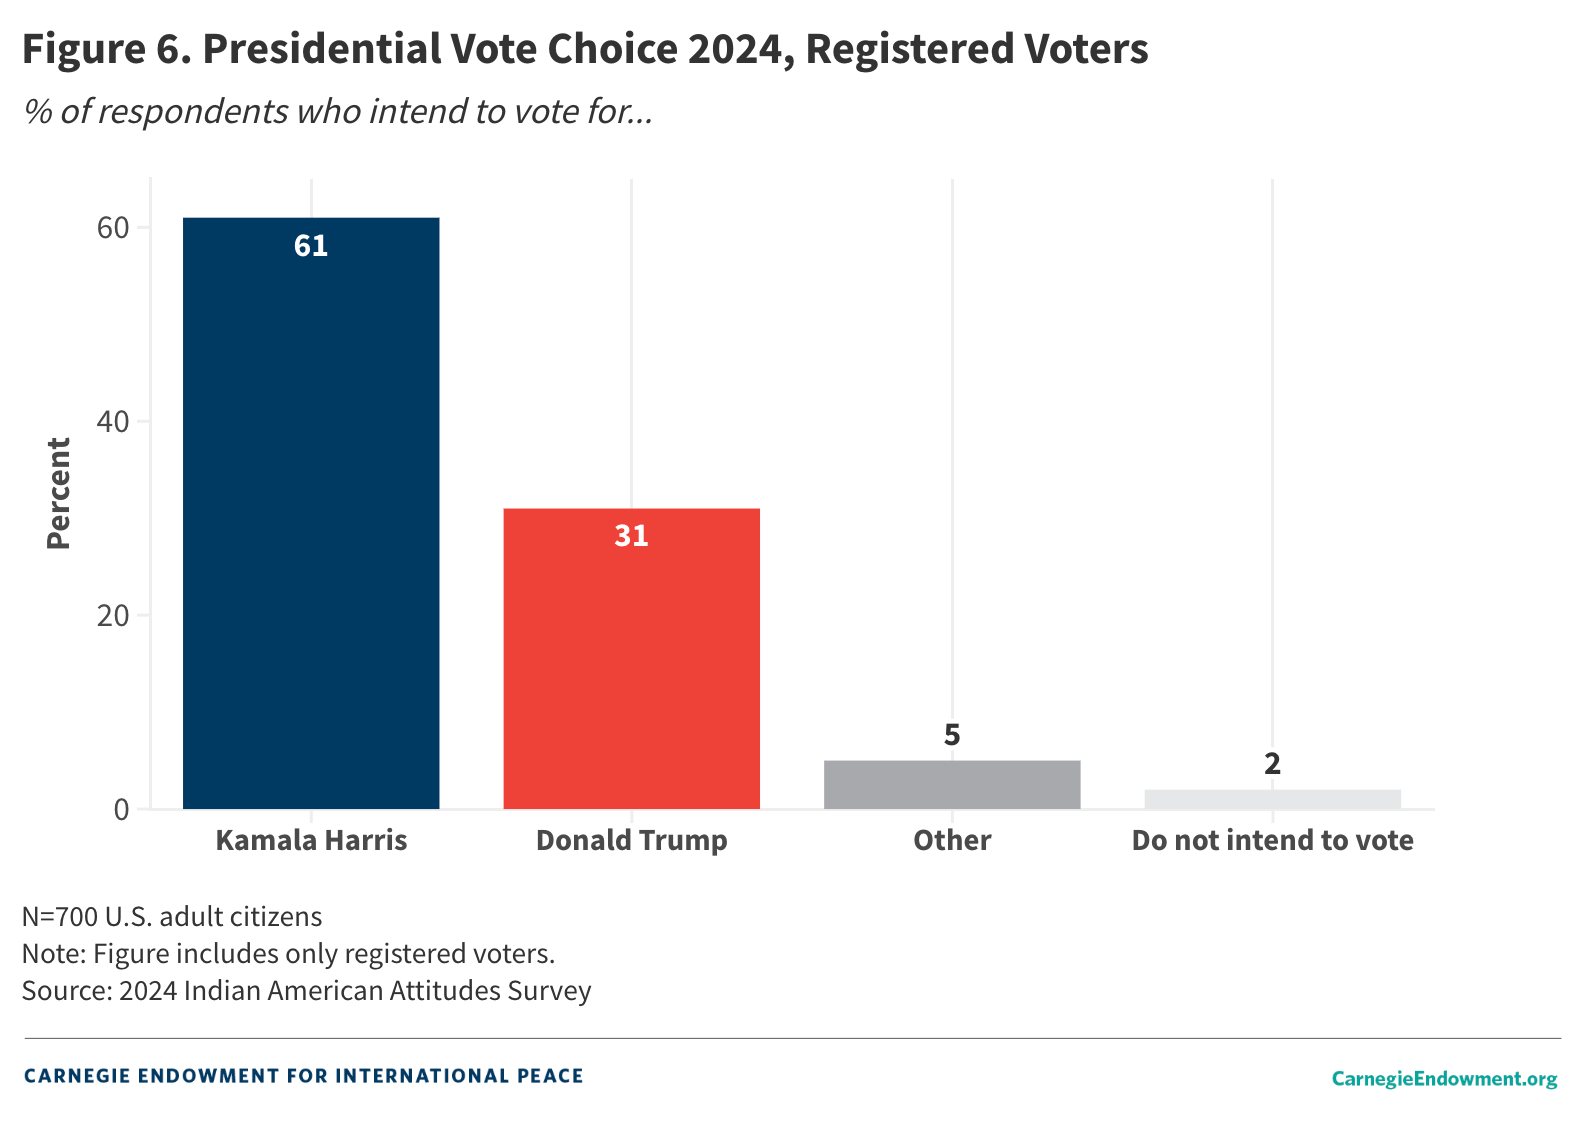
When one restricts the analysis to Indian American registered voters (N=700), 61 percent plan to vote for Harris in 2024, 31 percent intend to vote for Trump, 5 percent will support a third-party candidate, and 2 percent do not intend to vote at all (see figure 6). Four years ago, 72 percent of registered voter respondents reported their intention of voting for Biden, with just 22 percent planning to vote for Trump.9
How do Indian American voting patterns compare with those of other racial/ethnic groups in the country? Since the IAAS only surveys Indian American respondents, it cannot directly answer this question. However, one can compare the IAAS top-line findings with those from recent surveys fielded around the same time (see table 2).
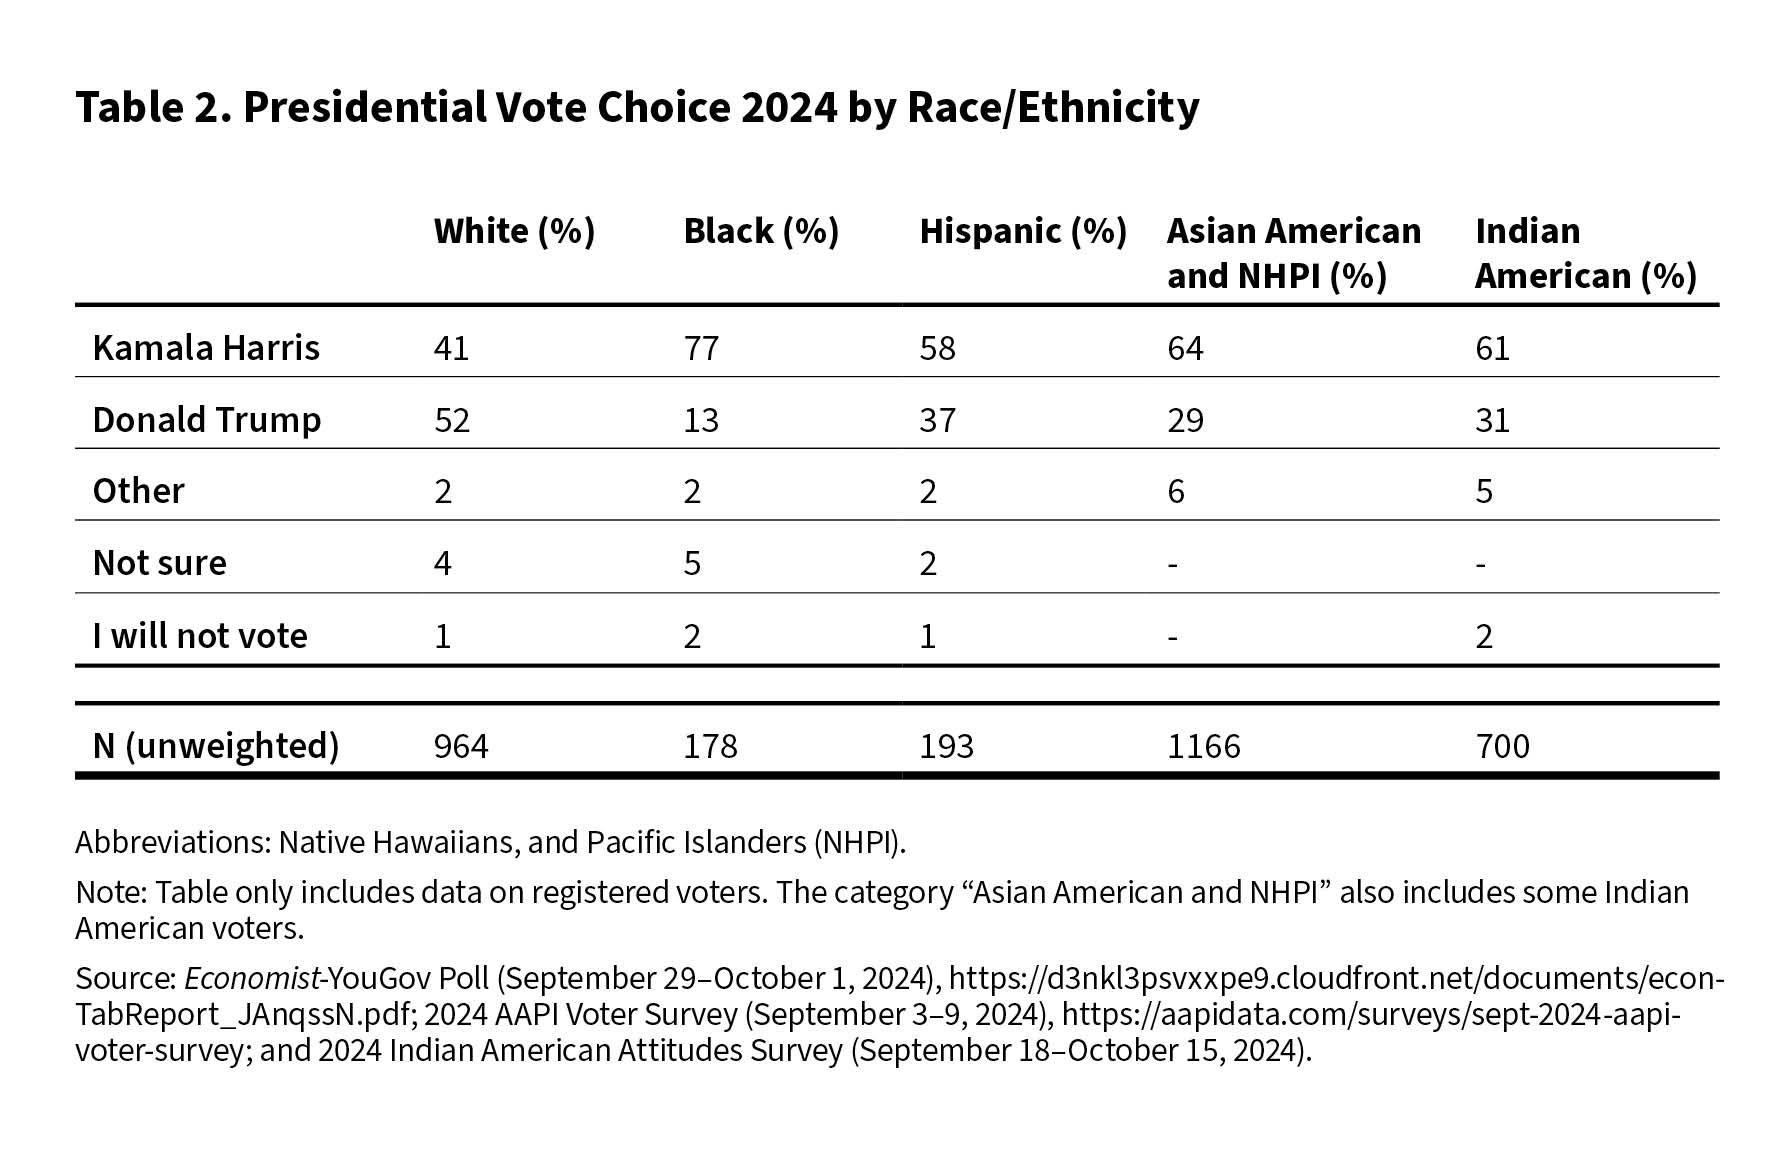
Comparing data from the IAAS with similar surveys conducted in a similar time frame reveals that Indian Americans are less inclined toward Harris than Black voters while somewhat more so than Hispanic Americans. Among registered voters, 77 percent of Black Americans; 64 percent of Asian Americans, Native Hawaiians, and Pacific Islanders; and 58 percent of Hispanic Americans intend to vote for Harris, compared to 61 percent of Indian Americans. White voters are the only demographic group demonstrating majority support for Trump (52 percent). In all, Indian American voters’ preferences are situated somewhere between Black and Hispanic voters in terms of their support for Harris and Trump.
Although noncitizens cannot vote in U.S. elections, most of them do have views on U.S. politics, and a considerable share will likely become U.S. citizens at some point in the future. For this reason, the IAAS surveys both citizens and noncitizens, although in nearly all analyses in this paper, the focus is on the former. Figure 7 compares the presidential voting preferences of citizen and noncitizen responses.
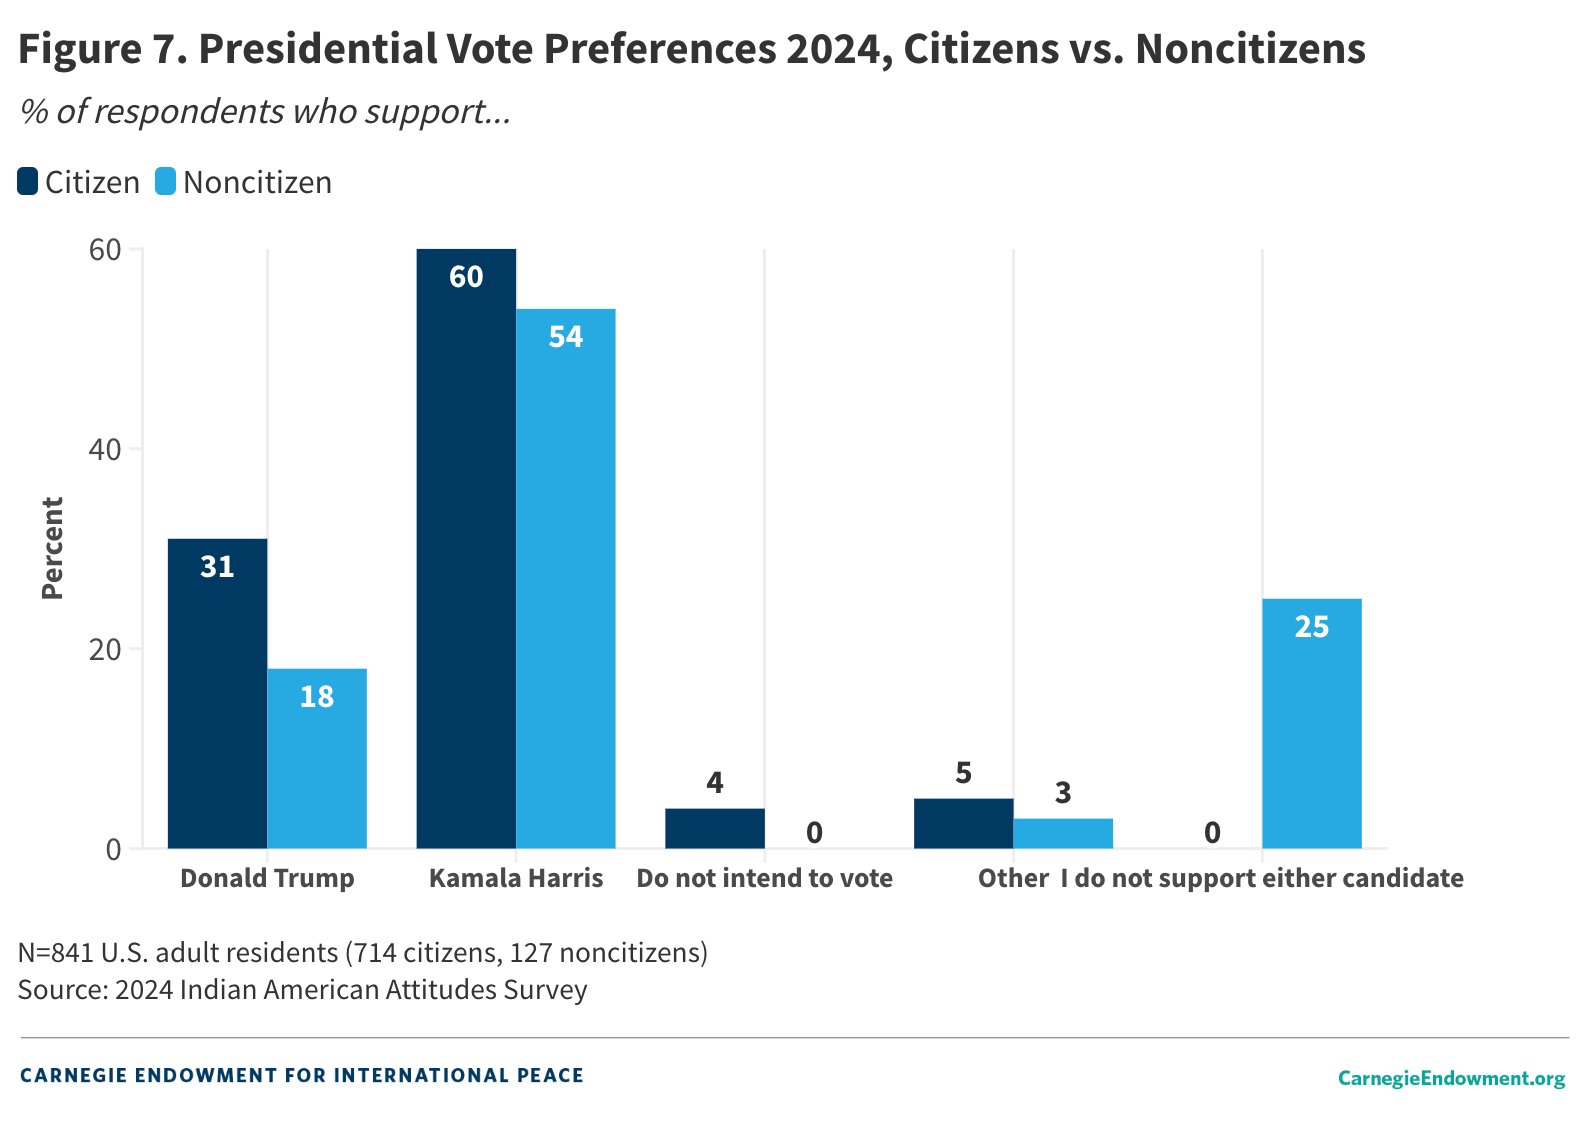
Fifty-four percent of noncitizens prefer Harris and 18 percent favor Trump. A significant share, 25 percent, report they do not support either candidate. Under 3 percent favor a third-party candidate. Noncitizen support of Harris is not dissimilar from citizen support, but there is much less support for Trump among the noncitizen group.
Demographics and the 2024 Election
Indian Americans are a heterogeneous group, with differences spanning from region and religion to education and immigration experience. Since the IAAS is a representative sample of Indian Americans, one of its advantages is its ability to examine variation in political preferences within the community.
Table 3 disaggregates Indian American voting behavior in the 2024 presidential election by a series of key demographic characteristics: age, education, median household income, gender, religion, immigration status, partisan affiliation, year of arrival in the United States, duration of stay in the United States, and U.S. region of residence.
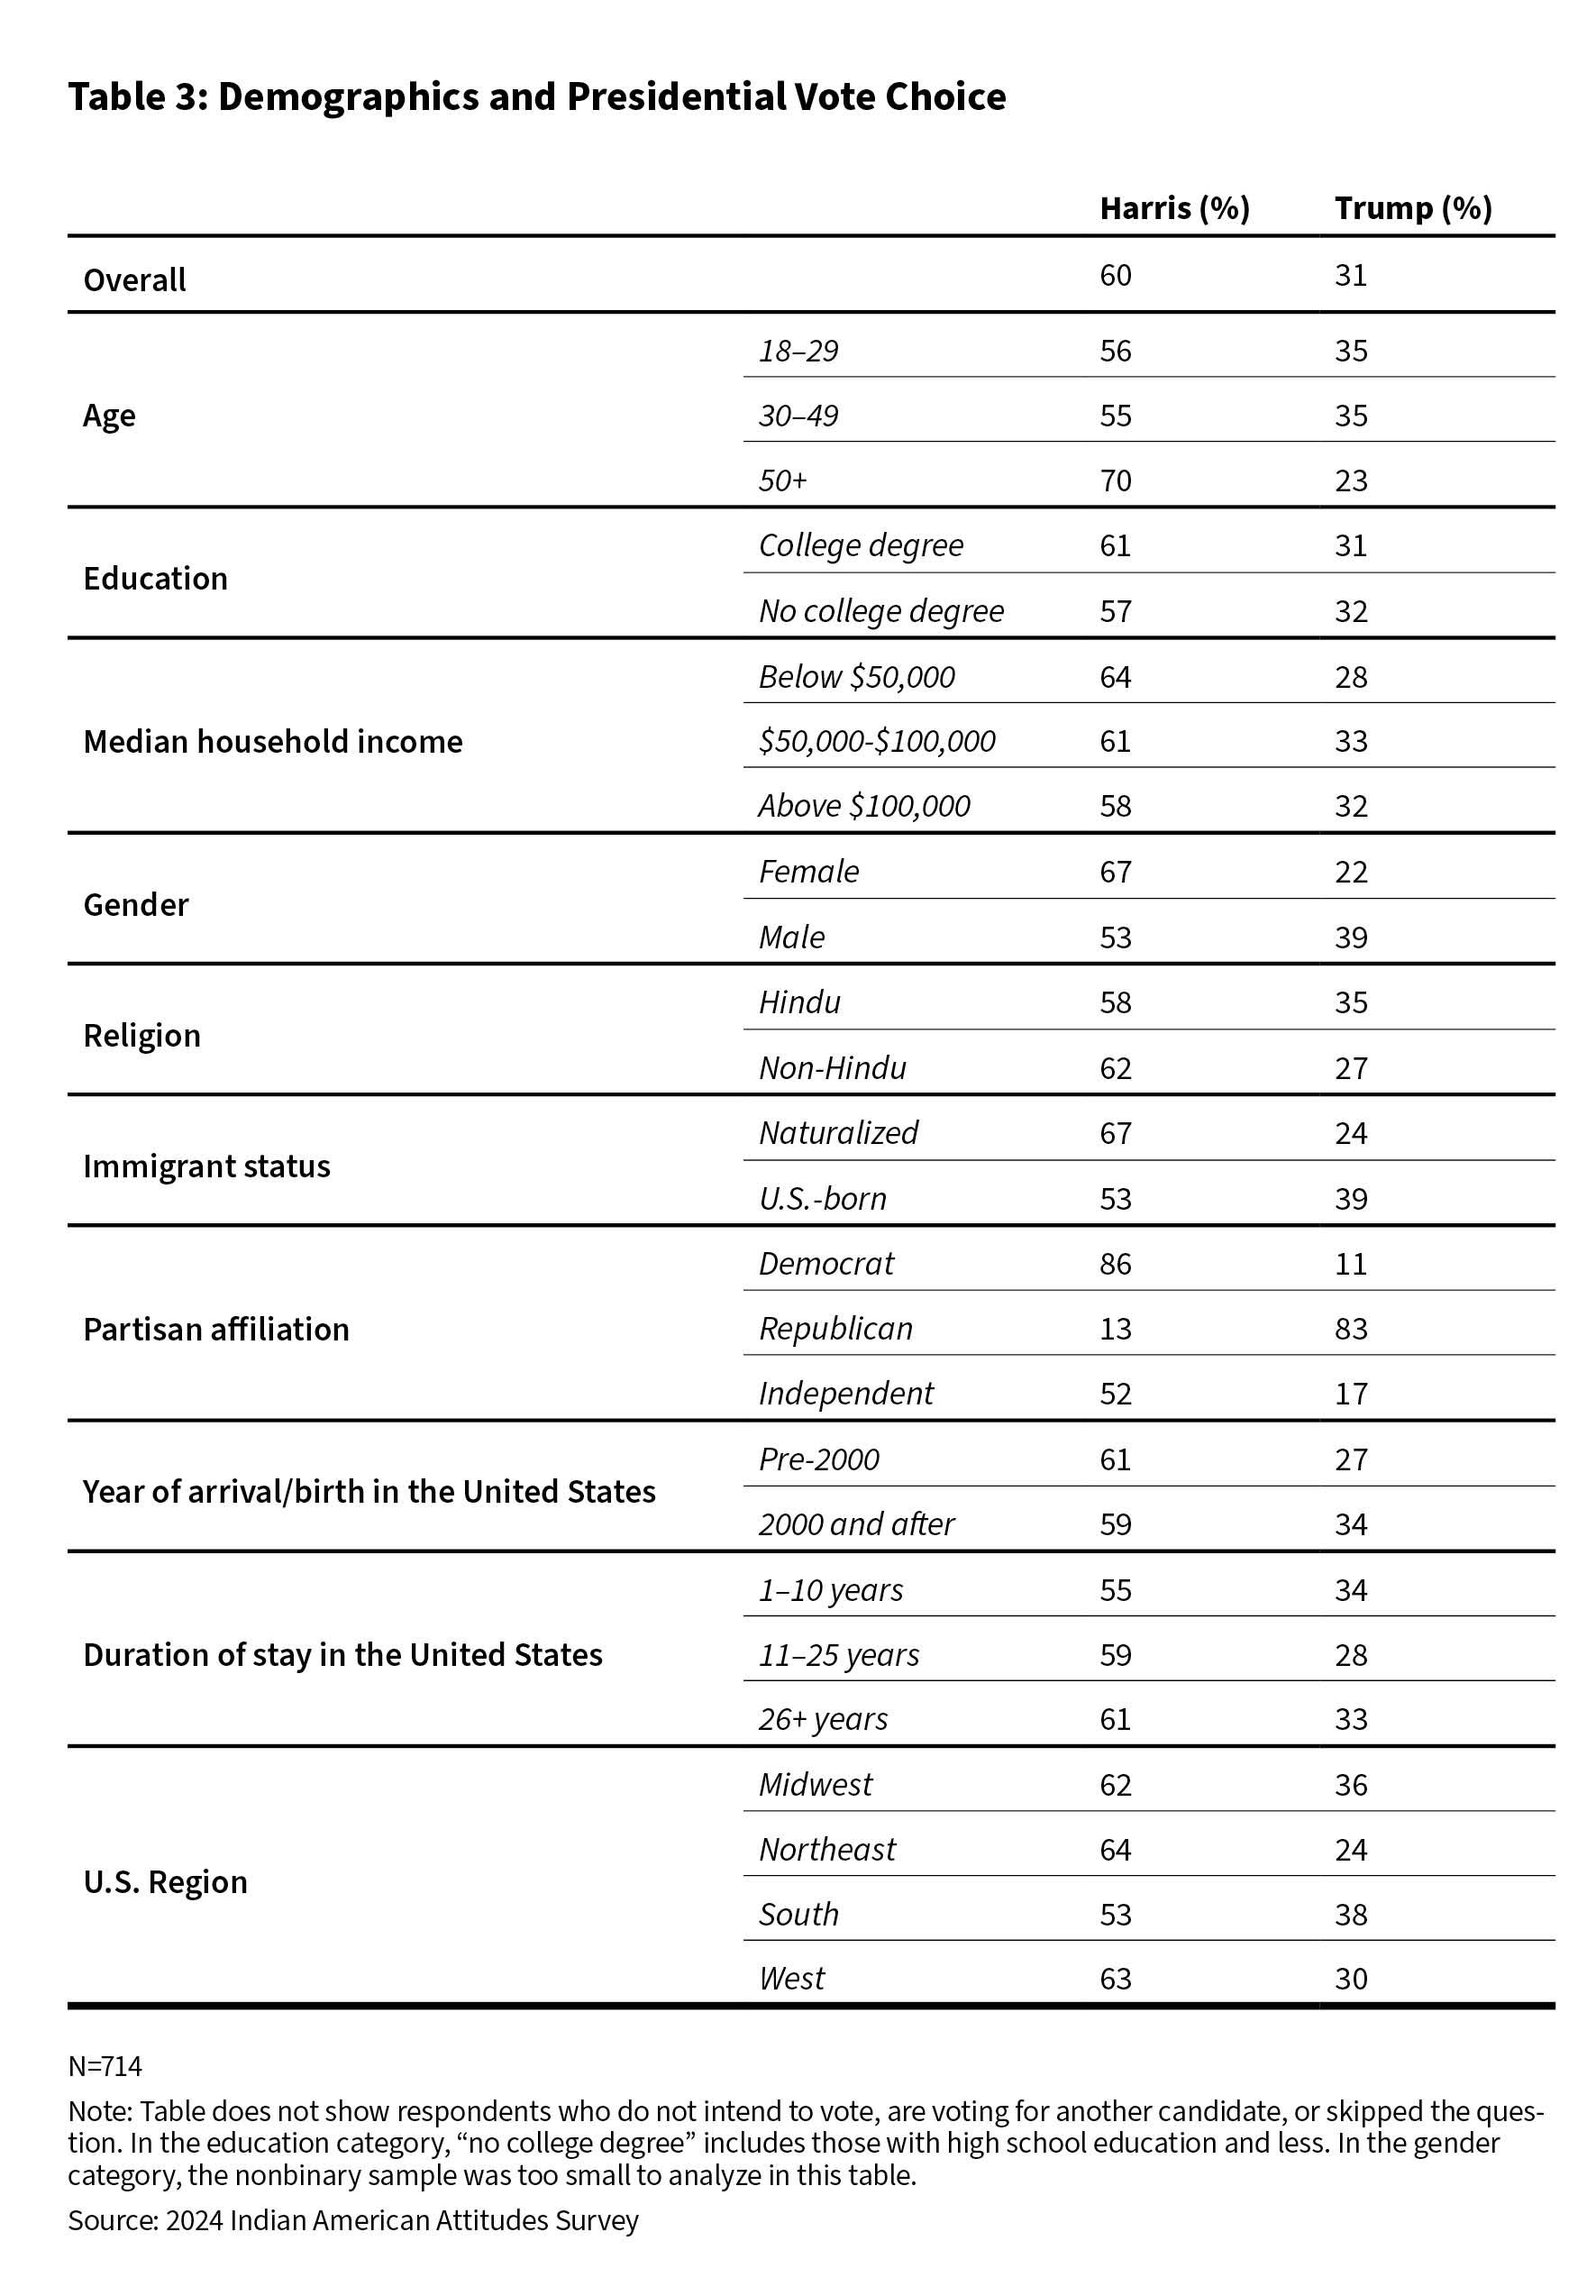
Four stylized facts emerge from table 3.
First, there is a pronounced gender gap in vote preferences among Indian Americans, which is in line with the U.S. voting population at large. Among Indian American women, 67 percent of respondents intend to vote for Harris while just 22 percent report intending to vote for Trump. In contrast, only 53 percent of male respondents report plans to vote for Harris while 39 percent plan to cast their ballots for Trump. In a comparable YouGov-Economist survey fielded simultaneously with the IAAS survey, 51 percent of female respondents plan to vote for Harris compared to 41 percent who plan to vote for Trump. Among men, 45 percent intend to vote for Harris, whereas Trump led at 49 percent.
Second, in terms of age, support for Harris is highest among the oldest respondents. Seventy percent of respondents aged 50 and above intend to vote for Harris, compared to 55 and 56 percent among those 30–49 and 18–29, respectively. Conversely, support for Trump is greatest among those under 50, at 35 percent. This is the mirror image of the U.S. population at large; in nearly all surveys, Harris’s support is greatest among younger voters and gradually erodes as the age of respondents rises.
Third, in another challenge to the conventional wisdom, there is much less education-based polarization compared to the general U.S. population. Where existing surveys of the general population find that higher levels of education correlate with greater Democratic and Harris vote shares, the IAAS 2024 data show little difference between respondents with and without a college degree.
Finally, there is interesting variation based on respondents’ immigration statuses. Support for Harris is 14 percentage points greater among naturalized citizens (67 versus 53 percent), and support for Trump is 15 percentage points higher for U.S.-born respondents (39 versus 24 percent). This differs from the 2020 IAAS, in which support for Biden was marginally higher among U.S.-born citizens compared to naturalized citizens. Four years ago, support for Trump was identical across both groups (22 percent). The 2024 IAAS suggests that support for Trump has risen significantly for the U.S.-born population.
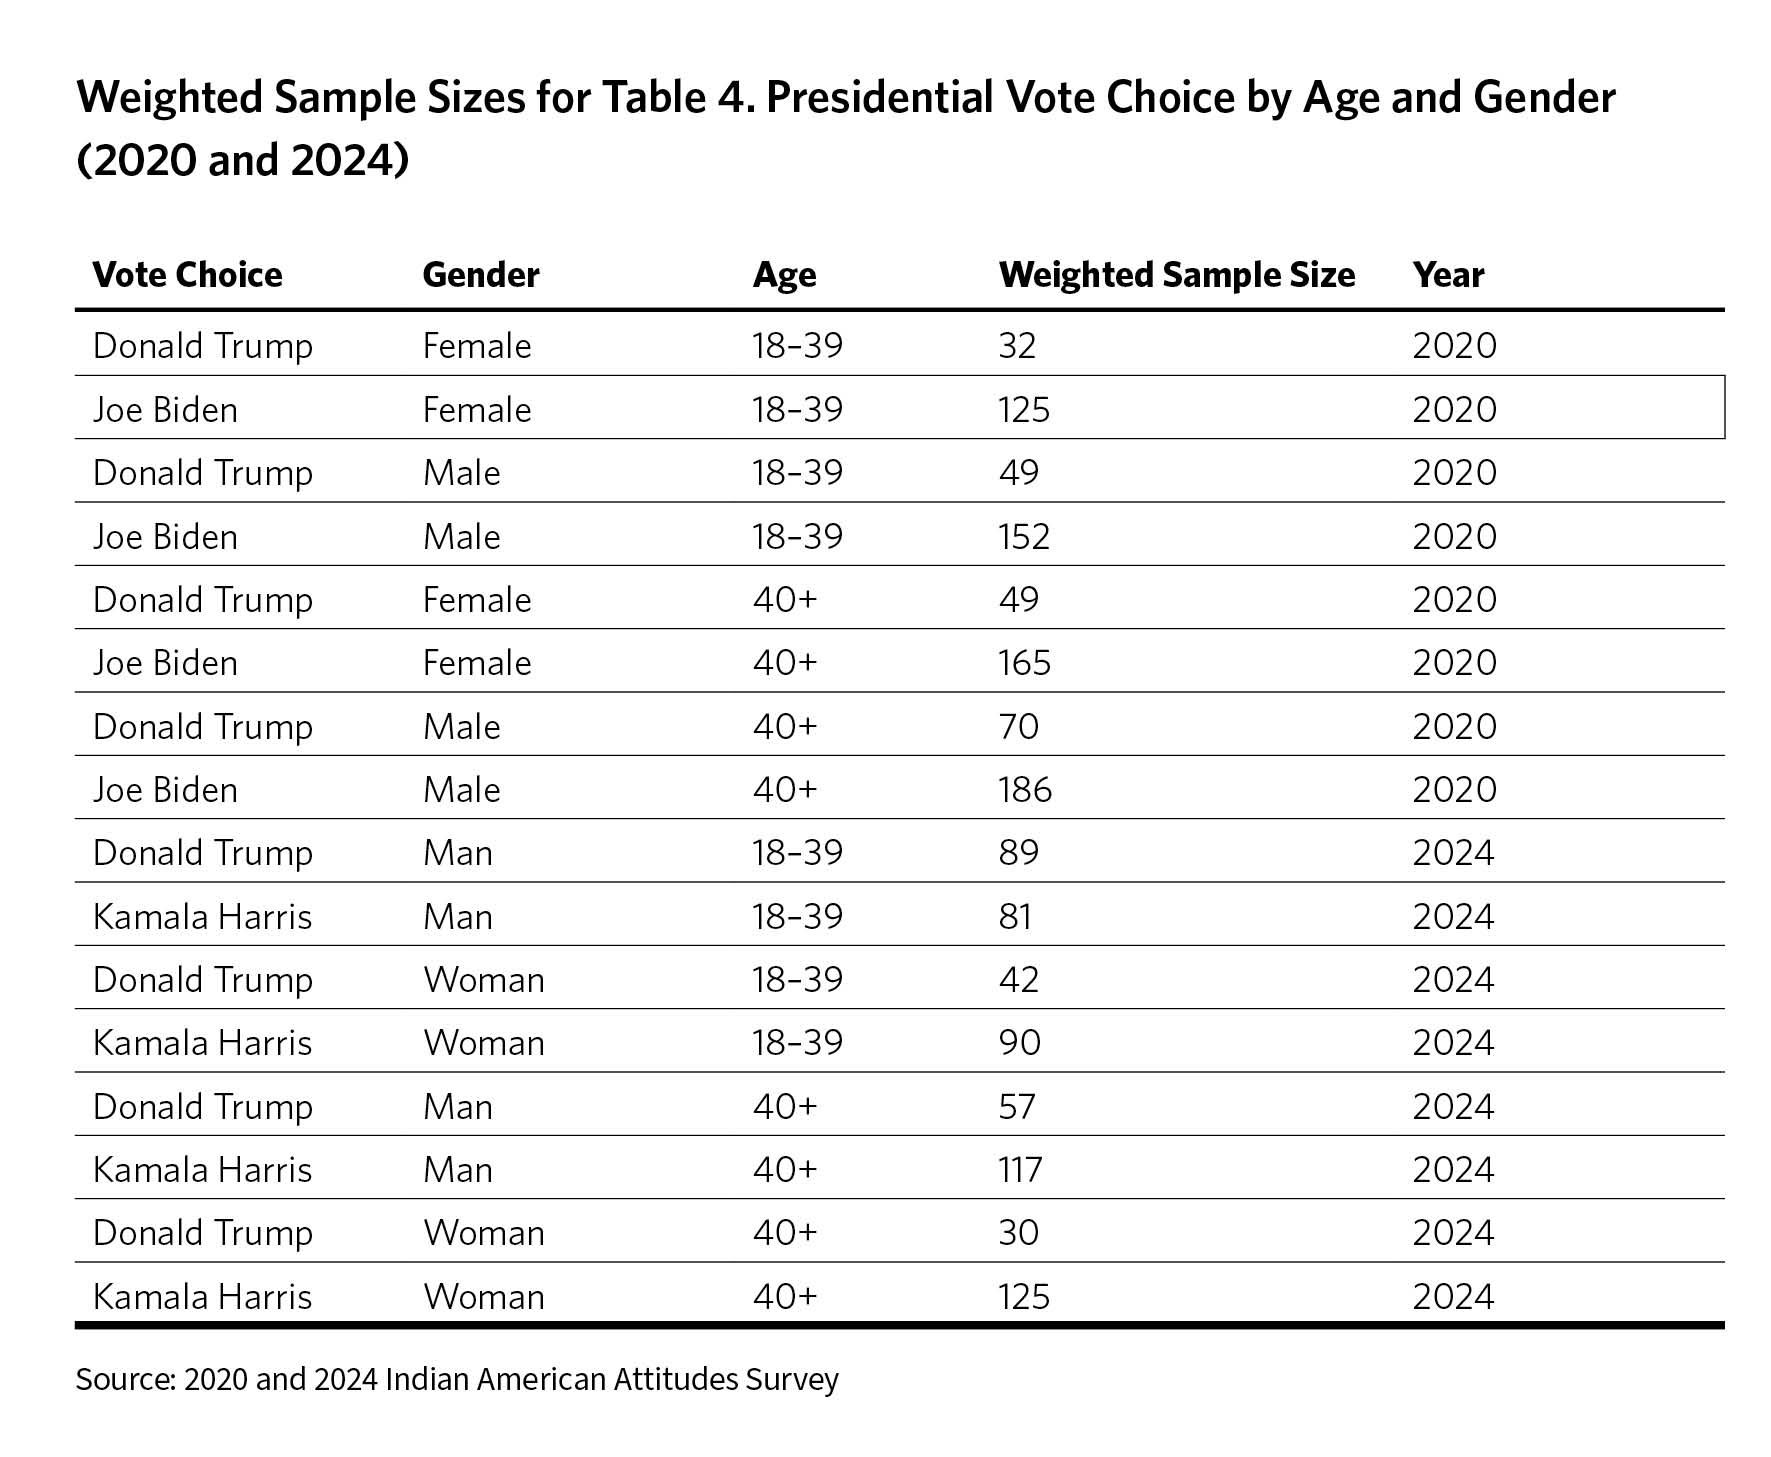
Table 4 provides a breakdown of vote choice for Harris and Trump by age category (under and over 40) for each gender.10 These results should be treated as suggestive, since sample sizes are small when disaggregated by age, gender, and vote choice.11 Having said that, several key patterns emerge. In 2024, for respondents aged 40 and above, 72 percent of women and 63 percent of men plan to vote for Harris. For women in the 40-and-above cohort, the gap between Harris and Trump is 55 percentage points favoring Harris. For men in the 40-and-above cohort, the gap is 32 percentage points favoring Harris.
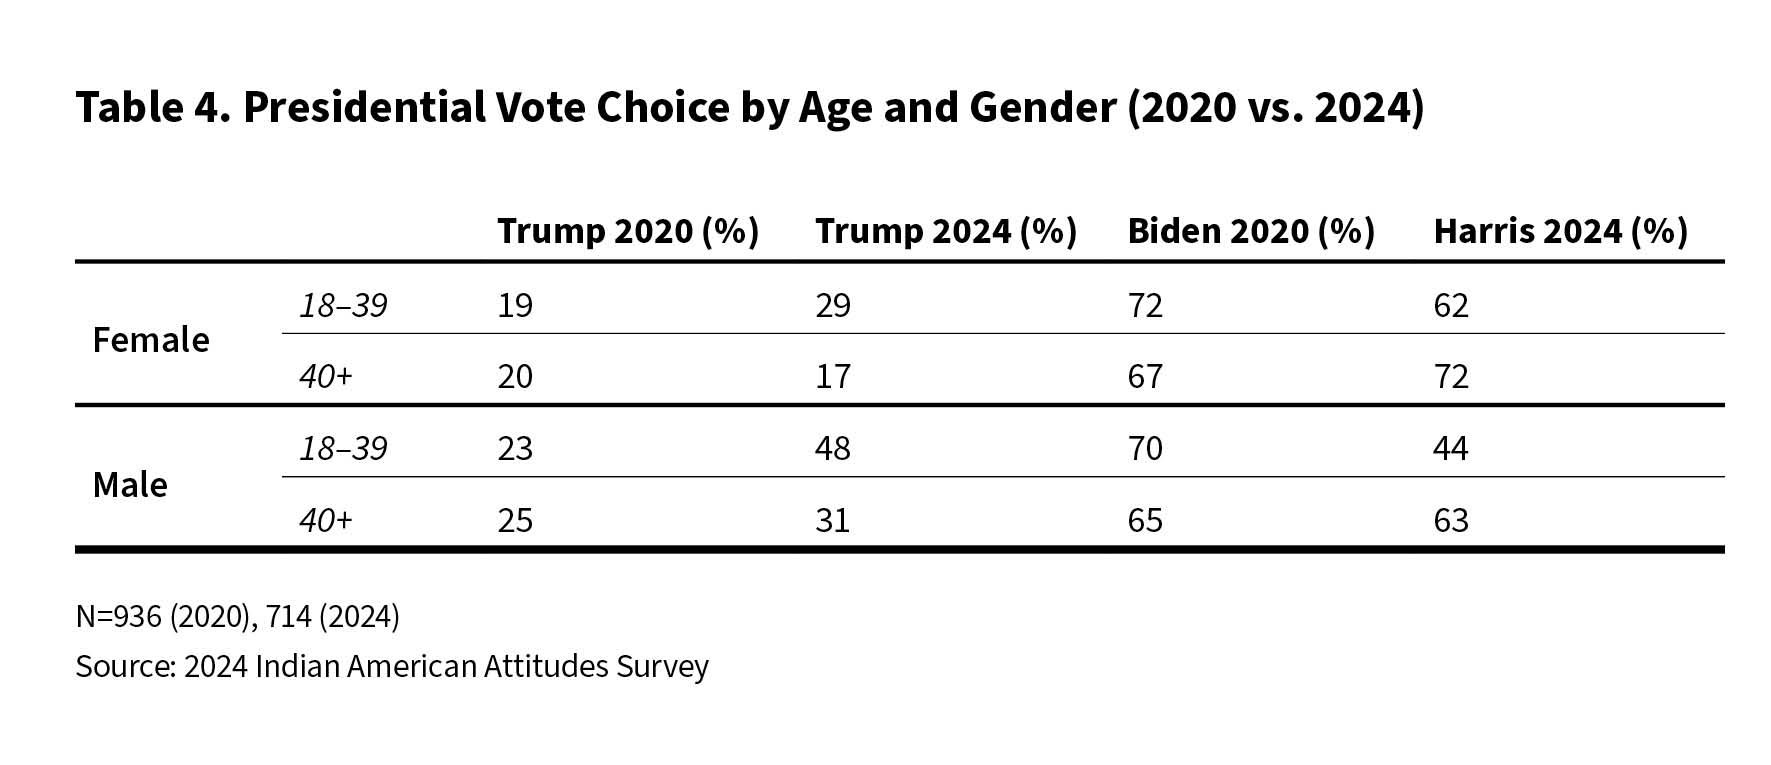
However, these gender patterns change drastically for respondents under 40. For women in the under-40 cohort, there remains a substantial gap in favor of Harris, with 62 percent supporting her compared to 29 percent for Trump (a 33-point gap). In contrast, among men under 40, 48 percent say they favor Trump against 44 percent backing Harris.
The most striking finding is the divergence among men under 40, who, in a traditionally Democratic-leaning sample, show a notable shift toward Trump. This cohort presents a near-even split between the two candidates, suggesting a considerable shift from 2020, when Biden had a nearly 40-point lead with men under 40.
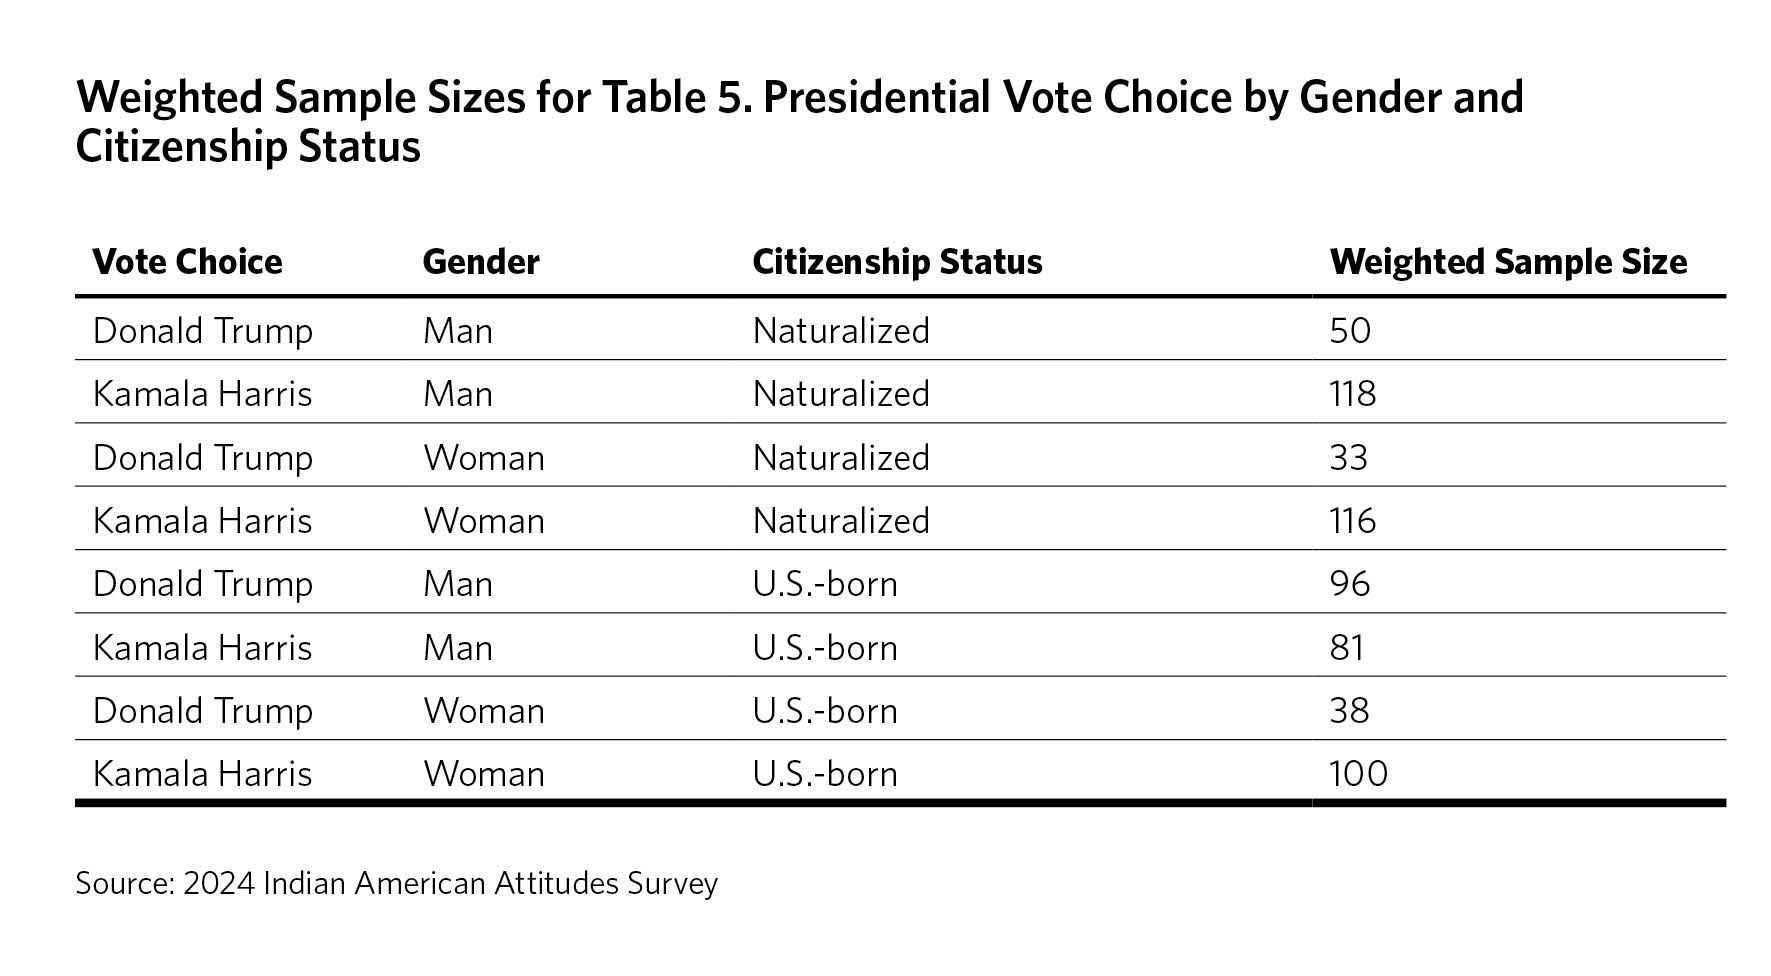
As a final data point on gender, this study examines vote preferences based on respondents’ birthplaces—whether they were born in the United States or abroad (indicating whether they are first-generation immigrants). This distinction reveals some striking differences. Among respondents born abroad, both men and women show significantly higher levels of support for Harris, with a substantial margin of at least a 40-point difference over Trump. This margin reflects a strong alignment with Democratic preferences within most immigrant communities (see table 5).12
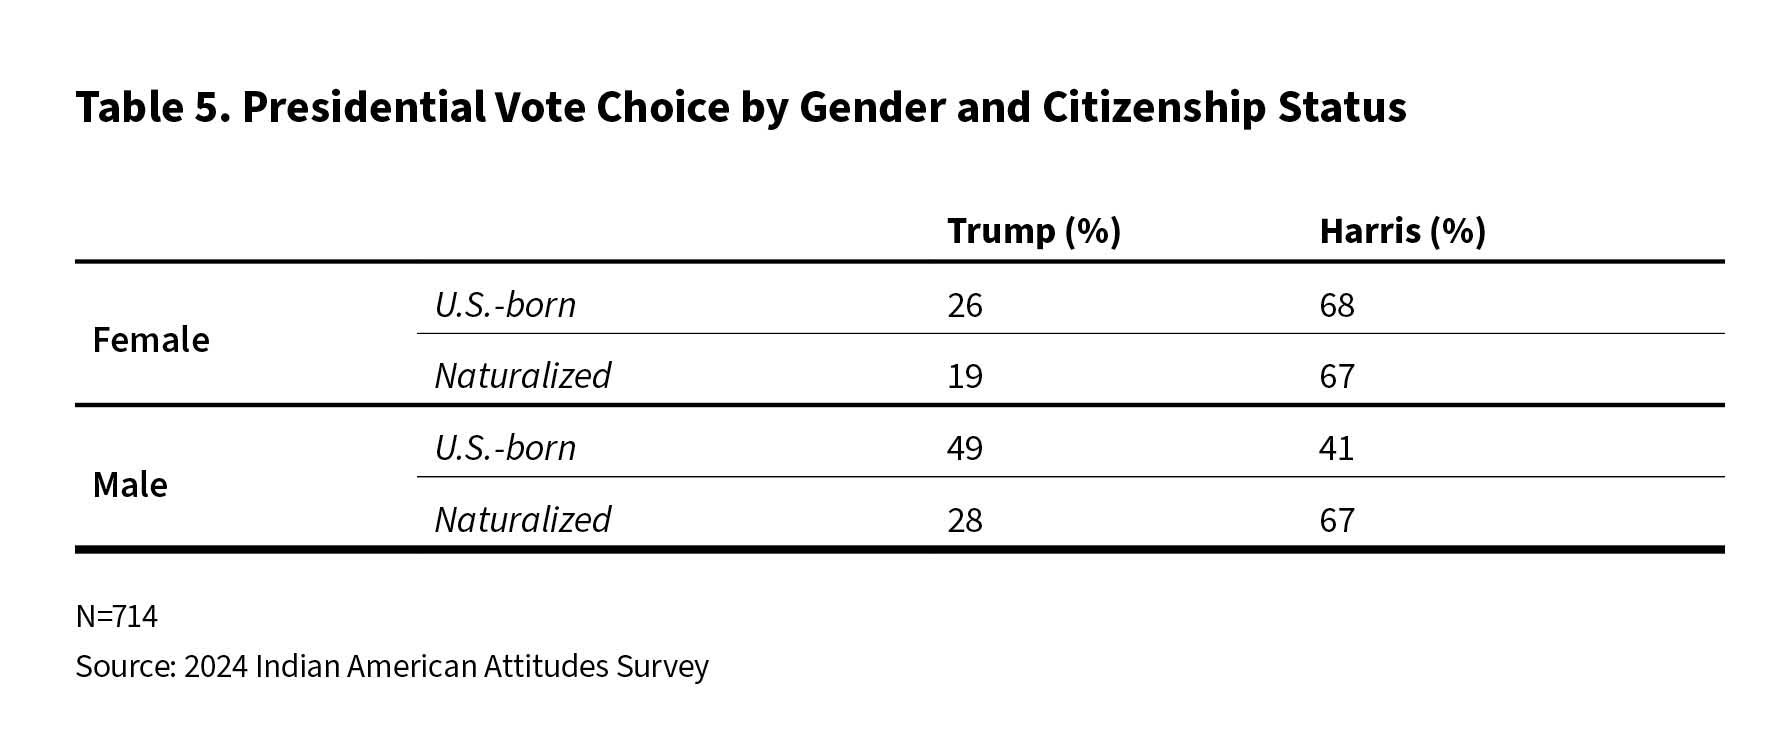
However, the pattern shifts when looking at U.S.-born respondents. While U.S.-born women continue to favor Harris by a considerable margin, the voting behavior of U.S.-born men diverges sharply. Among this group, Trump leads with 49 percent, compared to 41 percent for Harris. This finding is especially noteworthy given the broader context of the electorate, where support for Democrats has traditionally been higher among men and women in younger and more diverse demographic groups. This reversal suggests that ethnic identities may be more salient for immigrants while gender may be more important for the native born. U.S.-born men may be responding to different political cues or socialization processes than their immigrant counterparts.
Collectively, these findings suggest that political socialization in the United States may be driving native-born men, particularly younger men, toward more conservative or populist political preferences, even as Indian American immigrant men and women remain aligned with more progressive, Democratic-leaning policies.
House and Senate Elections
In addition to the presidential race at the top of the ticket, this election season, voters will also be selecting a new class of 435 members of the House of Representatives and, in thirty-three states, new members of the U.S. Senate.
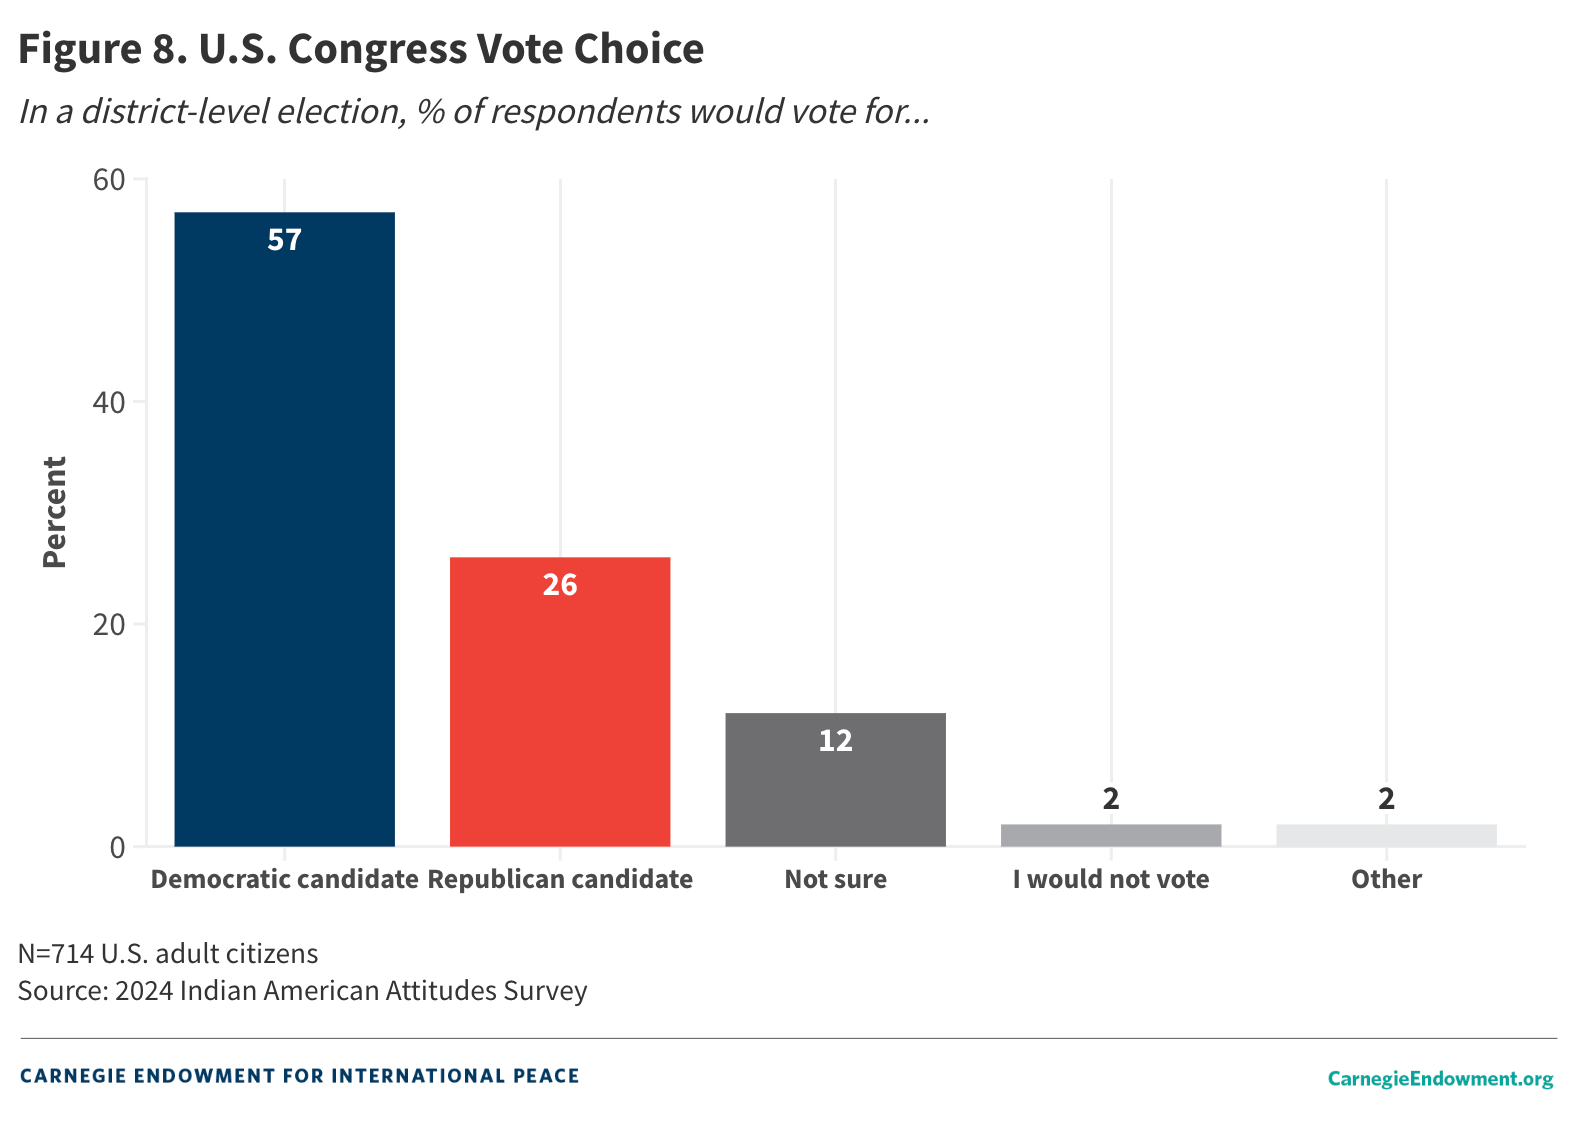
The survey asked respondents about their voting intentions in both sets of downballot races (see figure 8). In the coming House elections, 57 percent of Indian American respondents report that they intend to vote for the Democratic candidate in their district, and 26 percent plan to vote for the Republican. Twelve percent are not sure, and 2 percent each say they will not vote or vote for a third party.
The proportions are nearly identical for Senate races, with 59 percent of respondents intending to vote for the Democrat, 26 percent for the Republican, 10 percent unsure, 2 percent for a third-party candidate, and 3 percent not planning to vote (see figure 9).
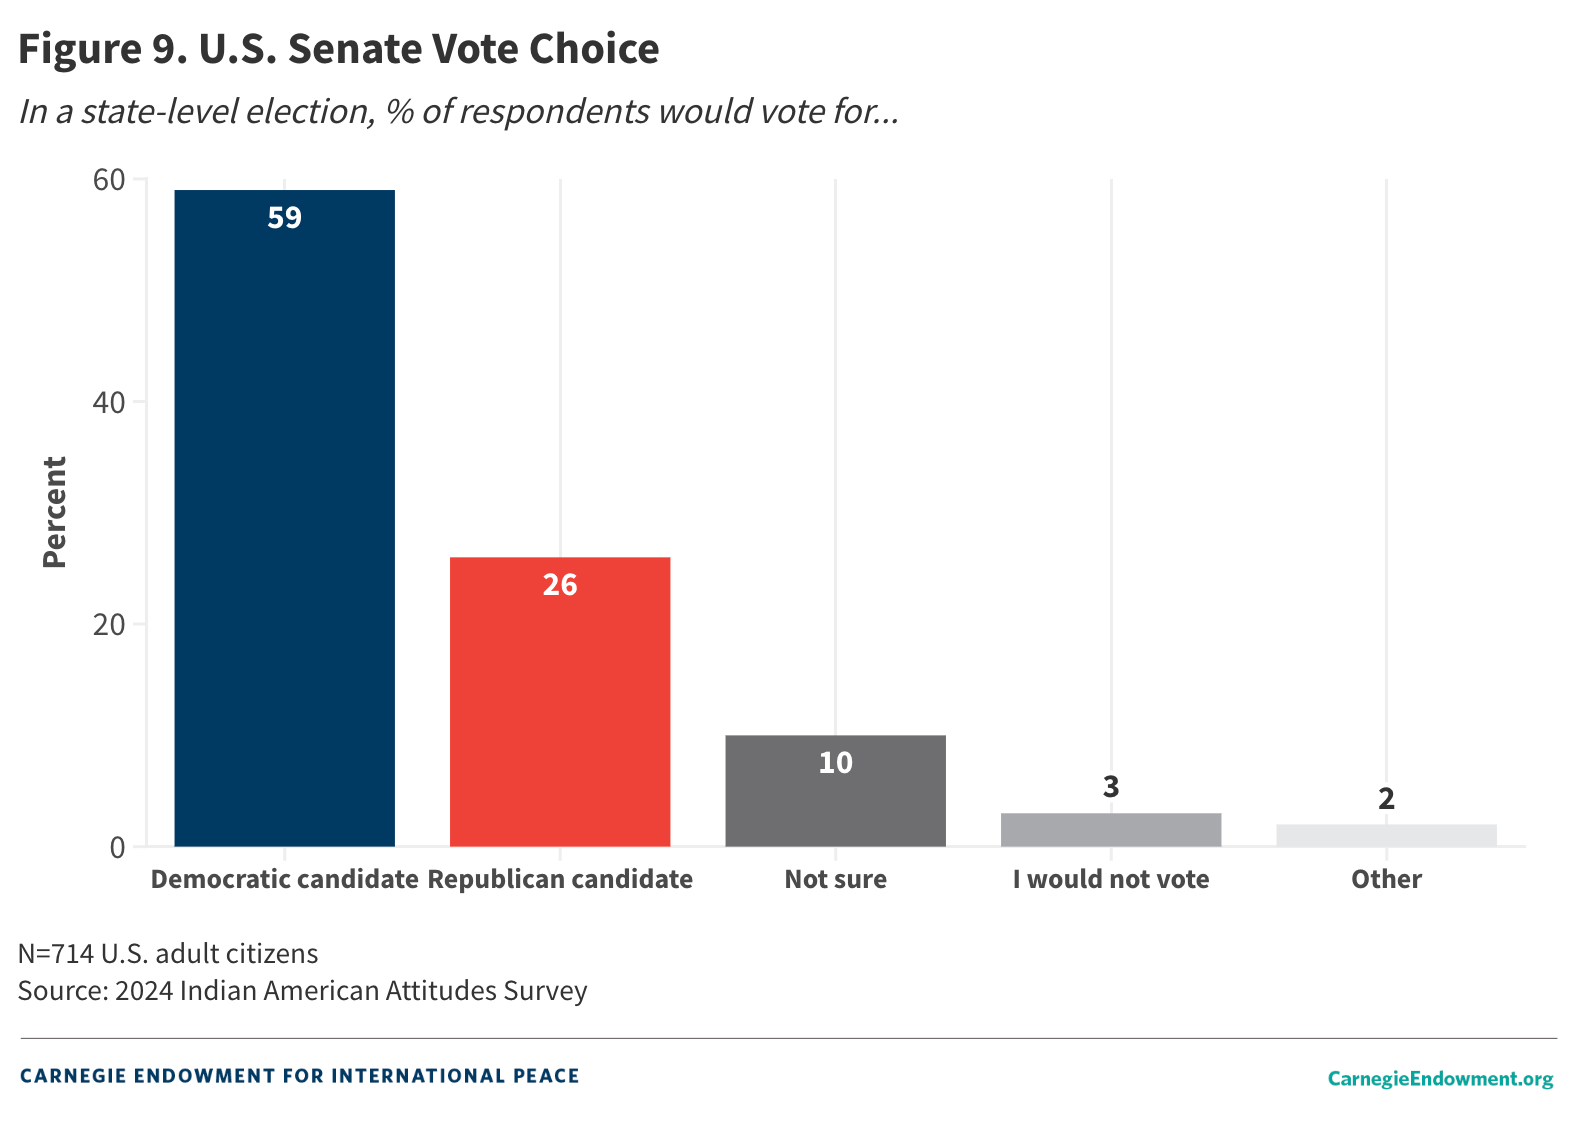
One caveat is in order here, which is that figure 9 reports voting preferences for Senate races aggregated at the national level. While all House seats are contested since members serve two-year terms, there are only thirty-four Senate races taking place across thirty-three states this November. Therefore, in states where no Senate race is taking place, the data describe hypothetical voting intentions as if an election were taking place.
Evaluation of Political Leadership
This section reviews how Indian Americans evaluate several political leaders in the United States. It begins with their assessment of Biden’s record as president. Next, it explores how Indian Americans view both major parties, this year’s presidential and vice presidential candidates, and other Indian Americans in the political spotlight. Then, it looks at respondents’ views on Harris and the extent to which her presence on the ballot has been embraced by Indian Americans. Finally, it examines how Indian Americans responded to a counterfactual scenario in which former South Carolina governor Nikki Haley was the Republican nominee in place of Trump and faced off against Harris in a contest between two women of Indian origin.
Biden’s Job Approval
The survey asked respondents how they assess the job Biden has done in the White House (see figure 10). Thirty-six percent of respondents strongly approve of Biden’s performance, while another 24 percent approve of the job he has done. On the negative side, 17 percent and 22 percent disapprove or strongly disapprove of Biden’s handling of the presidency, respectively.
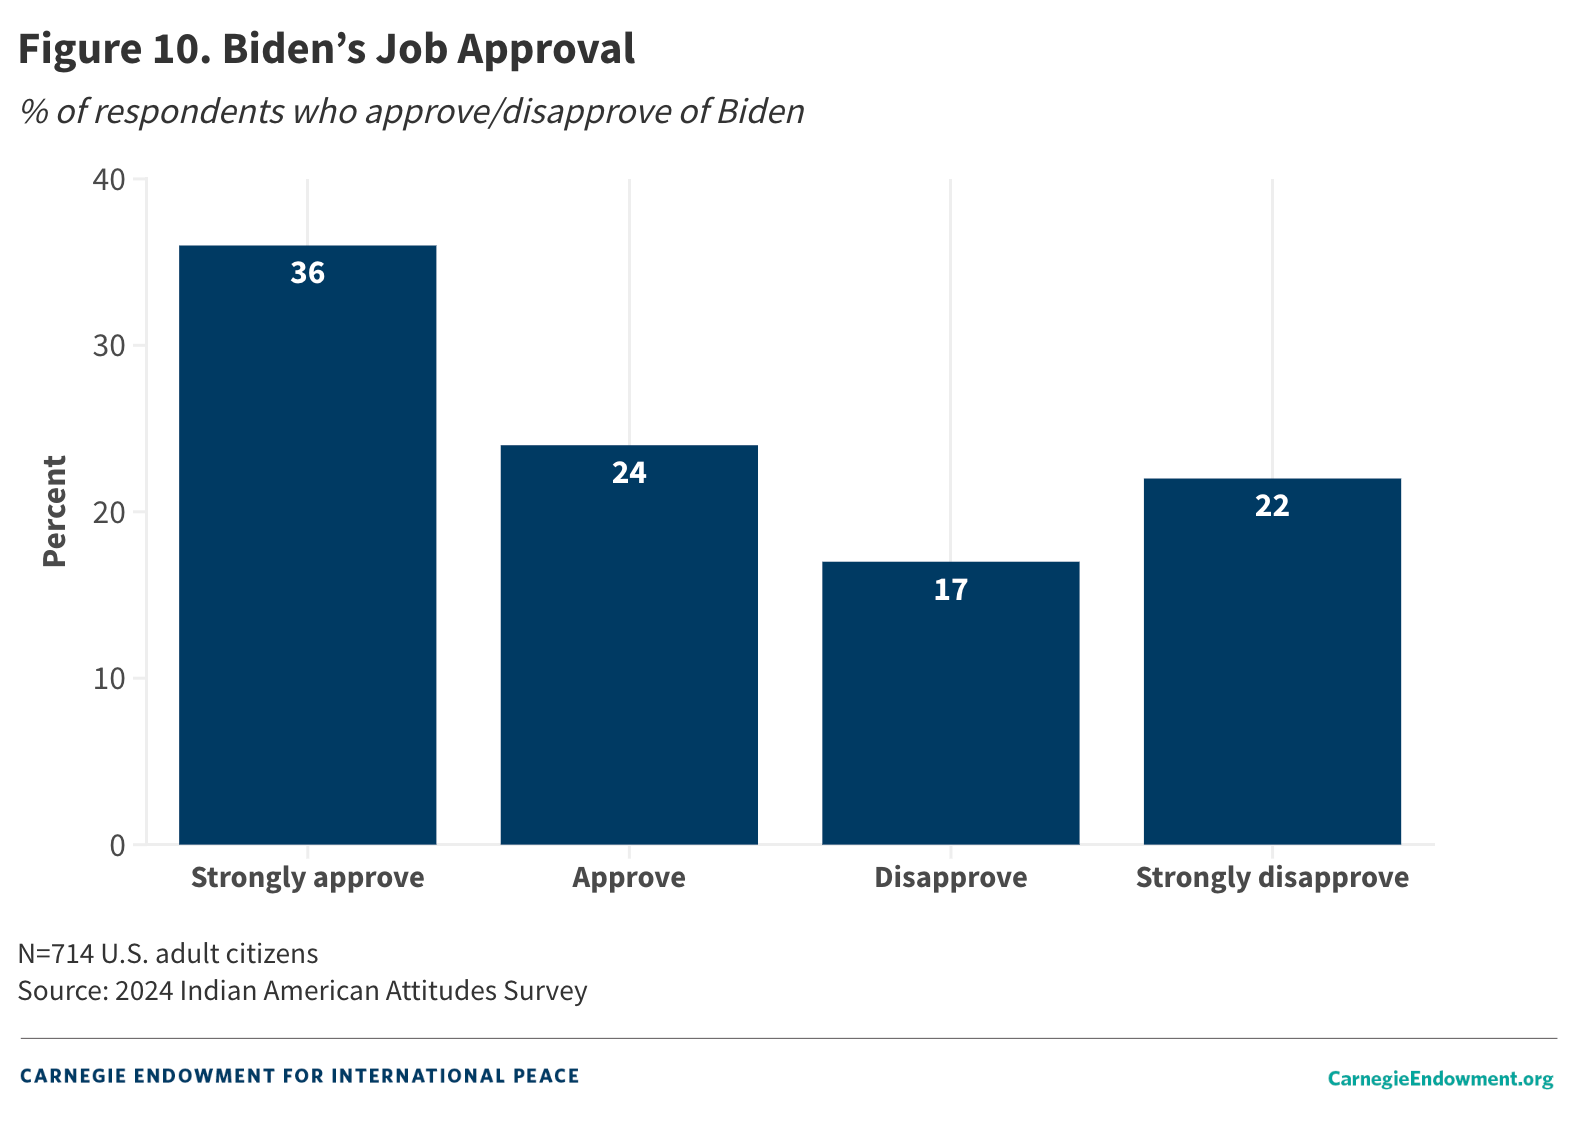
Given the extent of partisan polarization in the American population, it is not surprising that views on Biden’s performance diverge sharply according to respondents’ political affiliations. While 77 percent of respondents who identify as Democrats approve of Biden’s job, only 37 percent of Republican respondents do the same. Among independents, 58 percent approve of the job Biden has done.
Feeling Thermometer
Beyond Biden, how do Indian Americans view a wider set of prominent politicians? To examine this question, the survey collected responses to a so-called feeling thermometer, whereby respondents are asked to rate political parties or individual leaders on a scale of 0 to 100—a technique popularized by the American National Election Studies.
Ratings between 0 and 49 mean that respondents do not feel favorable (or feel “cold”) toward the person or entity, a rating of 50 means that respondents are indifferent toward them, and ratings between 51 and 100 degrees mean that respondents feel favorable (or “warm”) toward them.
The questions probe respondents’ views on Biden, Harris, Trump, vice presidential candidates JD Vance and Tim Walz, and three prominent Indian American politicians—former 2024 Republican presidential candidates Nikki Haley and Vivek Ramaswamy as well as Usha Vance, the Indian-origin wife of vice presidential nominee JD Vance (see figure 11).
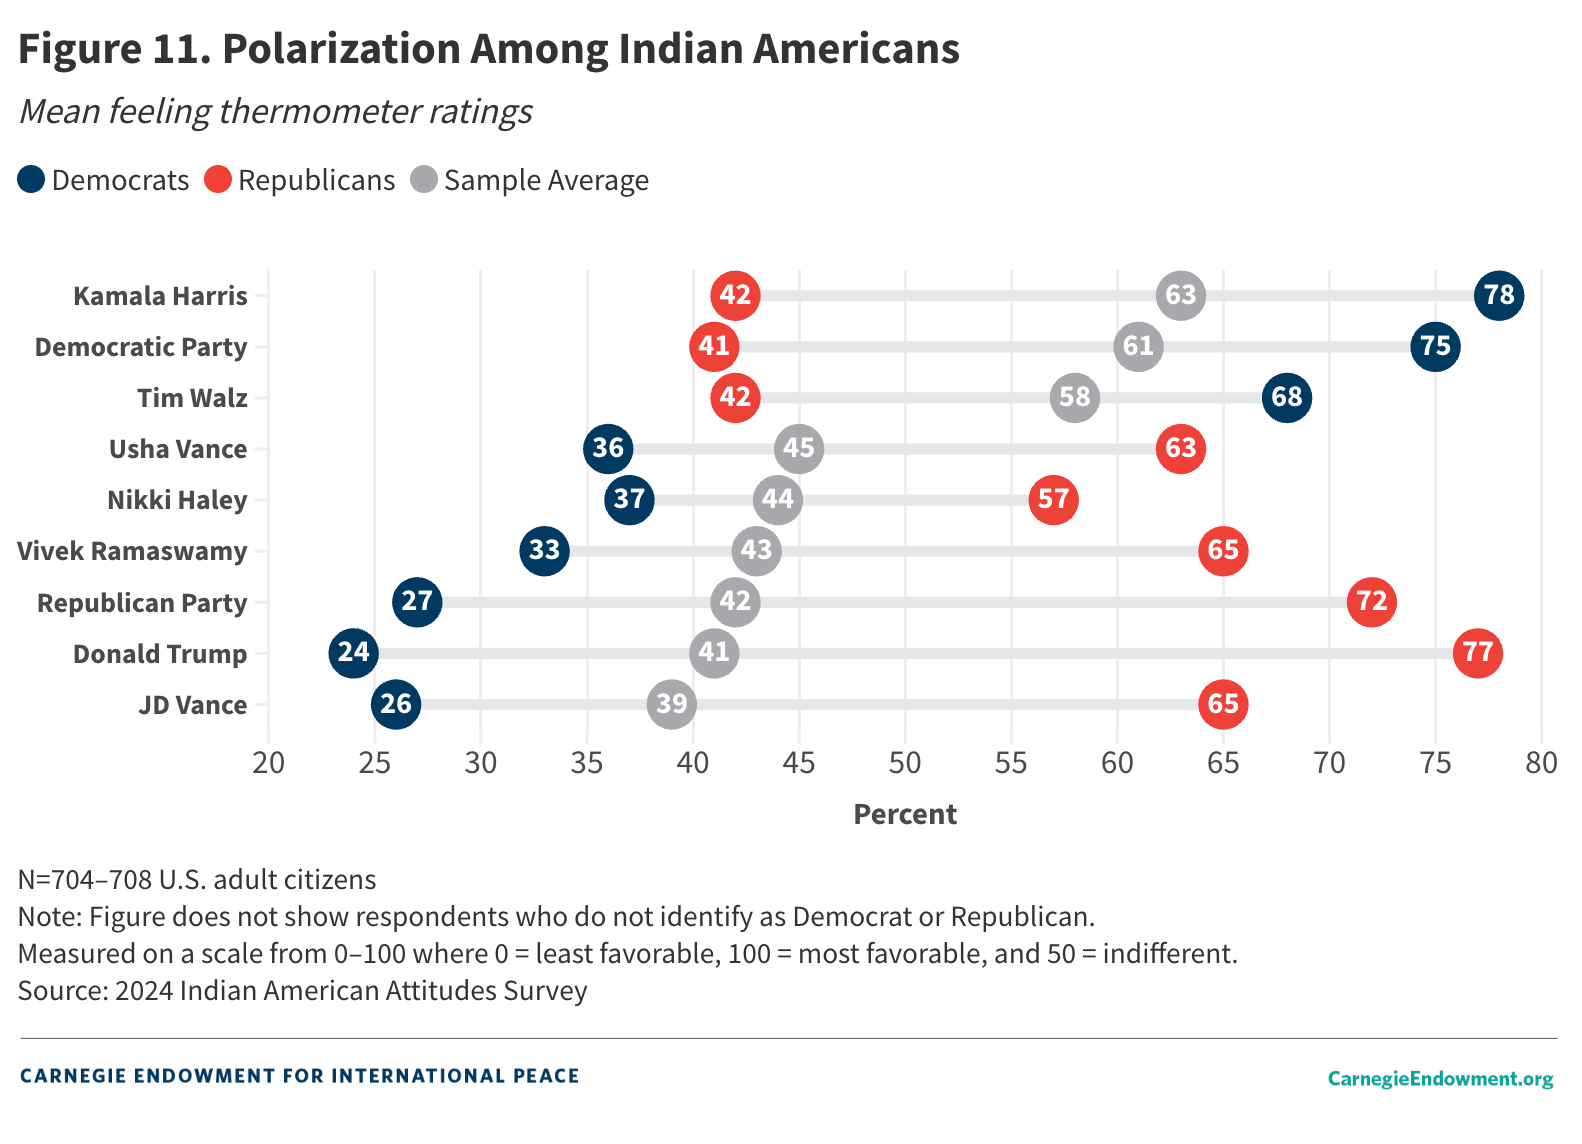
There is a clear pattern in the data based on partisanship, in line with the findings of the 2020 IAAS.13 Respondents give the Democratic Party an average rating of 61 (out of 100). Harris scores a 63, while Walz receives a 58. The Republican Party gets a much colder rating of 42, one point higher than the rating given to Trump. Trump’s running mate, JD Vance, gets a 39 rating. The highest-rated individual on the Republican side is Usha Vance, who gets a rating of 45. She is closely followed by Nikki Haley at 44 and Vivek Ramaswamy at 43.
Not surprisingly, there is a significant amount of polarization when it comes to how respondents rate these organizations and individuals based on their own partisanship. For instance, Republican respondents give the Republican Party a rating of 72 while Democrats give it a 27. Conversely, Democratic respondents give their own party a 75 rating while Republicans give it a 41. Interestingly, there is some evidence of asymmetric polarization: Democrats rate Republicans much more poorly than the reverse. Nikki Haley distinguishes herself as the least-polarizing individual: Republicans rate her a 57 while Democrats give her a 37, a net differential of 20—a stark contrast to a net differential of 53 for Trump.
Views on Kamala Harris
In the 2020 presidential contest, Biden’s selection of Harris as his vice presidential nominee prompted much discussion about how Indian Americans would react to Harris, given Harris’s Indian heritage; Harris’s mother was born in India and immigrated to the United States in 1958 to attend a graduate program at the University of California-Berkeley. At the same time, Harris’s father was Black, and Harris herself has said that she and her sister were raised as Black women, prompting some observers to raise questions about whether the Indian American community would see Harris as truly one of their own.14 More recently, Trump himself has sought to sow confusion about Harris’s racial identity.
How do Indian Americans view Harris in 2024 given that she is now the Democratic Party’s presidential nominee? To answer this question, the survey first asked those voting for Harris whether their vote was more a vote in favor of Harris or instead a vote against Trump. Seventy-two percent of Harris supporters responded in the affirmative; that is, they are voting for Harris rather than in opposition to Trump. Twenty-three percent report that their vote for Harris is a vote against Trump.
Trump voters are even more motivated to vote for their candidate: Ninety-one percent report they are voting affirmatively for Trump with just 5 percent saying their vote is against Harris.
While existing survey data suggest that many voters, including those who identify with the Democratic Party, supported Biden’s withdrawal from the race, there were many Americans who either supported Biden or who hoped there would be a “mini-primary” in which multiple candidates vied to succeed him. In the end, Harris secured the nomination with little to no opposition.
The survey asked respondents whether they support Harris’s nomination in the wake of Biden’s abrupt withdrawal from the race. A clear majority of respondents—60 percent—indicate that they are supportive of Harris’s nomination, with 23 percent in opposition and 18 percent expressing no opinion. As one might expect, support for Harris replacing Biden as the Democratic nominee was significantly higher among Democrats (85 percent) than Republicans (32 percent). Interestingly, independents appear to be divided; 44 percent support the move, 24 percent oppose it, and 33 percent express no opinion.
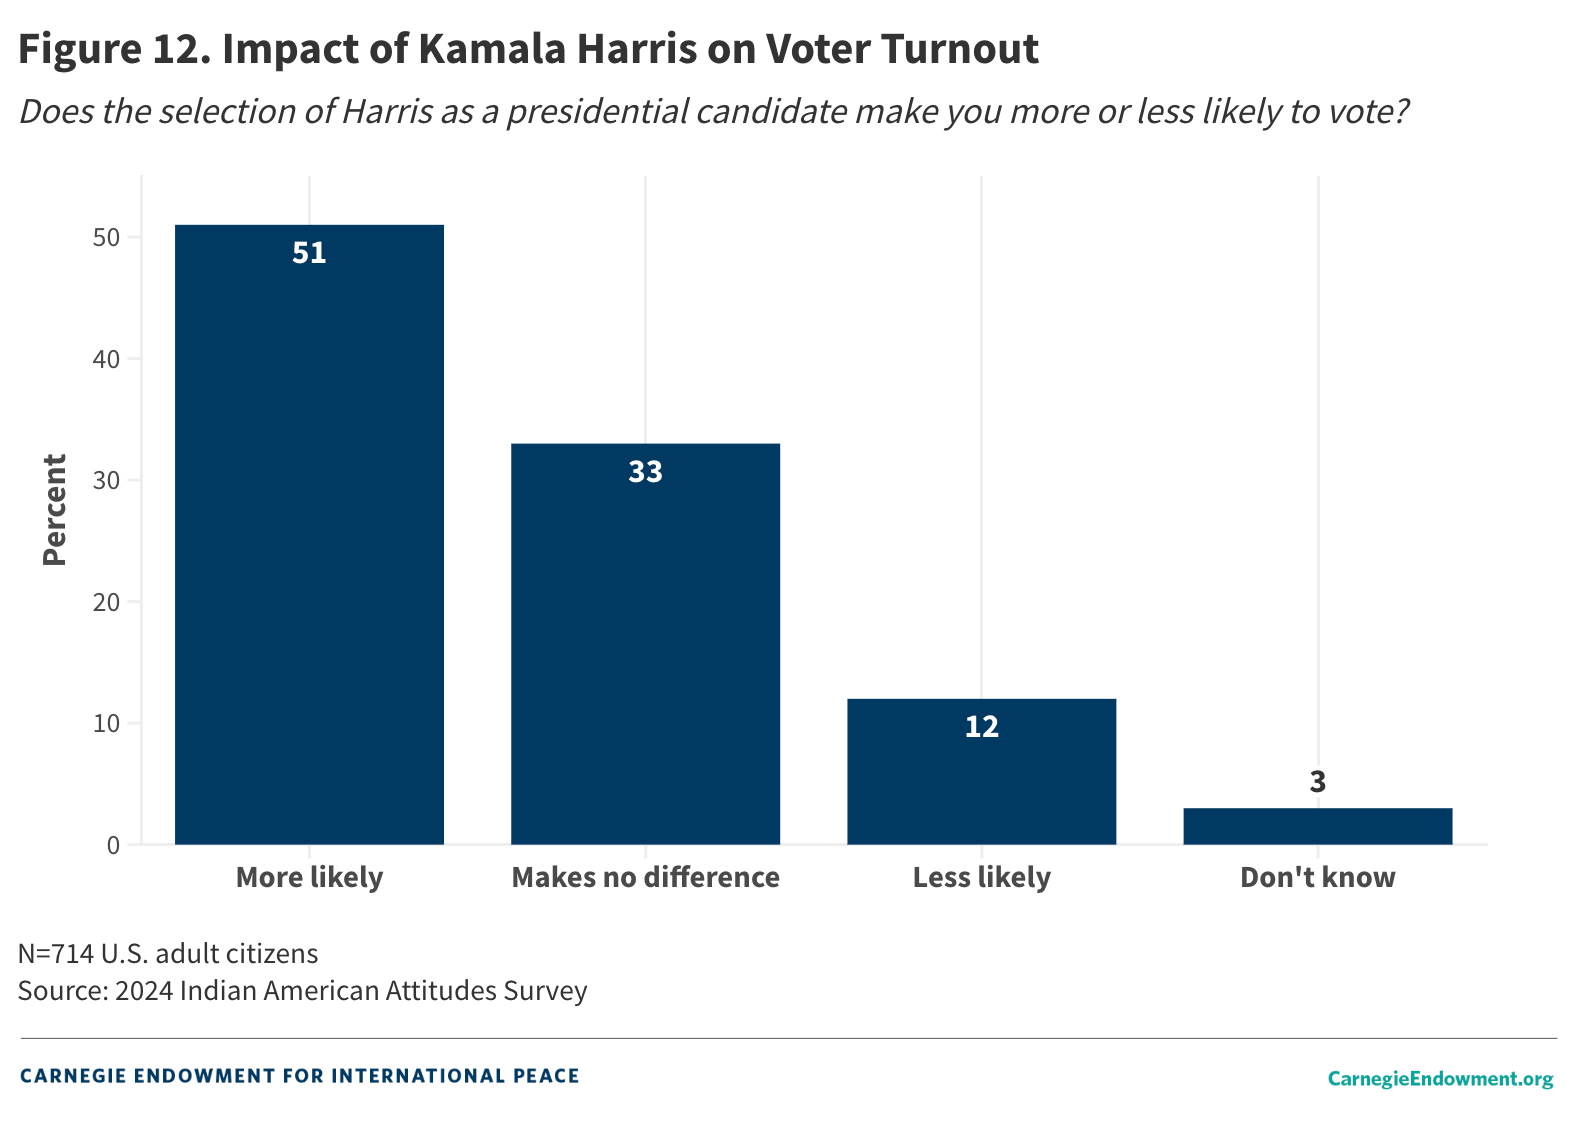
As in the 2020 IAAS, the 2024 edition also asks respondents whether Harris’s nomination as the Democratic candidate makes them more or less likely to vote in the November presidential election (see figure 12). Fifty-one percent report that her selection makes them more likely to vote, 12 percent report that it makes them less likely to vote, and 33 percent say that her nomination makes no difference.
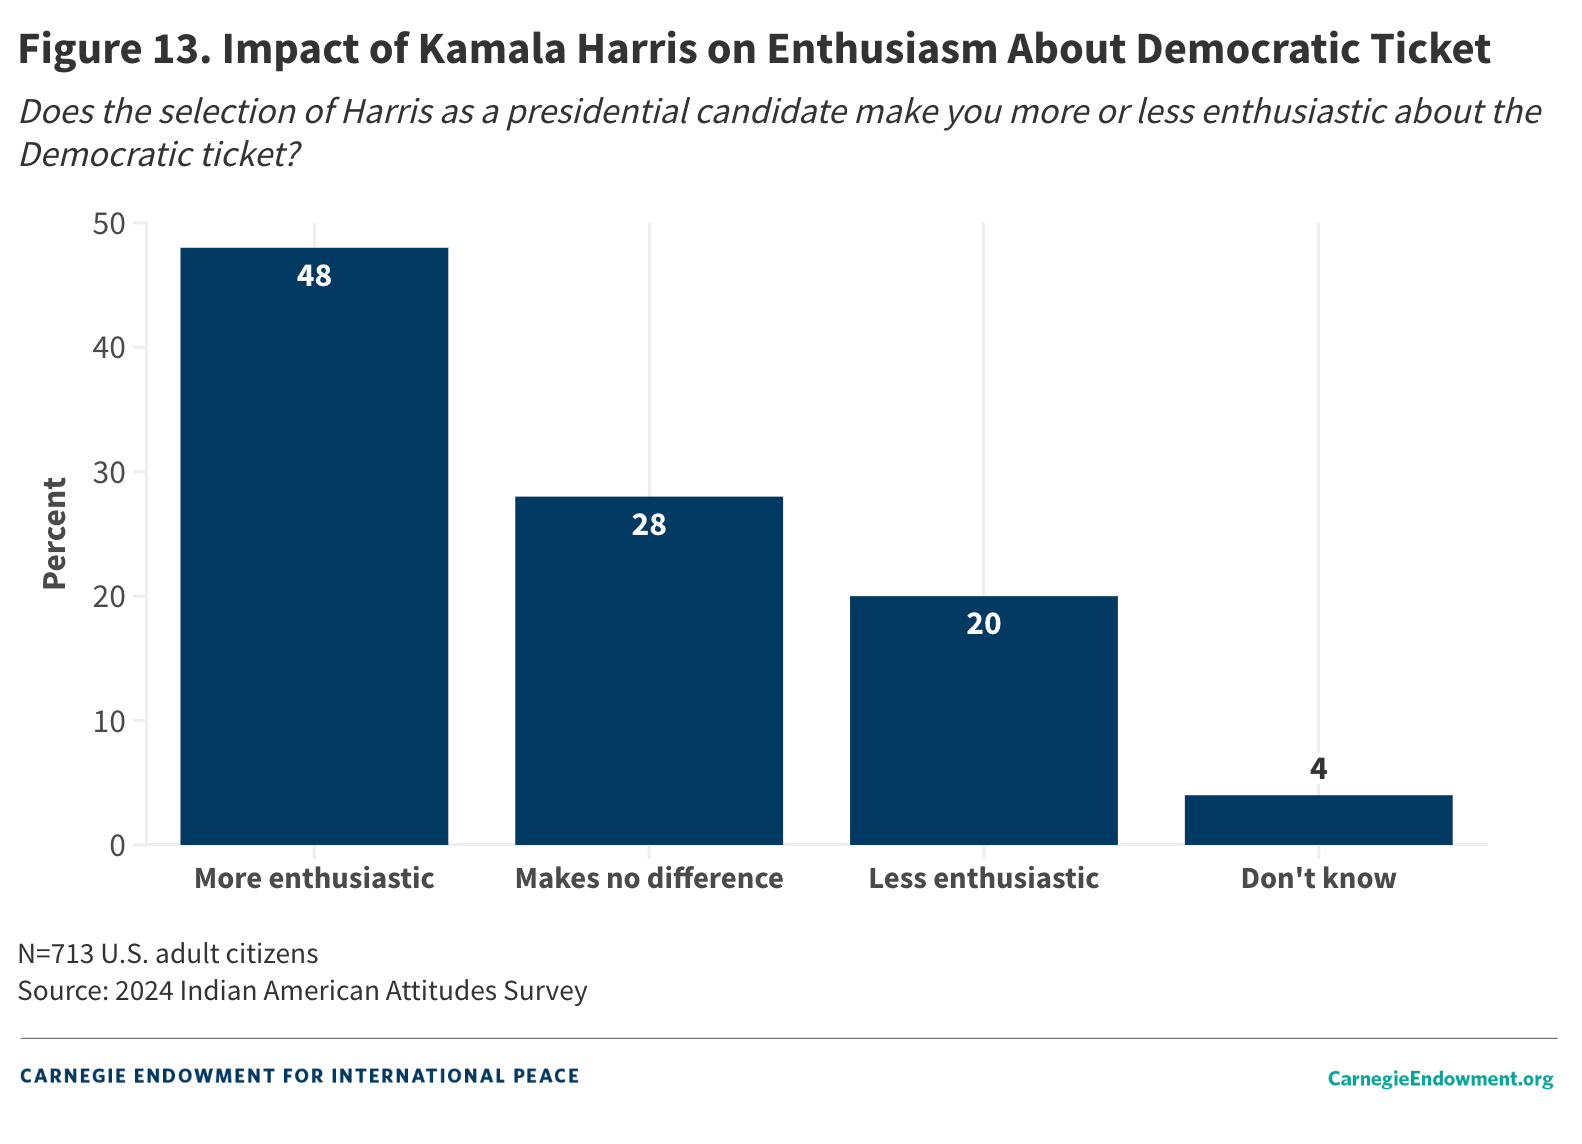
Of course, voters could be mobilized in a positive or negative direction, depending on their views of Harris. The survey follows up by asking respondents whether Harris’s nomination makes them more or less enthusiastic about the Democratic ticket (see figure 13). Consistent with the responses to this question in the 2020 IAAS, 48 percent of respondents report that her nomination made them more enthusiastic about the Democratic ticket. One in five respondents (20 percent) report that her addition made them less enthusiastic about the Democratic ticket, and 28 percent claim it had no effect either way. Four percent do not know.
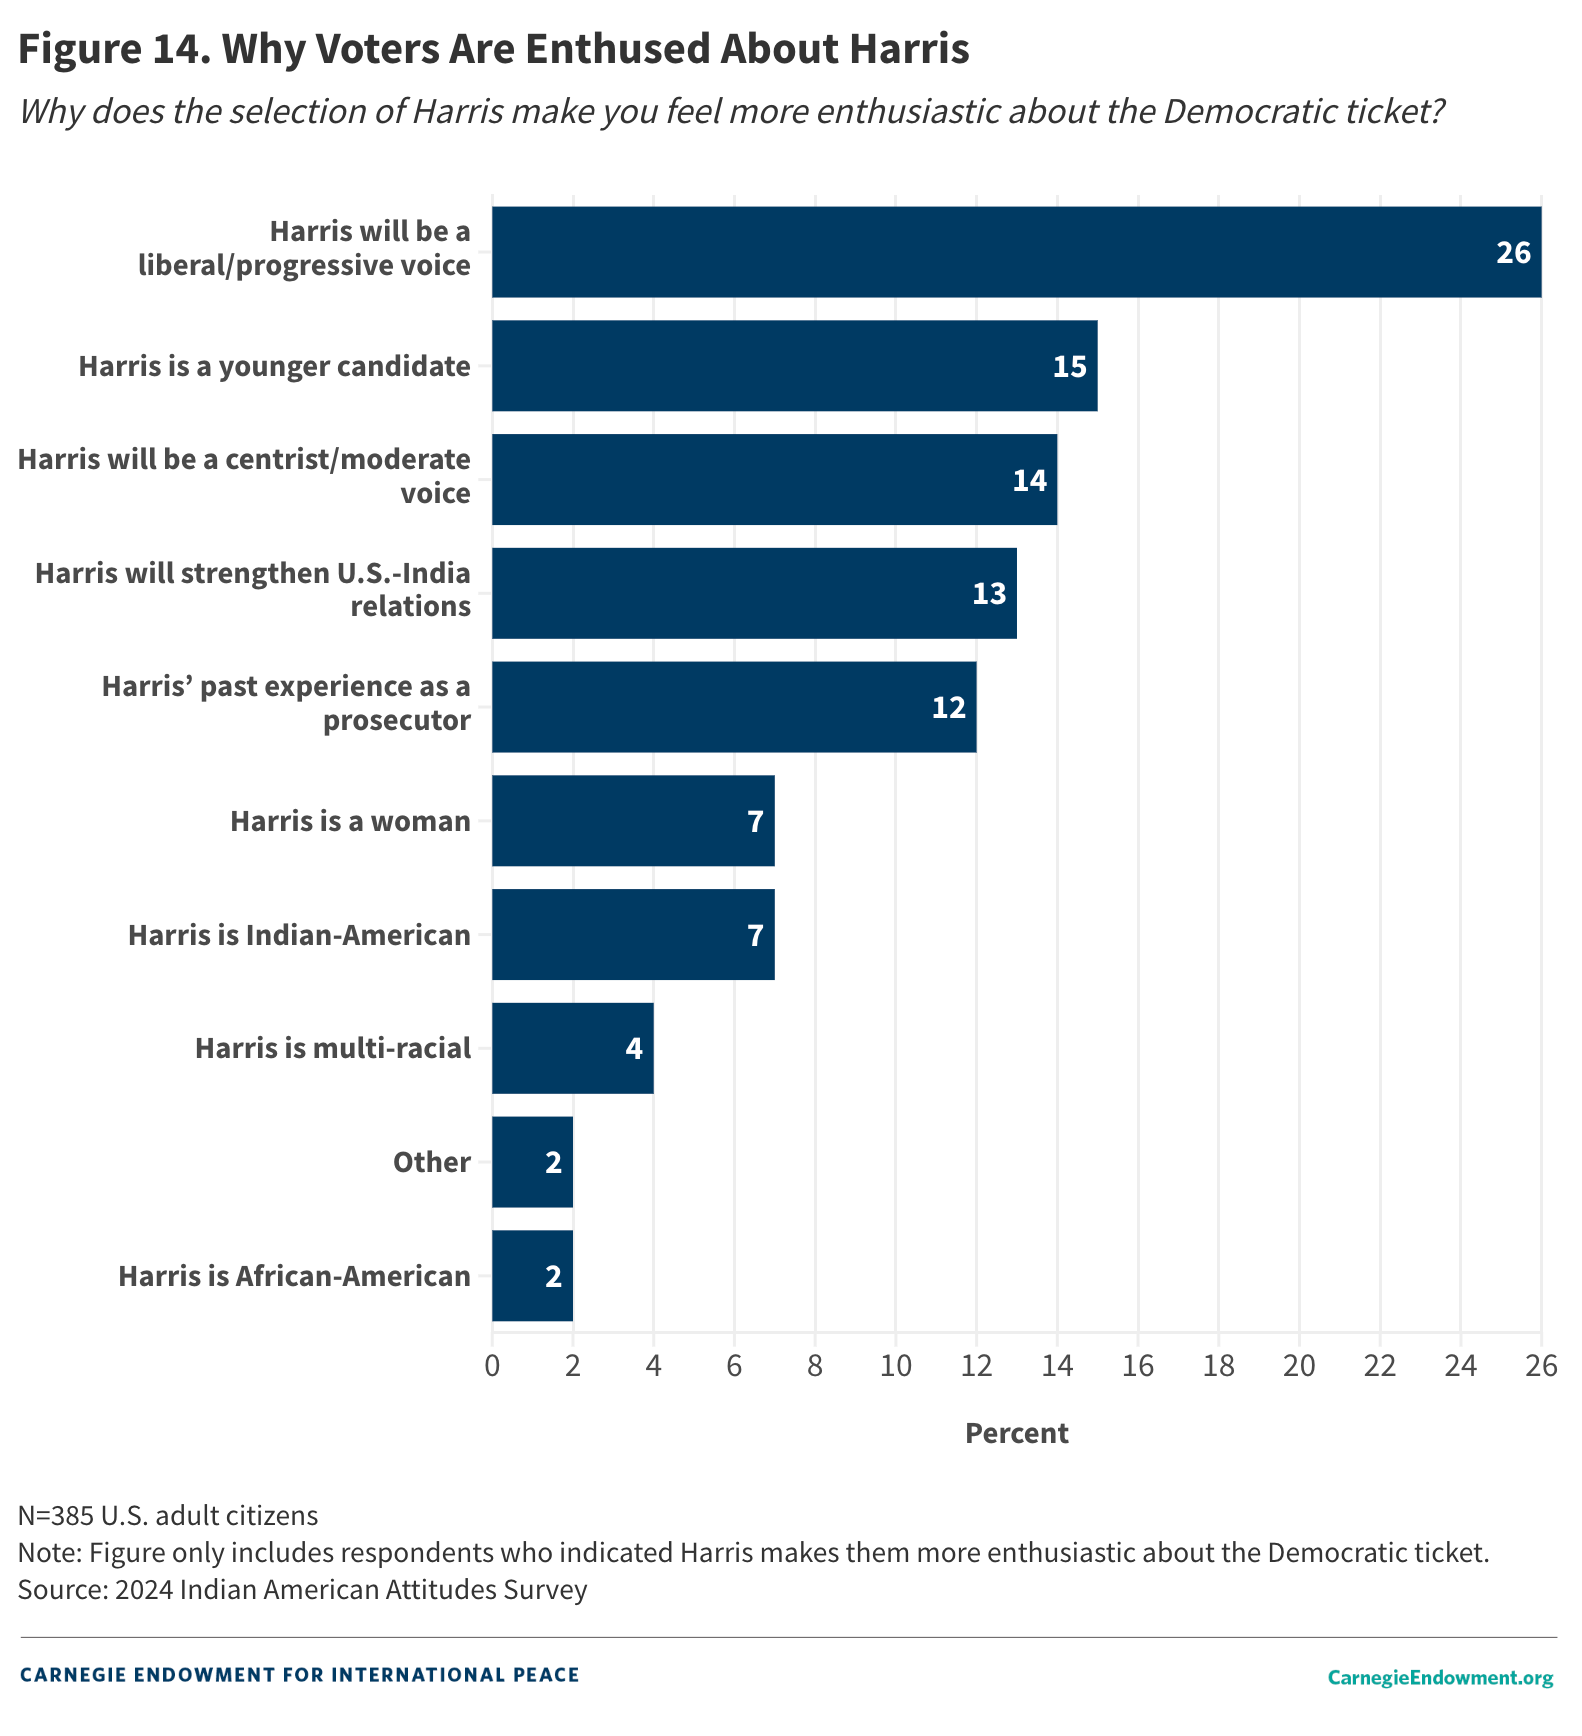
For those who responded that the Harris selection made them more enthusiastic about the Democratic ticket, the survey asks why. Respondents could choose one of nine options or simply select “other” if none of the listed item captured their view (see figure 14). The modal option—the idea that Harris will govern as a liberal/progressive—was selected by 26 percent of respondents. The next-most-popular reason is that Harris is younger than both Biden and Trump (15 percent), followed by the perception that Harris will govern as a centrist/moderate (14 percent). Notably, only 7 percent of respondents report that Harris’s Indian American heritage is the reason that best captures their increased enthusiasm.
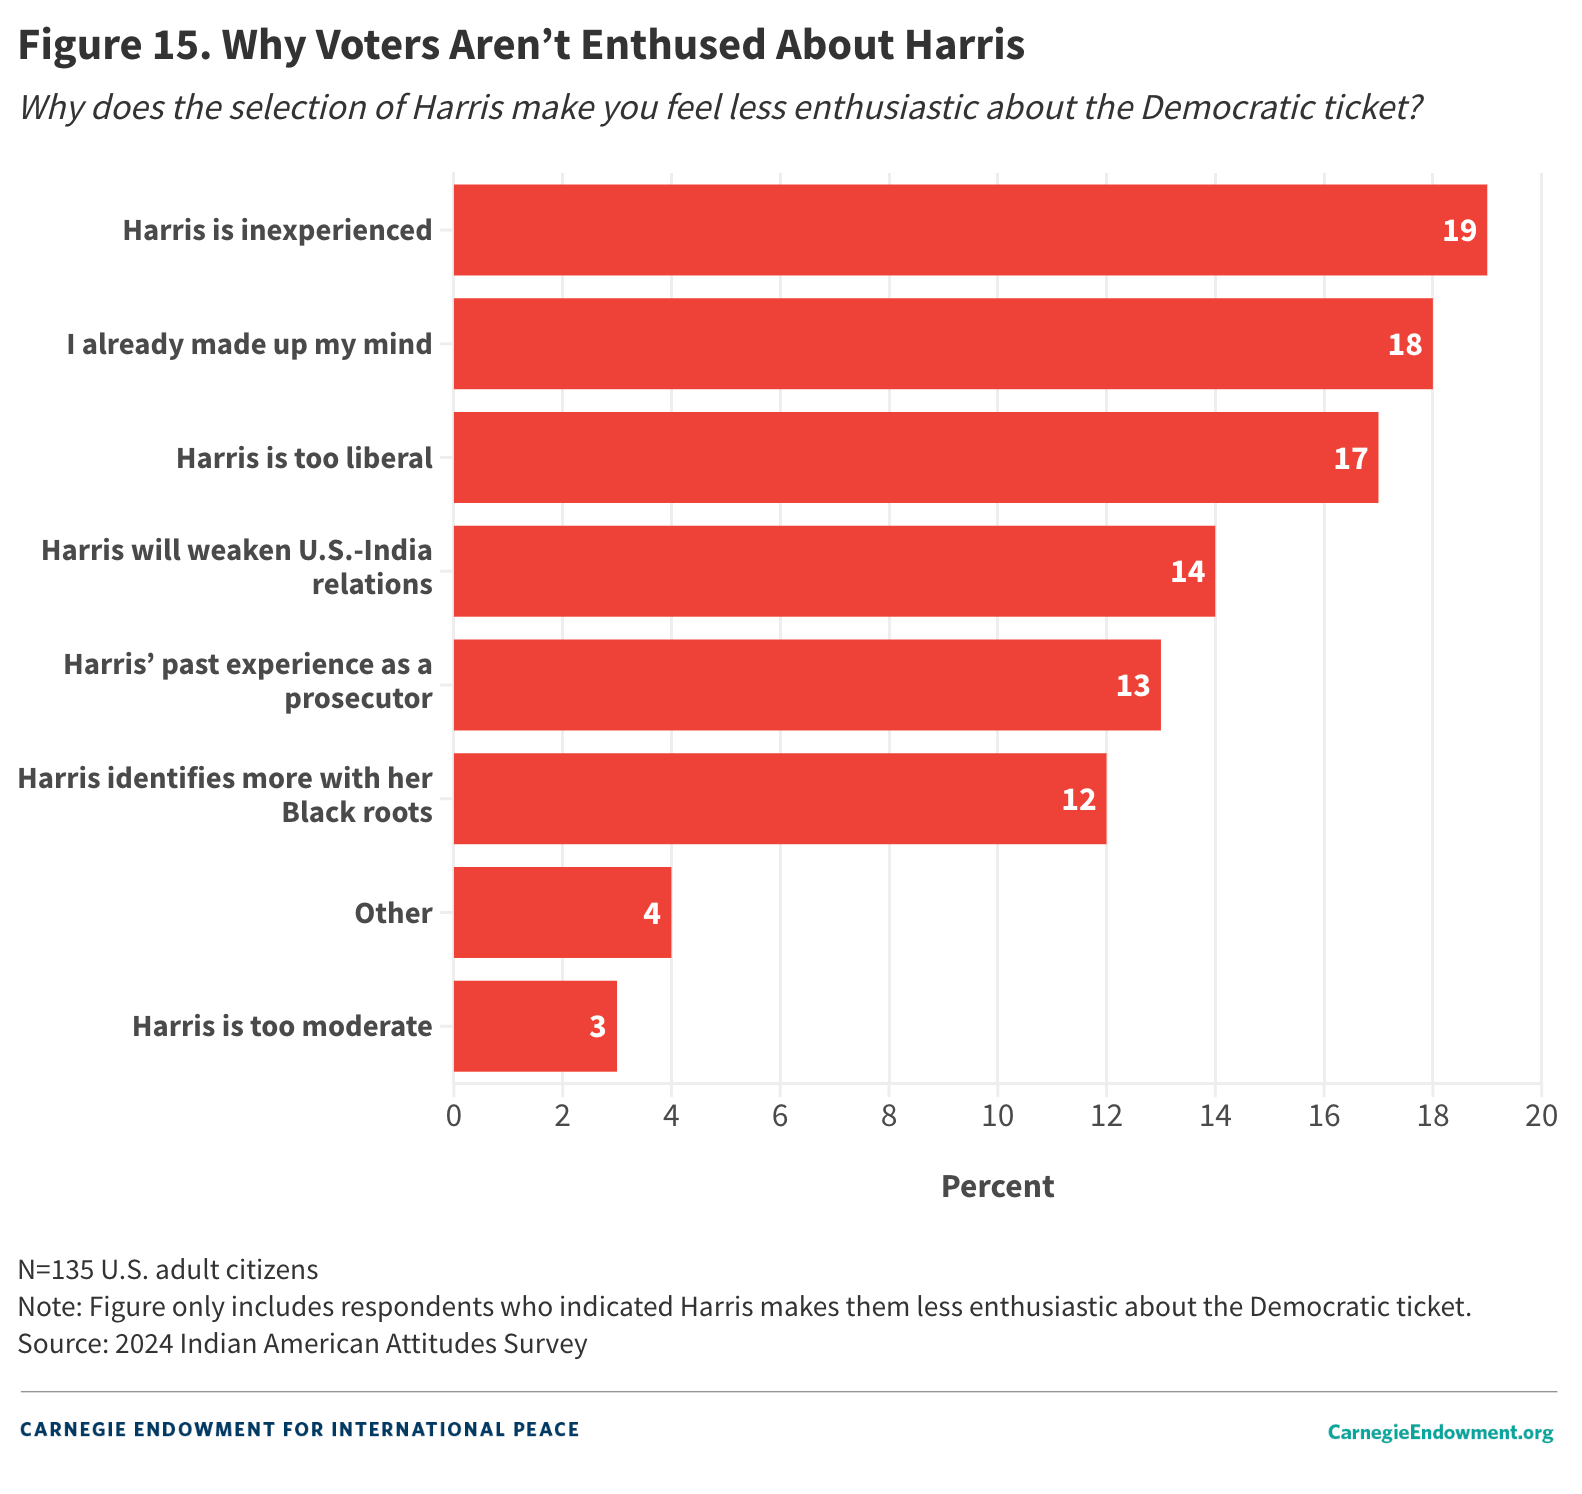
Finally, the survey also investigates the reasons why Harris’s nomination has made some respondents less enthusiastic about the Democratic ticket (see figure 15). The foremost reasons respondents report are that Harris is too inexperienced (19 percent), that they have already made their mind up (18 percent), and that Harris is too liberal (17 percent).
Shared Ethnicity or Shared Policy Views?
The fact that Indian Americans have rallied behind Kamala Harris raises the question of what might have happened if the Republican Party had also nominated a person of Indian heritage. After all, two candidates of Indian origin—former South Carolina governor Nikki Haley and entrepreneur Vivek Ramaswamy—contested the Republican primary. Haley finished a distant second to Trump, winning just two primaries. She eventually withdrew from the race in March 2024, two months after Ramaswamy suspended his campaign.
When Haley campaigned for the Republican presidential nomination, media outlets reported mixed feelings among many Indian Americans. Haley boasted prominent Indian American donors and generated interest from numerous diaspora groups, but some in the community felt that Haley expressed little interest in cultivating the Indian American vote. Ramaswamy evoked a similar reaction; although he did not necessarily shy away from his Indian heritage, he steadfastly resisted the “Indian American” label, stating: “I’m an American first.”
Some extant research suggests that Indian Americans are especially motivated to vote for co-ethnic candidates on the ballot. The question at play is whether Indian Americans’ desire to vote for fellow Indian Americans negates their partisan inclinations—or whether shared ethnicity eclipses shared values or ideologies. It is worth noting, in this context, that both of Haley’s parents immigrated from India, while Harris’s Indian ancestry is through her maternal side—a distinction that has sometimes been weaponized for political purposes.
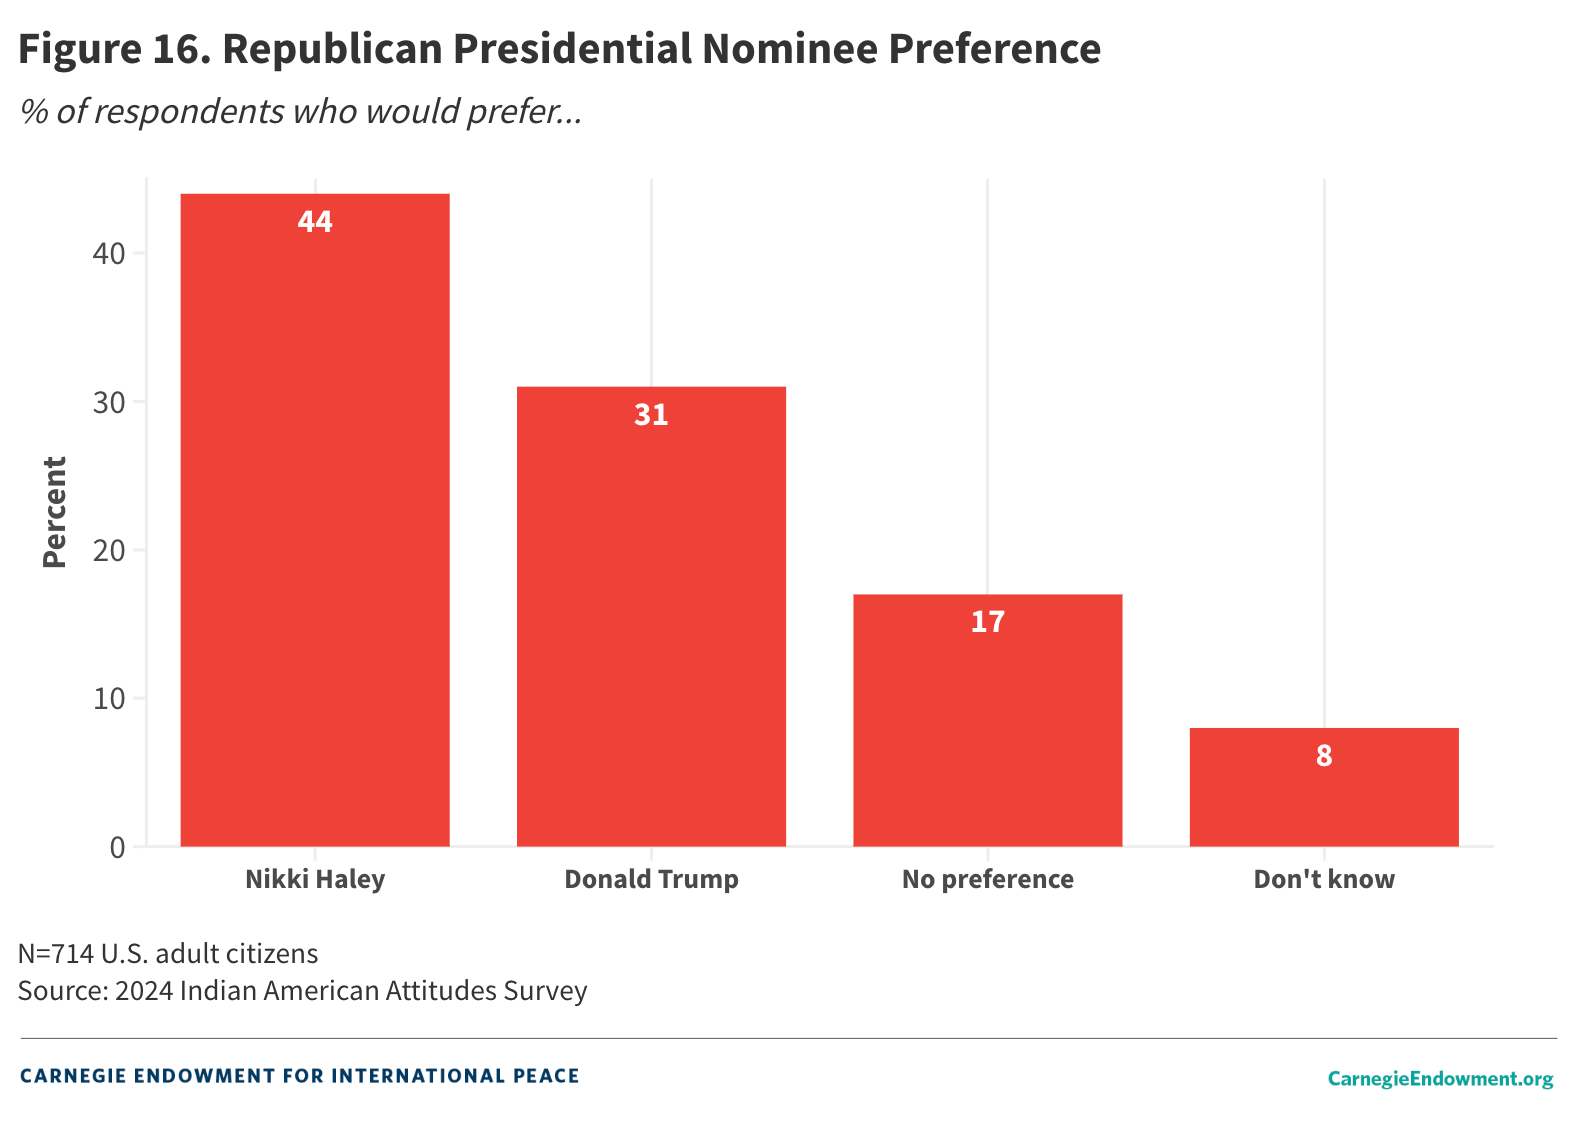
To explore this terrain, the survey first asks respondents whether they would prefer Trump or Haley as the Republican presidential nominee (see figure 16). A plurality of all respondents (44 percent) would prefer to see Haley as the Republican nominee compared to Trump (31 percent). An additional 17 percent have no preference. However, this result is driven largely by Democratic as opposed to Republican respondents; the latter overwhelmingly prefer Trump. Independents are divided, with 35 percent preferring Haley, 34 percent expressing no preference, and 23 percent favoring Trump.
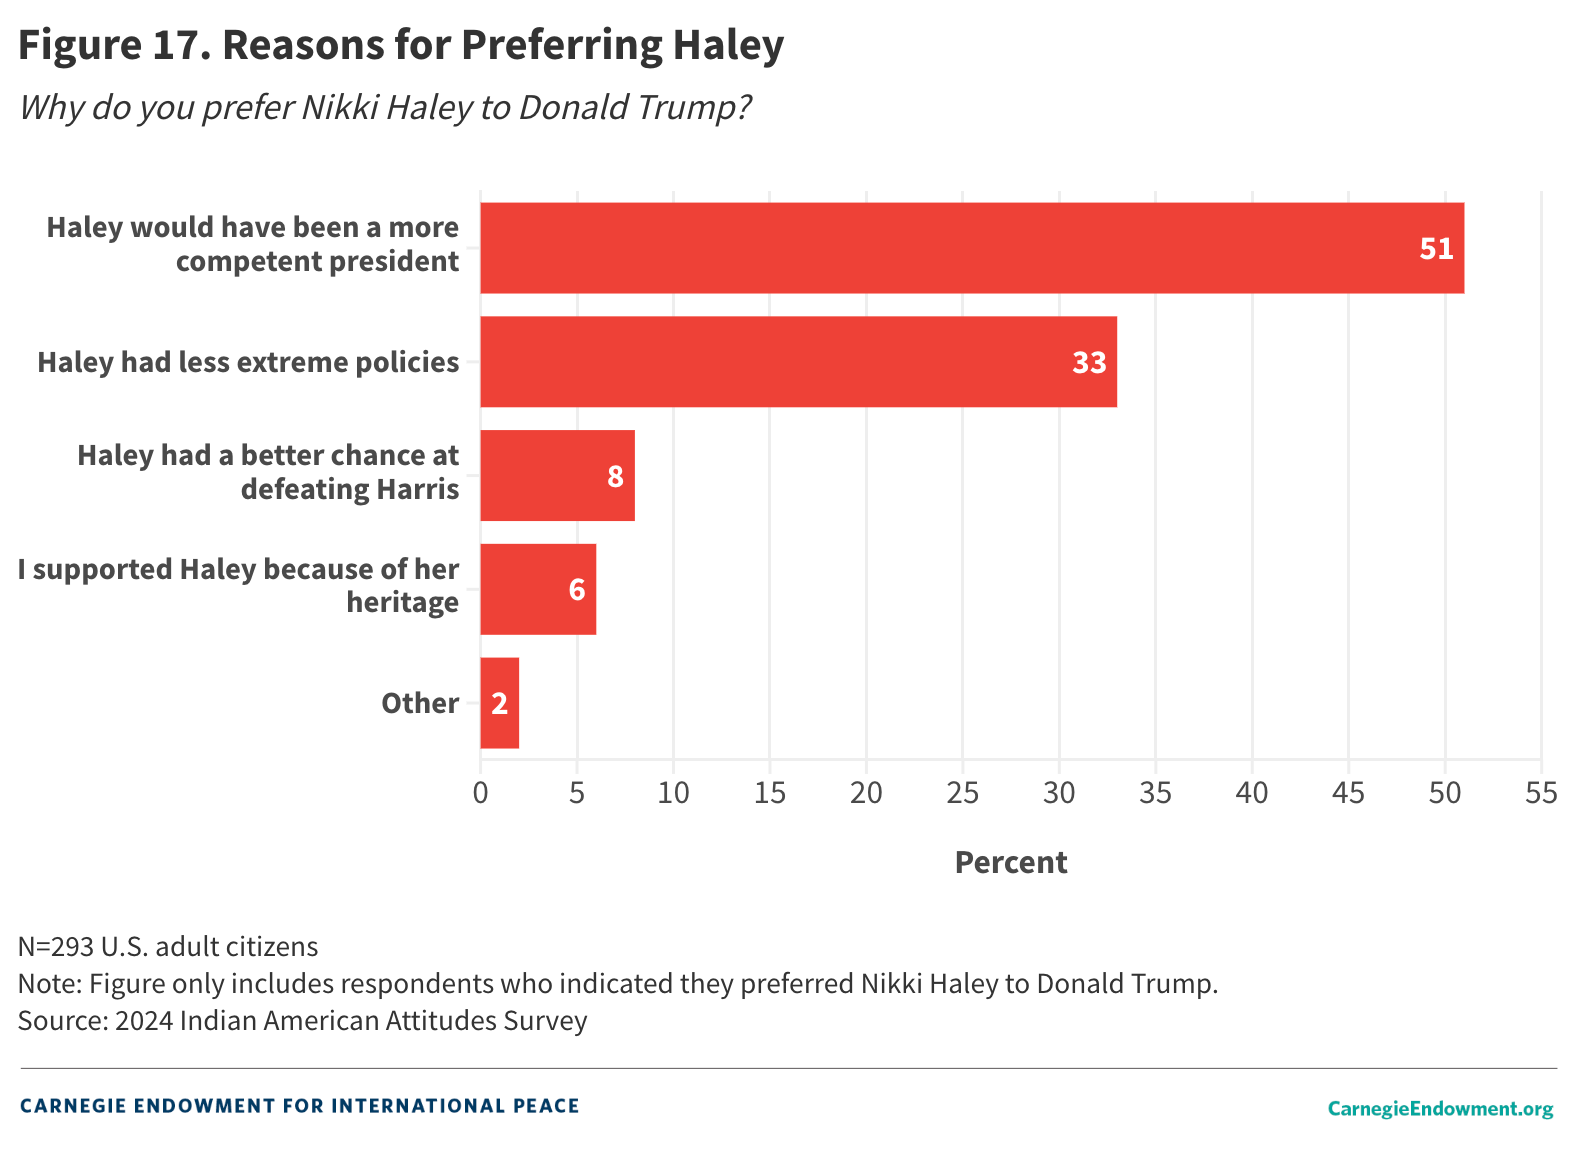
For respondents who favor Haley over Trump, the survey asks why (see figure 17). One in two respondents (51 percent) report that they support Haley over Trump because she would have been a more competent president, and 33 percent report that Haley was less extreme than Trump on policy issues. Only 8 percent report that Haley had a better chance at defeating Harris in the general election, while 6 percent support her because of her Indian heritage.
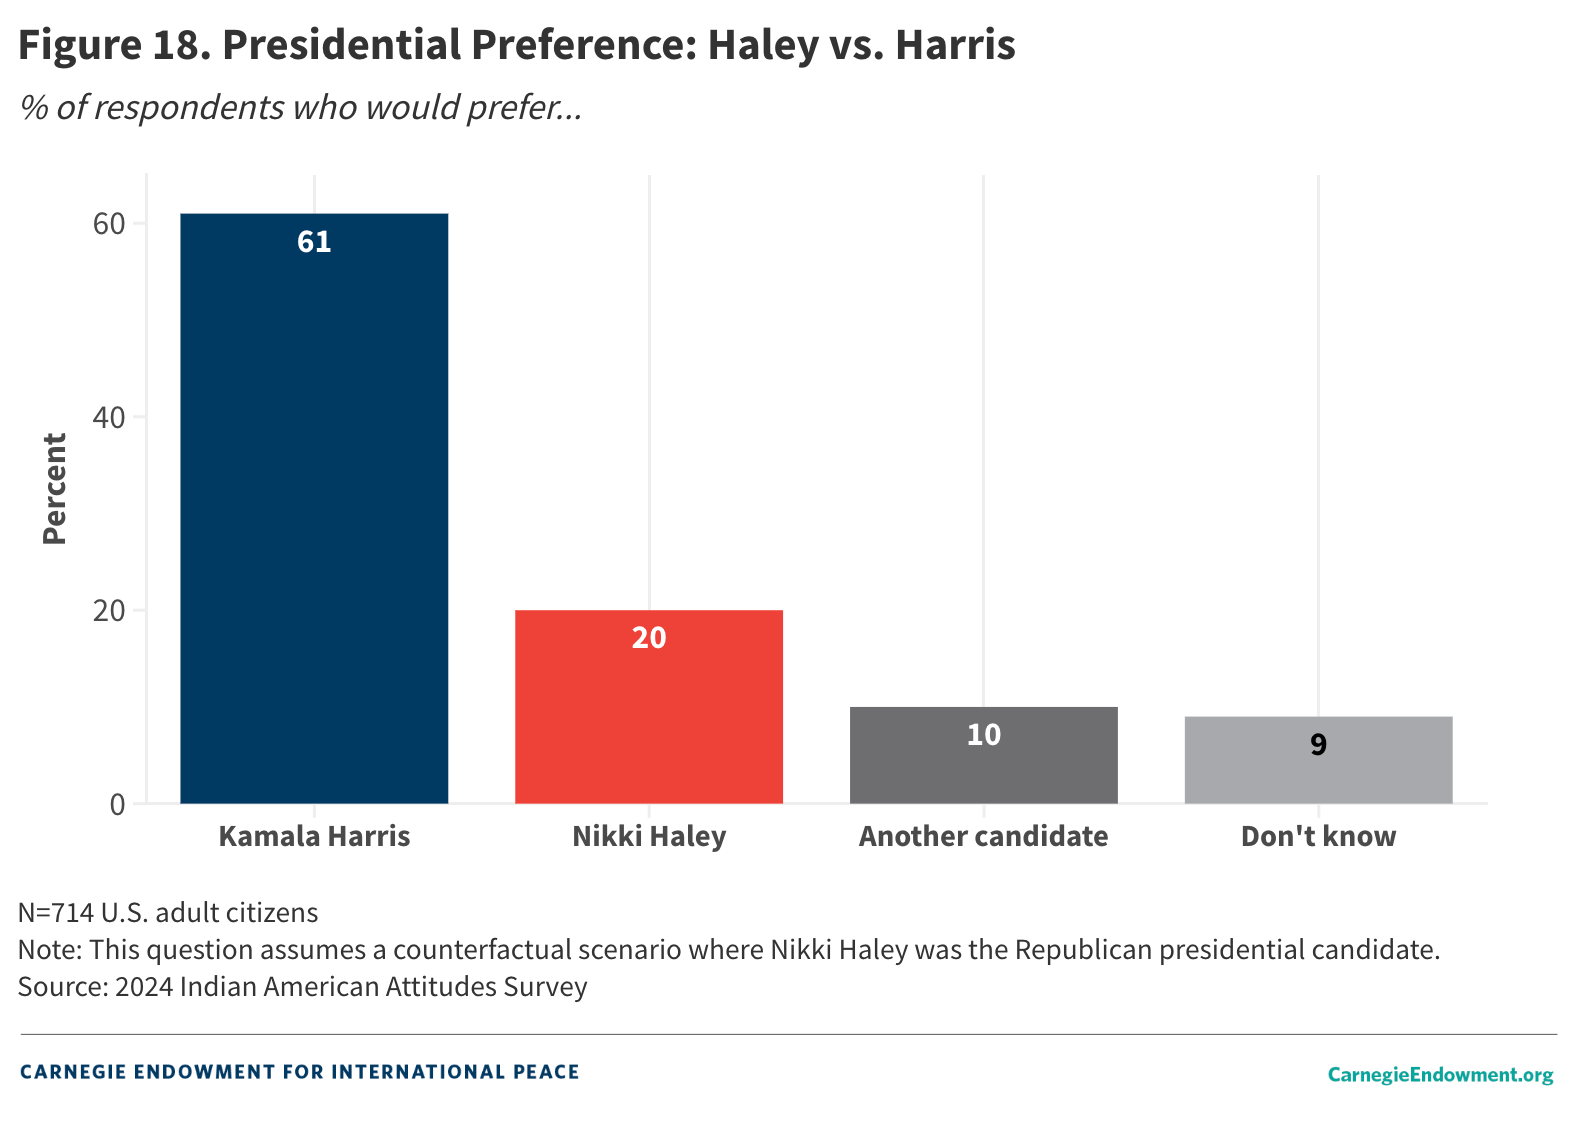
Finally, the survey asks respondents who they would support if November’s presidential race was between two Indian-origin candidates, Nikki Haley and Kamala Harris (figure 18). Sixty-one percent report they favor Harris, while 20 percent report favoring Haley in a head-to-head matchup. Ten percent say they would favor another candidate. Interestingly, the share of respondents voting for Harris does not change as her opponent hypothetically changes from Trump to Haley. Of course, Haley has not been campaigning in a general election setting, so it is entirely possible these numbers could shift if voters were more exposed to her.
Views on Policy
This section details the policy preferences of Indian Americans. It begins by examining the issues that matter most for respondents in advance of the November election. Next, it reviews how respondents approach a hypothetical scenario in which they are given money to contribute to charitable causes, revealing which issues Indian Americans feel most strongly in favor of (or opposed to). The final section examines the reasons underpinning respondents’ partisan preferences.
Animating Policy Issues
The survey asks respondents to rank their top three most-important issues that will influence their vote choice in the November presidential election. Figure 19 focuses on the issues that respondents ranked as their topmost issue this election year. Economic issues loom large for Indian American respondents. Seventeen percent report inflation/prices as their topmost issue, and 13 percent state jobs and the economy as their principal concern. Thirteen percent also cite abortion as their most important election issue, followed by immigration (10 percent) and healthcare (9 percent). In the 2020 IAAS, respondents were most animated by the economy (21 percent) and healthcare (20 percent), two issues triggered by the coronavirus pandemic.
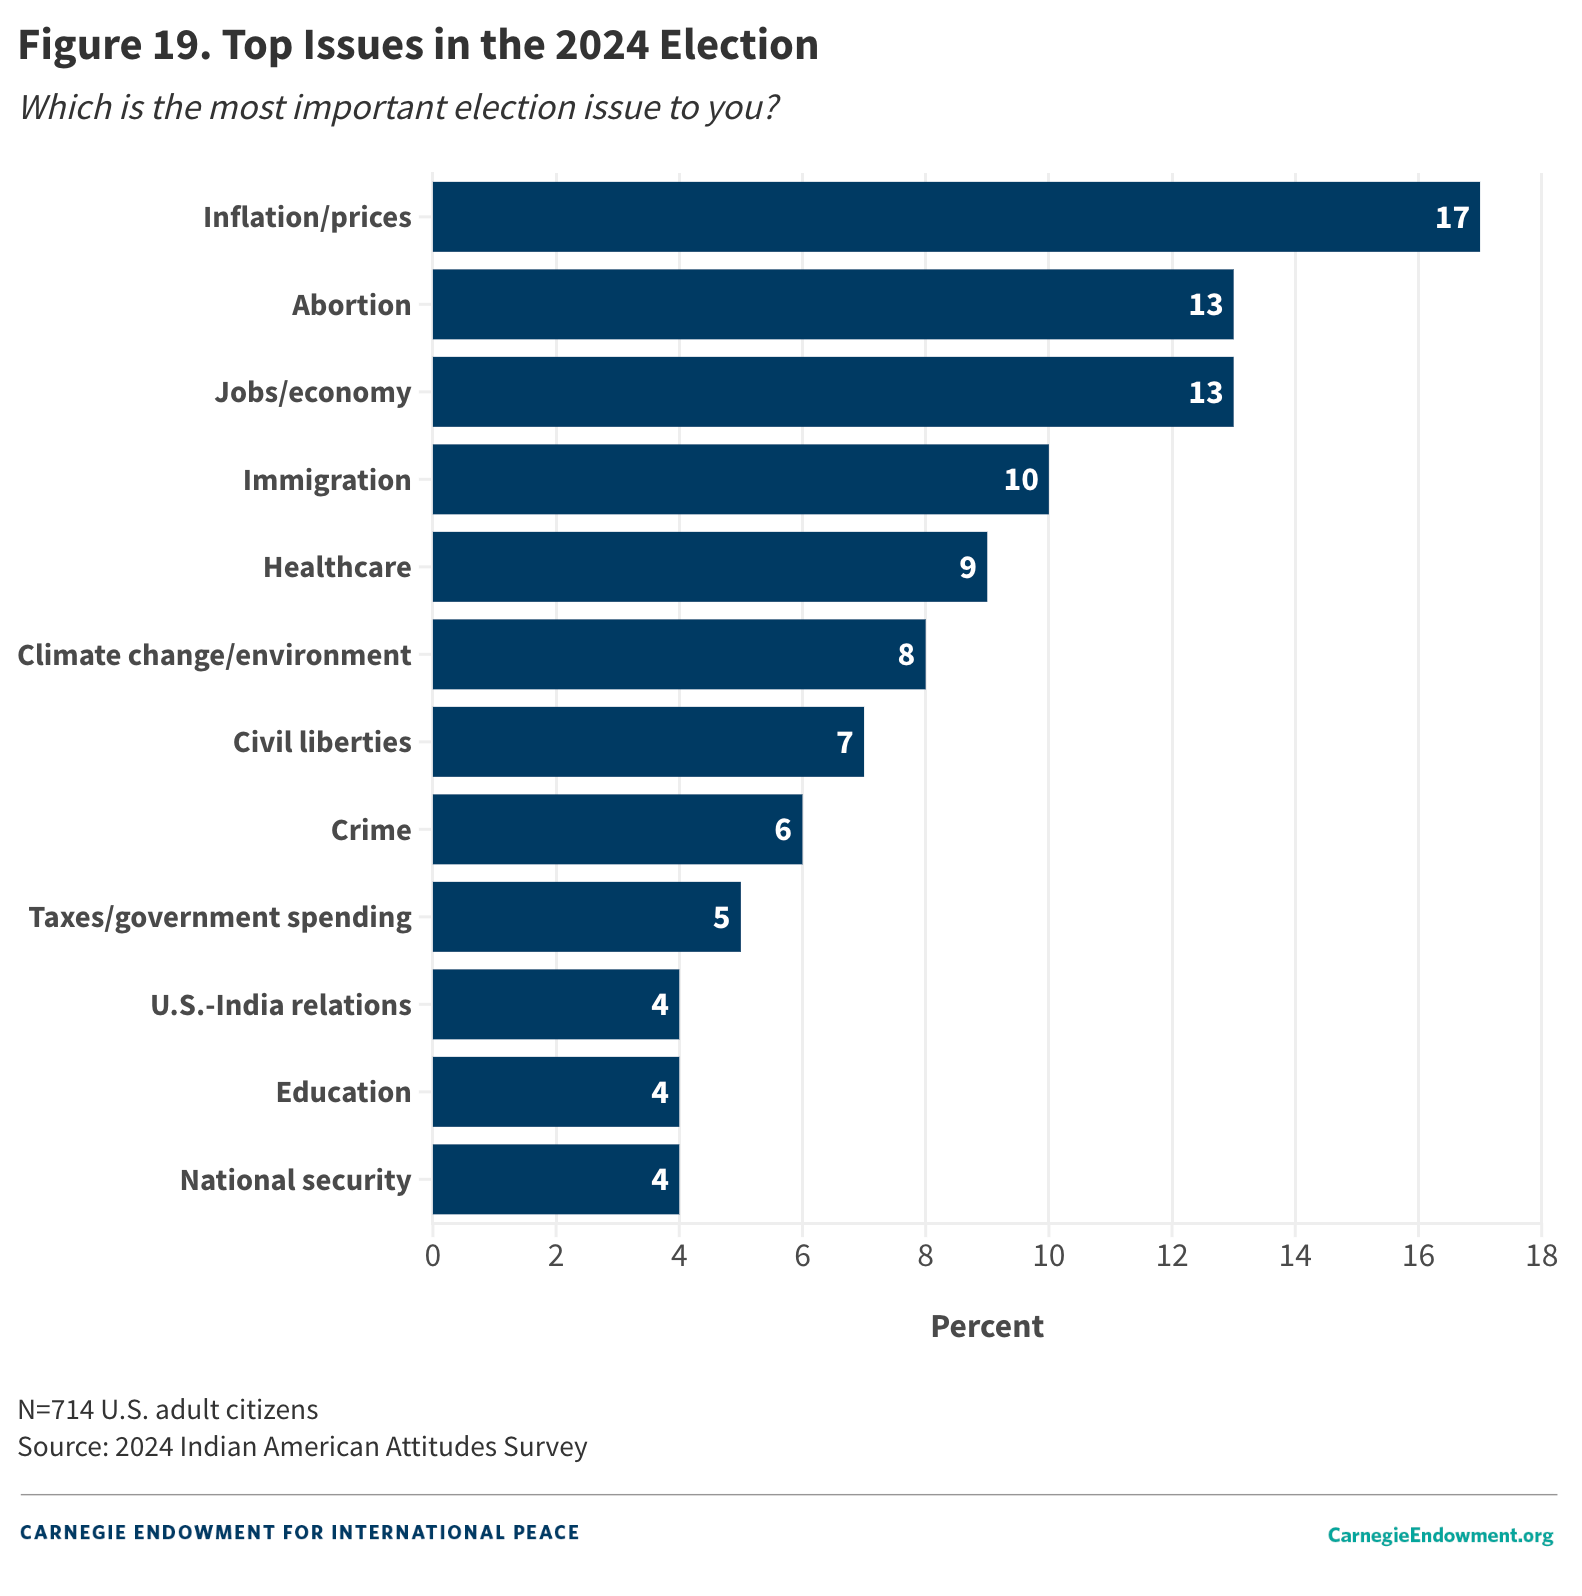
There is discernible partisan variation on this measure, with Democratic and Republican respondents emphasizing different priorities. For starters, Republican respondents are much more concerned by the state of the economy. Taken together, 37 percent name inflation/prices and jobs and the economy as their top issue, compared to 24 percent of Democrats. Democrats, in turn, are very motivated by abortion—selected as the top issue by 19 percent of them compared to 5 percent of Republicans. Twelve percent of Democrats also name climate change and the environment as a top-tier issue, while only 2 percent of Republicans do the same. Interestingly, Republicans are more concerned by foreign policy, with a greater share naming U.S.-India relations (9 percent) and national security (5 percent) as their most-important issue.
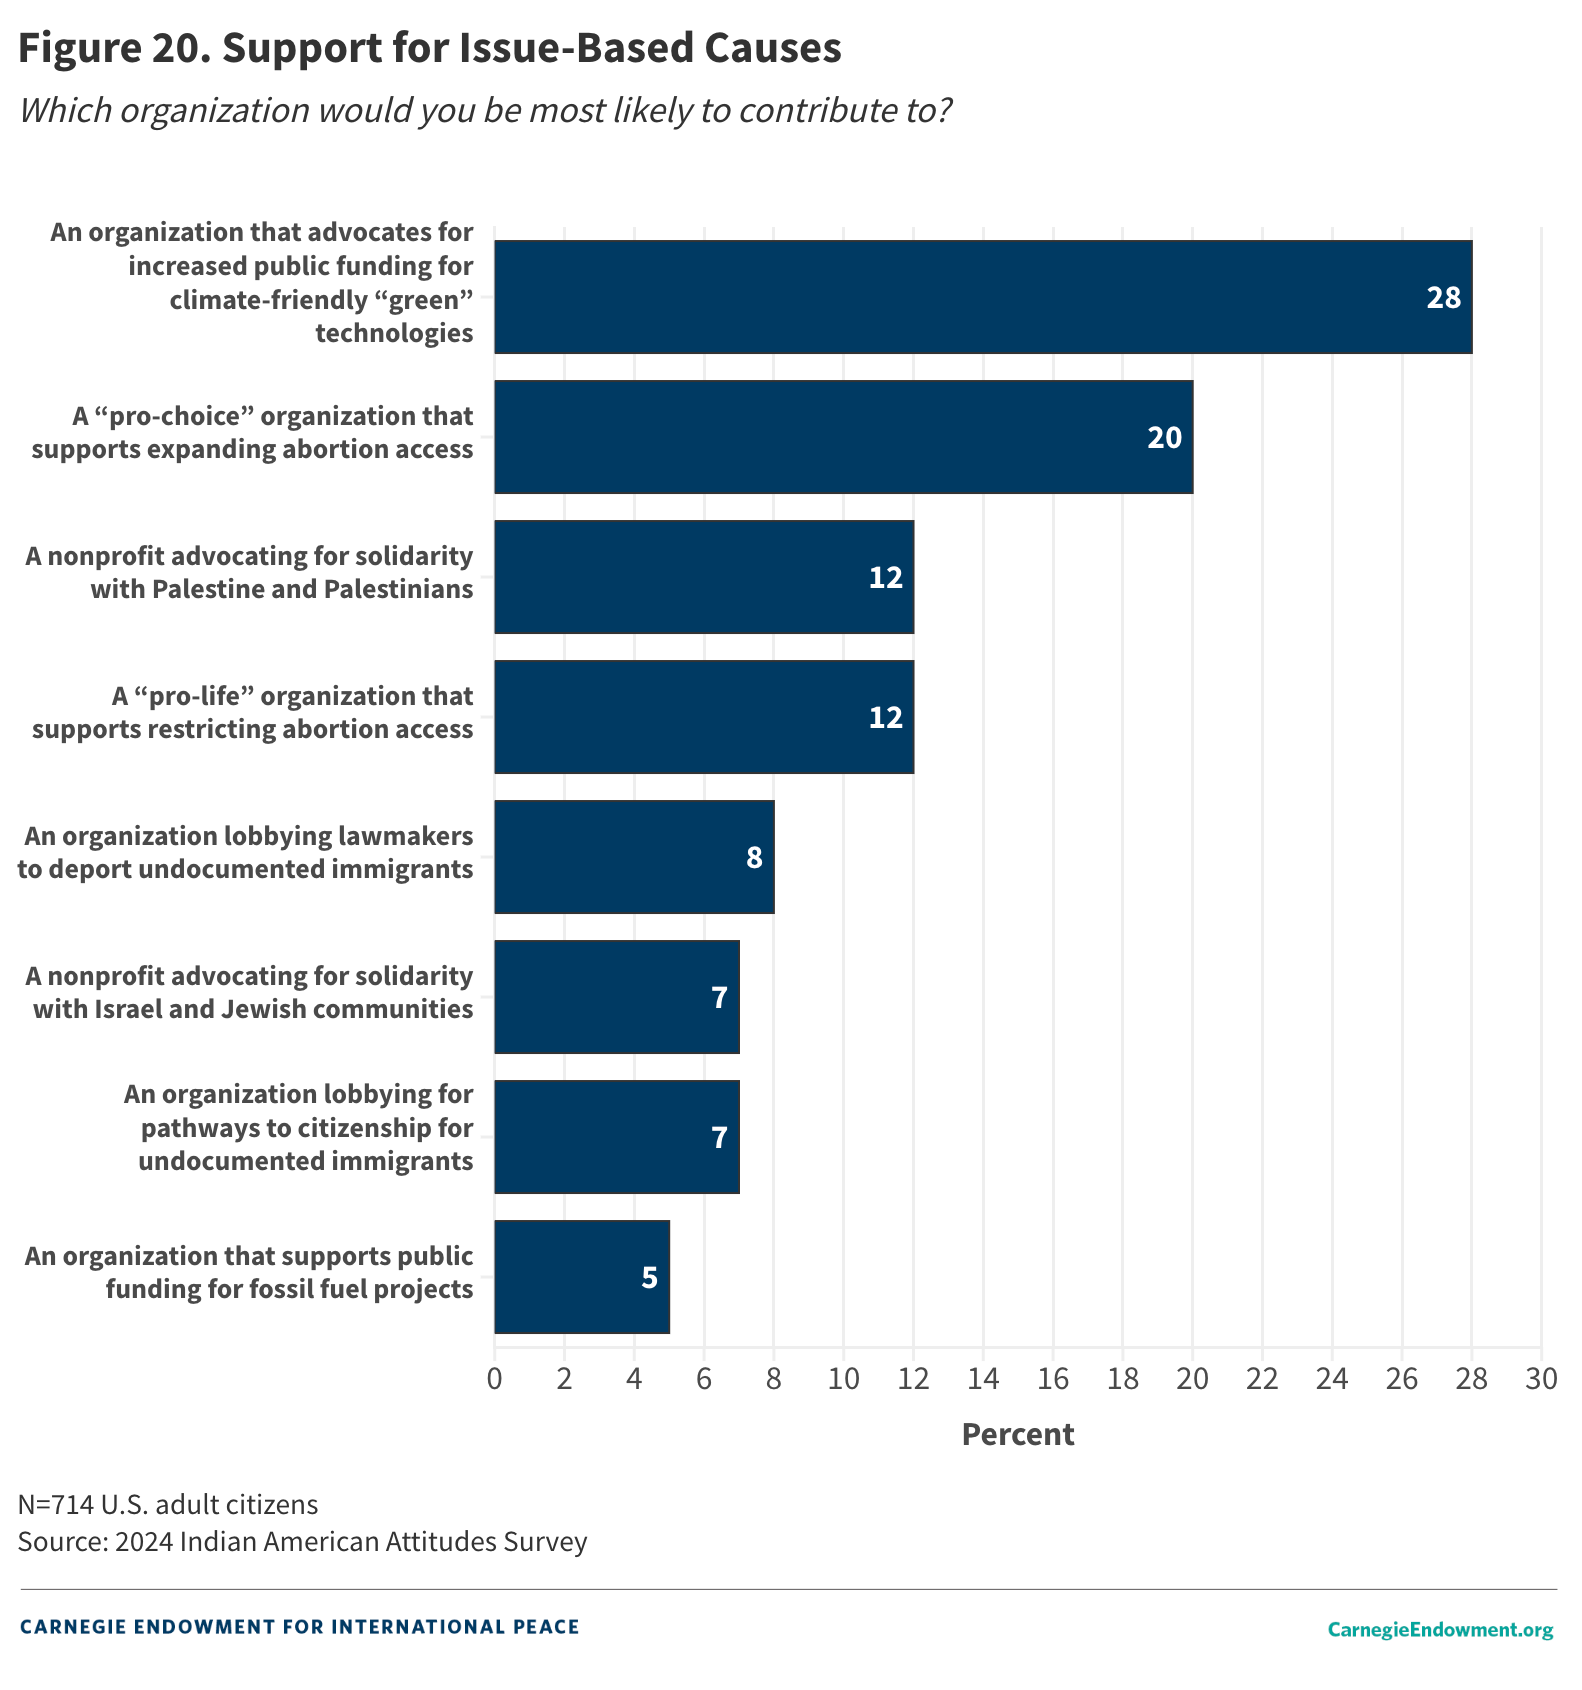
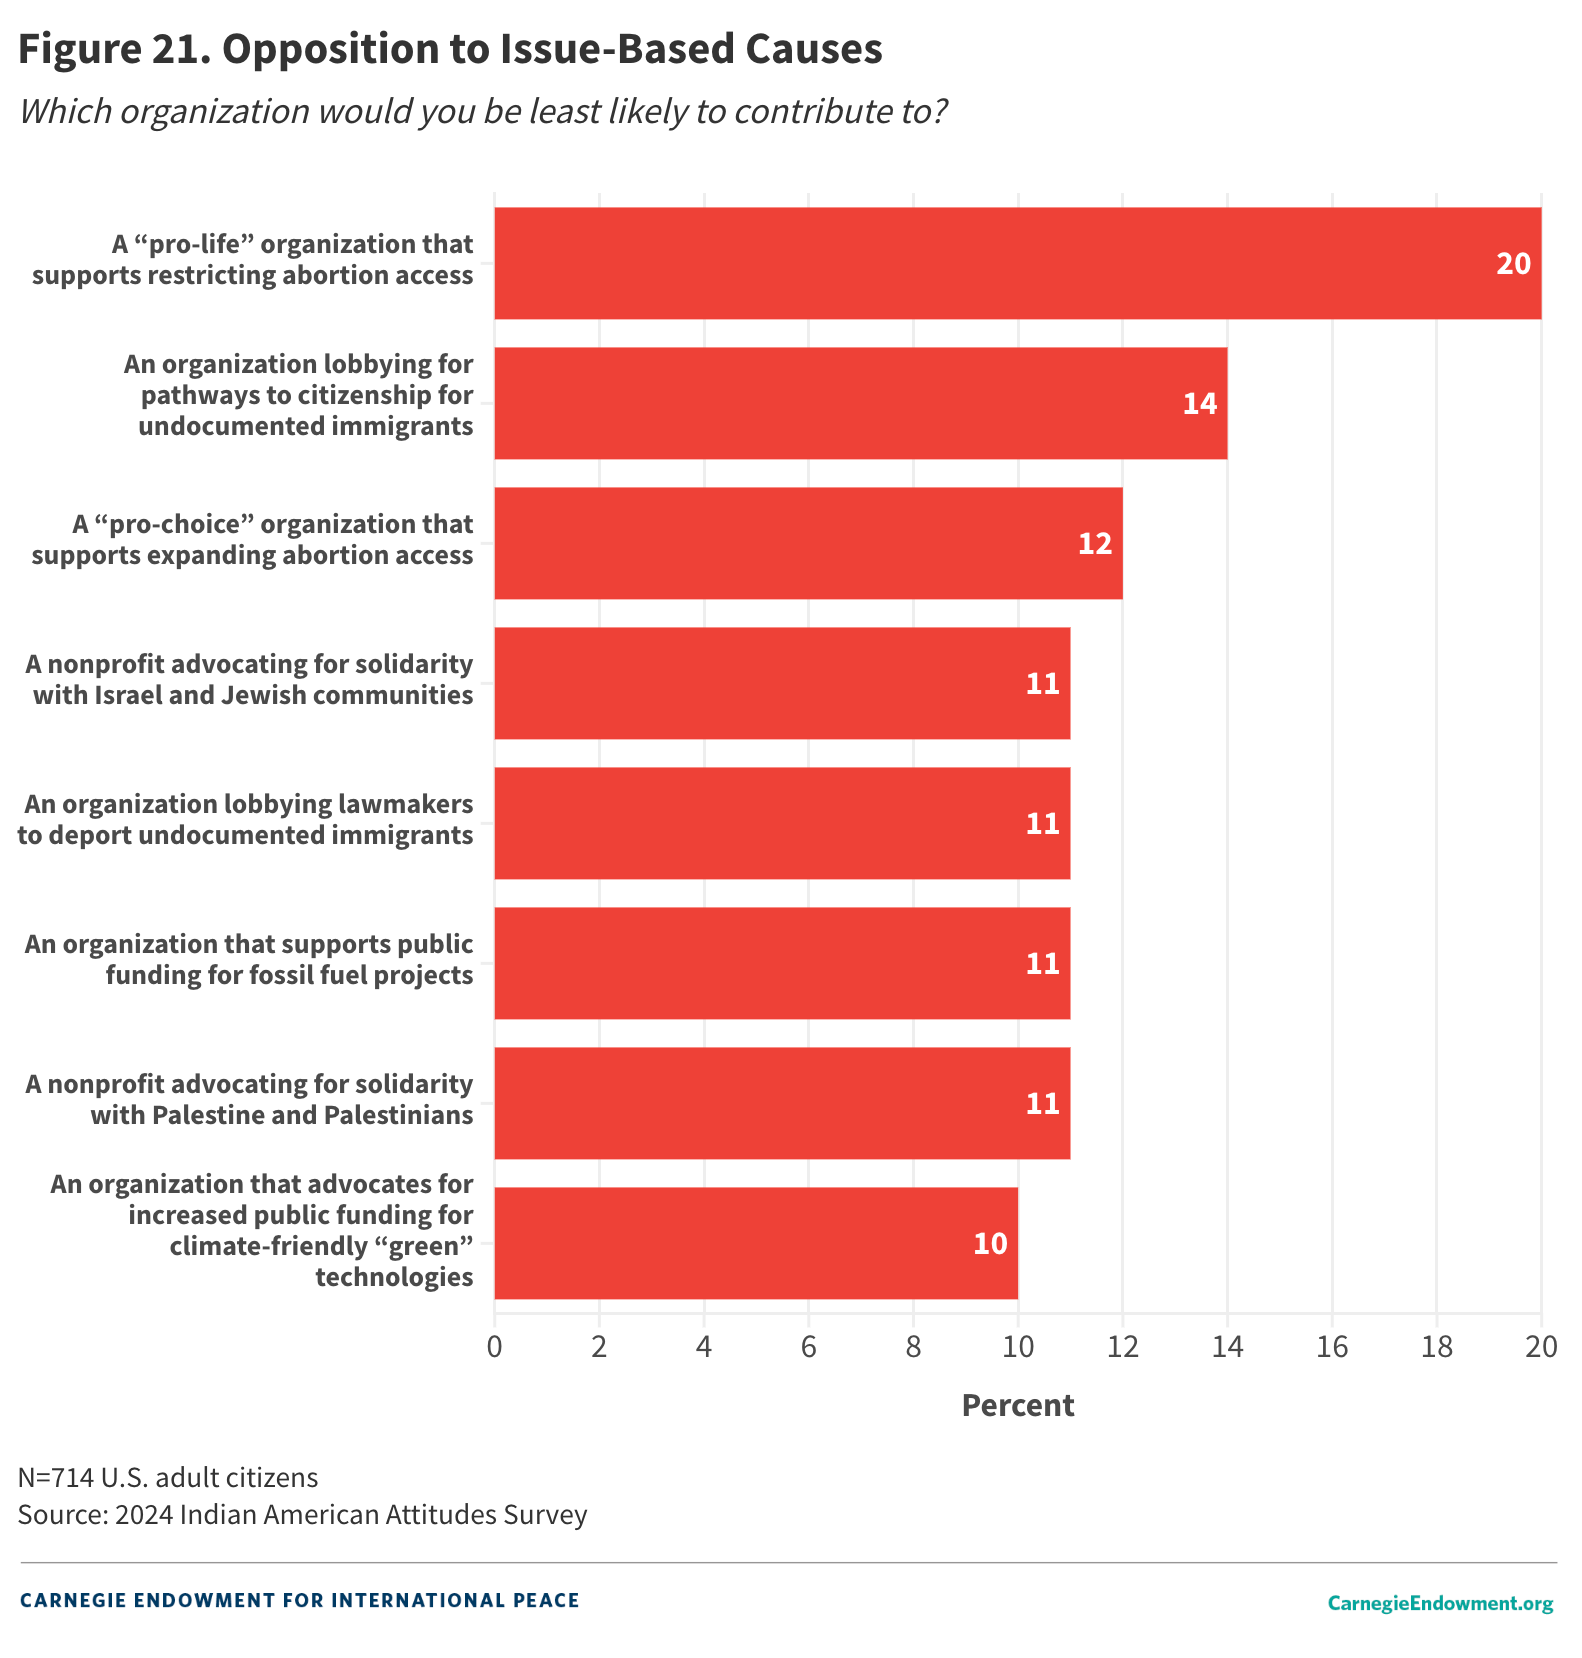
The survey also utilizes a second method for identifying the issues Indian Americans are especially concerned about. The survey provides respondents with a hypothetical scenario in which they have $500 to contribute to a charity. After providing respondents with a list of charities, respondents are asked which they would be most likely to contribute to. In a separate question later in the survey, they are asked which they would be least likely to contribute to. The choices are grouped into four issue sets chosen by the authors: abortion, climate change, Israel/Palestine, and immigration.
Within each set, respondents were presented with contrasting options. For instance, respondents could select a “pro-choice” organization that supports expanding abortion access or a “pro-life” organization that supports restricting abortion access. Or when it comes to immigration, respondents could contribute to an organization lobbying lawmakers to provide a pathway to citizenship for undocumented immigrants or one that lobbies lawmakers to deport undocumented immigrants.
Figure 20 examines respondents’ answers to the positive scenario, or the organization they would be most likely to contribute to. The most popular response is an organization that advocates for increased public funding for climate-friendly, green technologies, an option selected by 28 percent of respondents. The next-most-popular response, chosen by 20 percent of respondents, is a “pro-choice” organization that supports expanding abortion access. These responses follow directly from the previous one on animating policy issues, especially given that Democrats significantly outnumber Republicans in the sample.
In contrast, figure 21 contains responses to the negative scenario, or which organization respondents would be least likely to contribute to. Twenty percent, by far the most popular response, was a “pro-life” organization that supports restricting abortion access. The remaining options have smaller and similar proportions.
Explaining Partisan Preferences
As previously discussed, Indian Americans’ orientations toward the Democratic Party is not new. However, the reasons behind this affinity remain underexplored.
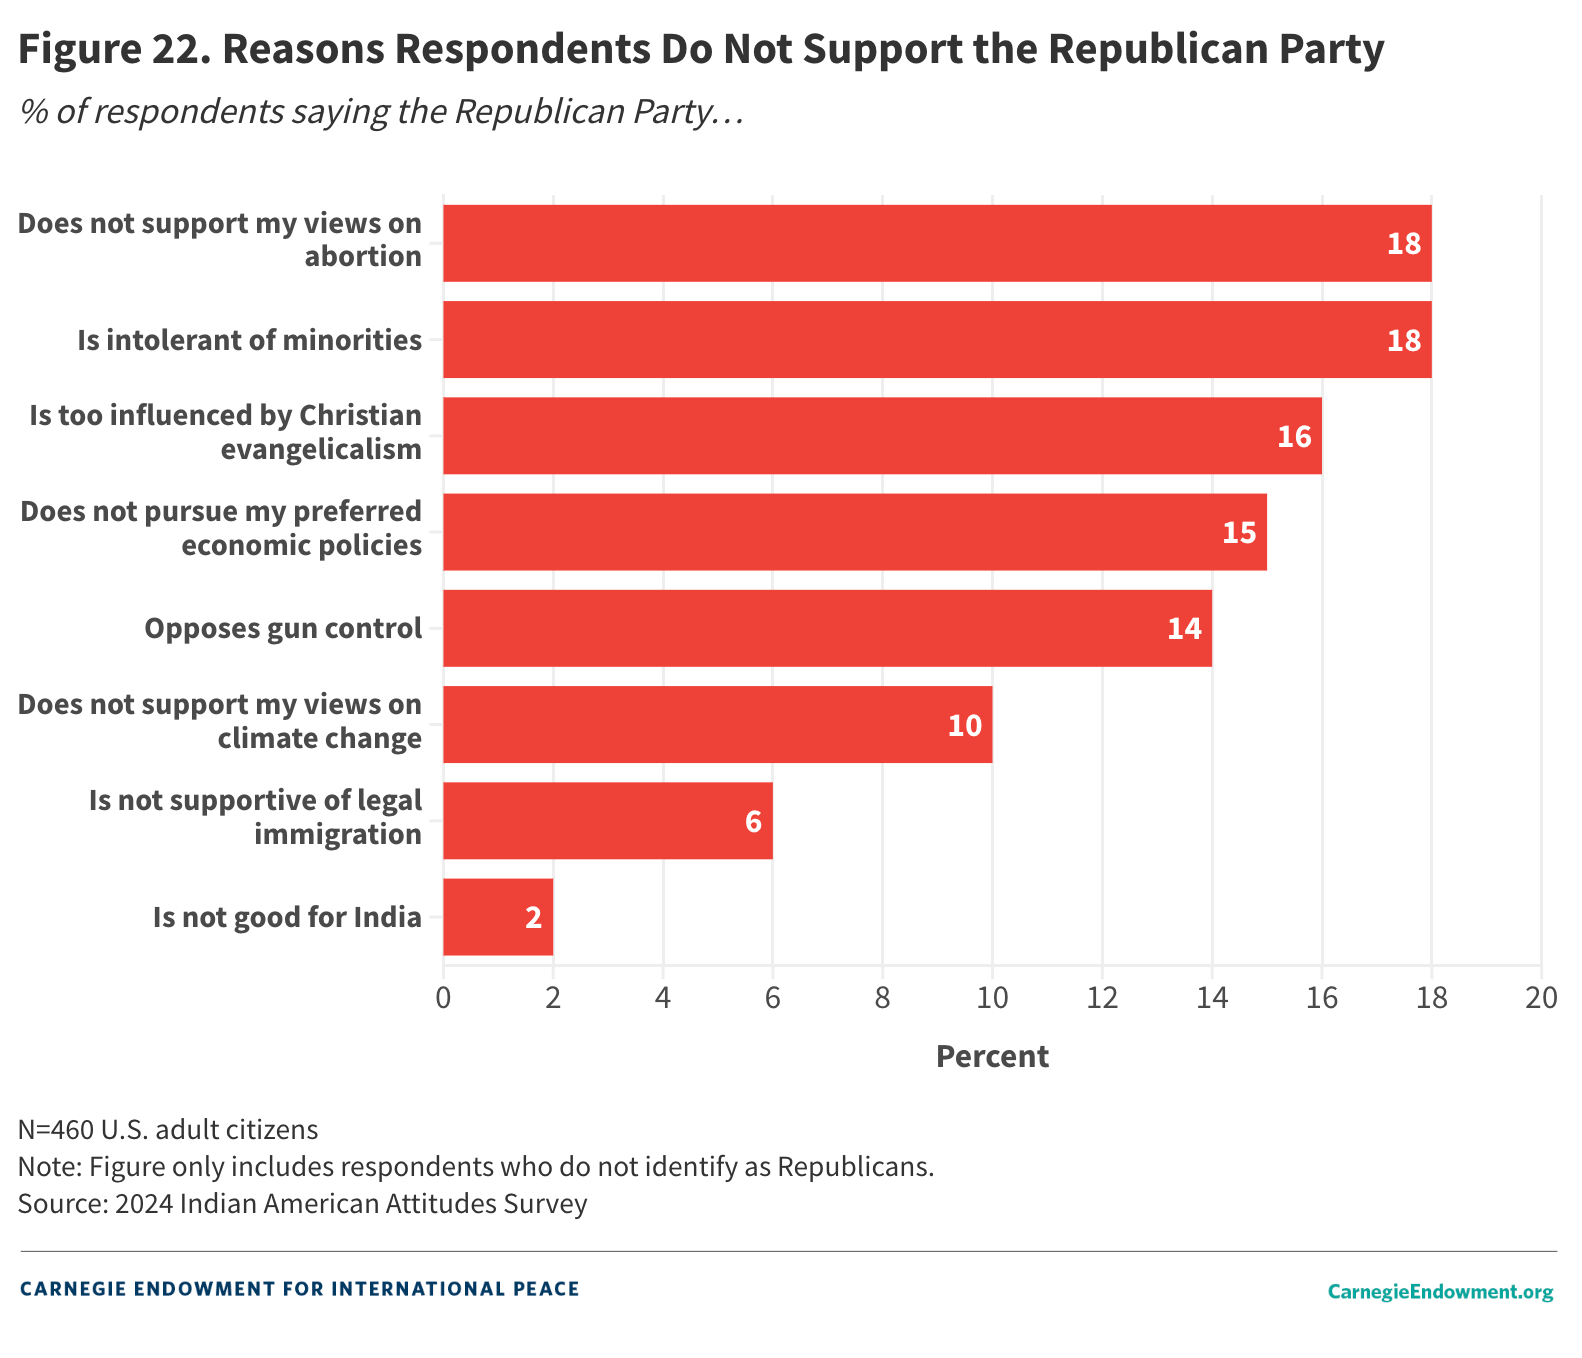
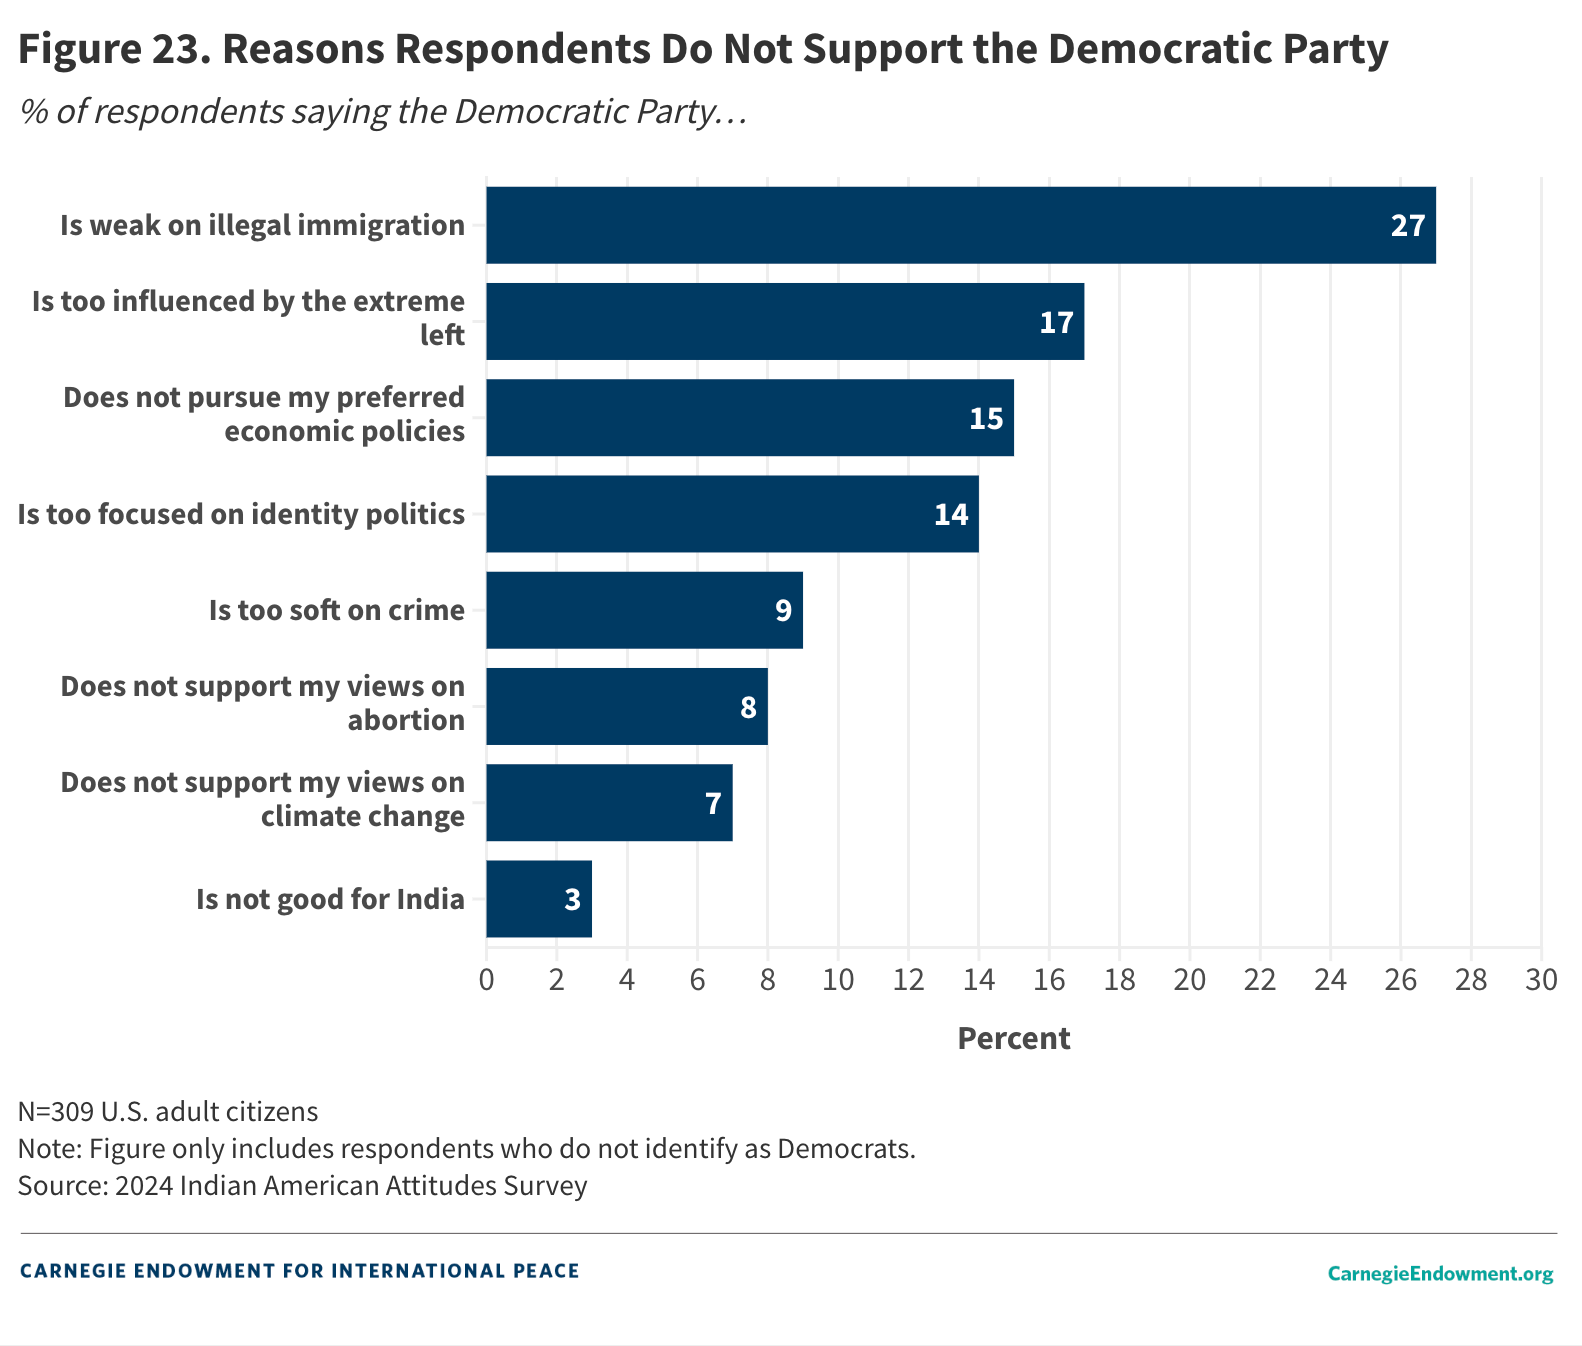
To examine this more closely, the 2020 IAAS asked respondents who identified either as Democrats or independents why they did not identify as Republicans. Conversely, it also asked Republicans and independents about why they did not identify with the Democratic Party. Respondents were shown a list of possible reasons for their political leanings (drawn from the existing literature and media reporting) and then were asked to rank their top two reasons.
In the 2020 IAAS, the most common reason Indian Americans did not identify with the Republican Party was the belief that it was intolerant of minorities. The second-most-common reason selected was the perception that the Republican Party was too influenced by Christian evangelicalism. Together, these two responses were selected by 46 percent of respondents.
The 2024 IAAS finds greater dispersion in responses. Two responses are tied in terms of their frequency: Eighteen percent apiece report that that the Republican Party is intolerant of minorities and that it does not support respondents’ views on reproductive rights/abortion. This is another data point suggesting the salience of this issue in the Indian American community. The next-most-popular responses are that the party is too influenced by Christian evangelicalism (16 percent) and does not pursue respondents’ preferred economic policies (15 percent). The idea that the Republican Party is not good at the bilateral relationship with India is the least-most-popular option, selected by just 2 percent of respondents (see figure 22).
Conversely, when respondents were asked why they did not identify with the Democratic Party, the 2020 IAAS revealed that economic policy differences figured at the top of the list. Twenty-one percent of respondents said this was because the party did not support their preferred economic policies. Three other reasons followed in close succession: the Democratic Party was perceived as too focused on identity politics (20 percent), too influenced by the extreme left wing (19 percent), and weak on illegal immigration (17 percent).
In 2024, respondents who do not associate with the Democratic Party report its weakness on the question of illegal immigration as its biggest liability (cited by 27 percent), a testament to this issue’s salience this election season. The beliefs that the Democratic Party is too left-wing (17 percent), is misguided on the economy (15 percent), and focuses too much on identity politics (14 percent) round out the list. Differences on India have little salience; only 3 percent report they do not affiliate with the Democratic Party because the party is bad for India (see figure 23).
Conclusion
The headline finding of the 2024 IAAS is that Indian Americans remain deeply connected to the Democratic Party but less so since 2020. Six in ten Indian American citizens plan to vote in favor of Democratic nominee Kamala Harris, whose candidacy has energized large sections of the diaspora community. However, the Republican Party has made modest inroads, evidenced by the uptick in support for Donald Trump.
Of course, the Indian American community is not a monolith. The data suggest that there is a stark gender gap, with men—especially men under 40 born in the United States—appearing more positively disposed toward Trump. This aligns with trends seen in the broader American public, where women appear to favor Harris even as men appear more divided. In contrast to the American electorate as a whole, younger Indian American men appear more open to Trump and more skeptical of Harris; it is older Indian Americans who are rallying behind the vice president in the greatest numbers. Also contrary to the general trend in the U.S. population, education does not seem to strongly influence how Indian Americans will vote. Nationally, Trump is outperforming among those without a college education, with college graduates firmly behind Harris; among Indian Americans, however, there is little evidence of a cleavage based on education.
When it comes to policy, bread-and-butter issues like the economy and inflation are top of mind for most Indian American voters. But abortion has emerged as a major issue this election, especially for Democrats and for women. Foreign policy concerns do not rate highly, although Republicans assess them to be more important election issues than Democrats. While Indian Americans might follow foreign policy closely, especially trends in U.S.-India relations, these concerns are not decisive when it comes to the ballot box. In part, this could be related to the fact that there is a bipartisan consensus in Washington that the United States and India should broaden and deepen ties. While each of the parties might emphasize specific issues (or downplay others), India policy is one of the rare issues where the two major parties agree.
Although the Republican Party has made inroads in the Indian American community, most Indian Americans view the current edition of the Republican Party as out of step with their political preferences and policy priorities. Thus, it appears as if the community’s orientation toward the Democratic Party is structural and is likely to persist until and unless the parties themselves experience a makeover.
Appendix A: Methodology
Respondents for this survey were recruited from an existing panel administered by YouGov. YouGov maintains a proprietary, double opt-in survey panel comprised of 500,000 U.S. residents who are active participants in YouGov’s surveys.
Online Panel Surveys
Online panels are not the same as traditional, probability-based surveys. However, due to the decline in response rates, the rise of the internet, smartphone penetration, and the evolution in statistical techniques, nonprobability panels—such as the one YouGov employs—have quickly become the norm in survey research.15 This election cycle, for instance, the Economist has partnered with YouGov to track the presidential election and political attitudes using a customized panel.16 YouGov’s surveys have been repeatedly found to be among the most reliable in predicting U.S. voting behavior due to their rigorous methodology, which is detailed below.
Respondent Selection and Sampling Design
The data for this paper are based on a unique survey of 841 people of Indian origin. The survey was conducted between September 18 and October 15, 2024. To provide an accurate picture of the Indian American community writ large, the full sample contains both U.S. citizens and non-U.S. citizens. However, the analyses here consider the U.S. citizen subsample (N=714).
Sample Matching
To produce the final dataset, respondents were weighted to a sampling frame on gender, age, race, and education. The sampling frame is a politically representative modeled frame of U.S. adults, based upon several reliable national surveys and administrative datasets: the American Community Survey (ACS) public use microdata file, public voter file records, the 2020 Current Population Survey (CPS) Voting and Registration supplements, the 2020 National Election Pool (NEP) exit poll, and the 2020 Cooperative Election Study (CES), including demographics and 2020 presidential vote.
To generate the weights, the respondent cases and the frame were combined, and a logistic regression was estimated for inclusion in the frame. The propensity score function included age, gender, race/ethnicity, years of education, and region. The propensity scores were grouped into deciles of the estimated propensity score in the frame and post-stratified according to these deciles.
The weights were then raked on education, region, and a two-way stratification of age and gender to produce the final weight.
Data Analysis and Sources of Error
All the analyses for this paper were conducted using the statistical software R and employ sample weights to ensure representativeness.
The analyses in this study focus on the U.S. citizen subsample of the data (N=714), which has a margin of error of +/- 3.7 percent. All margins are calculated at the 95 percent confidence interval.
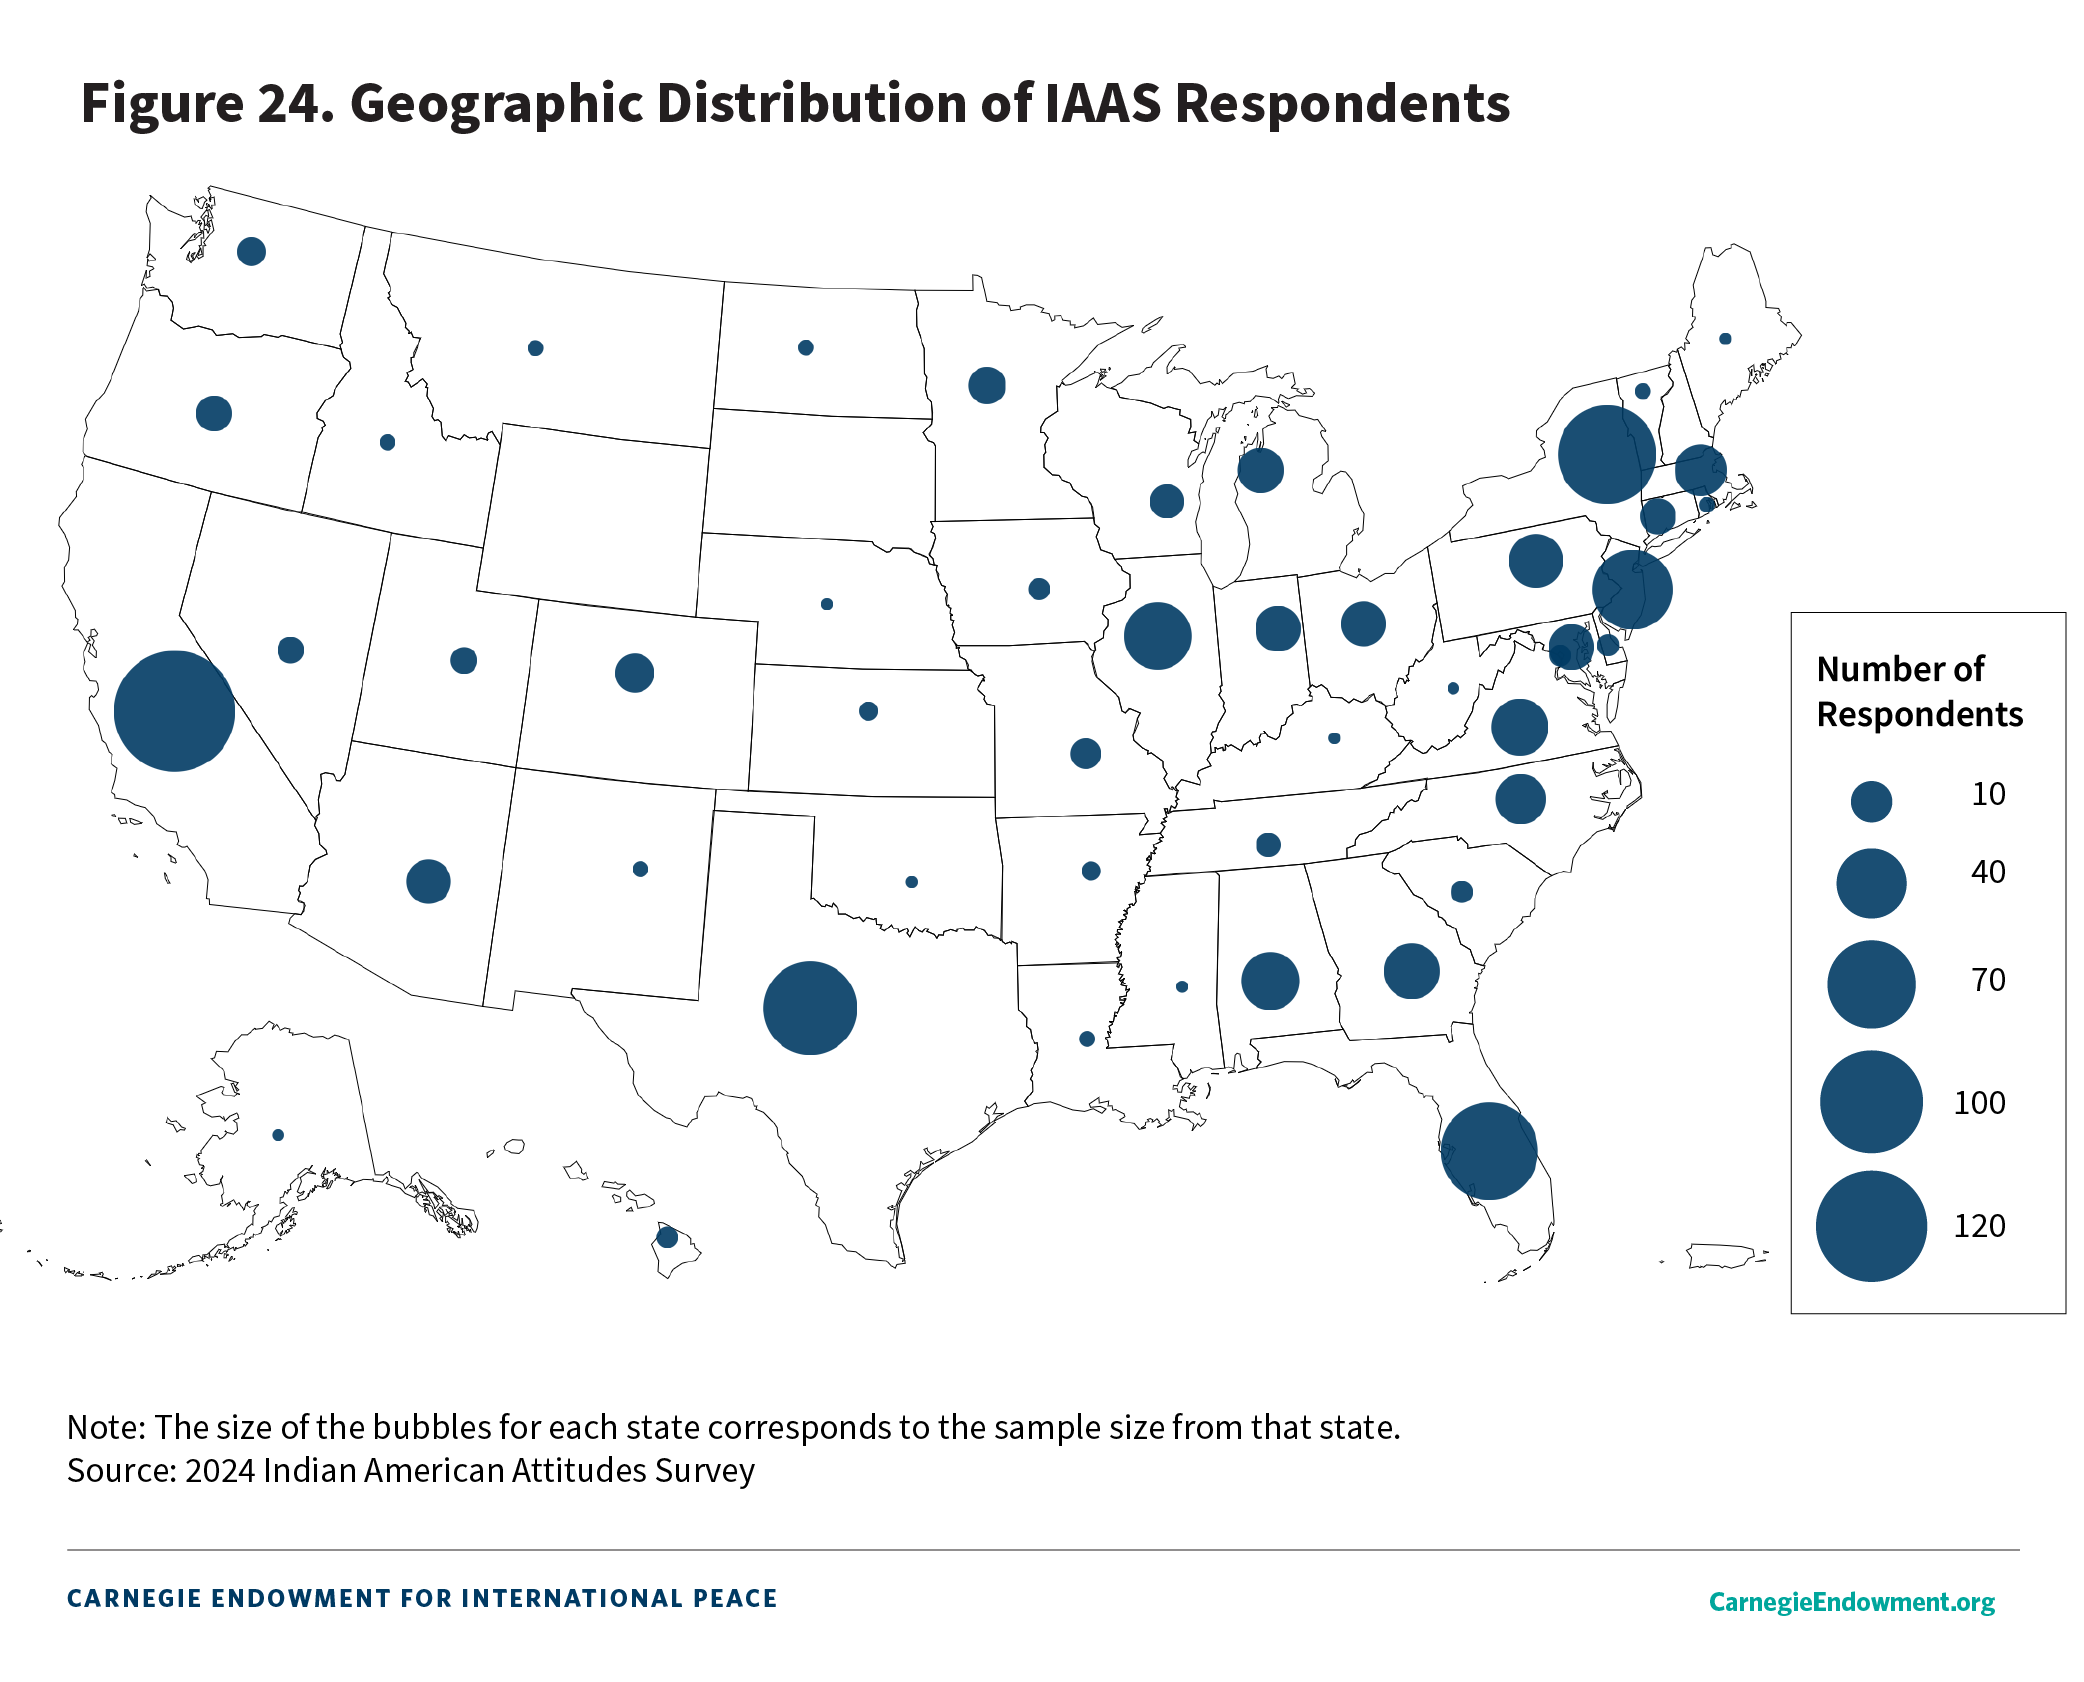
Figure 24 shows the geographic distribution of survey respondents by state of residence.
Appendix B: Additional Information for Tables 4 and 5
Acknowledgments
We would like to acknowledge numerous individuals and organizations for making this study possible. Annabel Richter provided excellent research assistance and was the principal data analyst for this paper. Annabel’s hard work and careful attention to detail made this paper possible. We are grateful to Alexander Marsolais, Clara Cullen, Alexis Essa, and their colleagues at YouGov for their help with the design and execution of the survey. Caroline Mallory also aided with the design of the survey.
This project has been reviewed and approved by the American University Institutional Review Board (Protocol #IRB-2025-32).
At Carnegie, we owe special thanks to Haley Clasen for her swift but meticulous editing of this publication. We would also like to acknowledge Jocelyn Soly for contributing her graphic design talents to the data visualization contained in this paper. Sharmeen Aly, Alana Brase, Aislinn Familetti, Clarissa Guerrero, Helena Jordheim, Jessica Katz, Heewon Park, Mira Varghese, Emily Vaughn, Katelynn Vogt, and Cameron Zotter contributed design, editorial, and production assistance.
While we are grateful to all our collaborators, any errors found in this study are entirely the authors’.
Notes
Notes
- 1These findings are described further in tables 4 and 5 in this paper. Appendix B incudes details on sample sizes for these subgroup analyses.
- 2According to the 2023 American Community Survey, there are roughly 5.2 million Indian Americans residing in the United States if one refers to the population belonging to the category of “Asian Indian alone or in any combination.” Of this group, 3.9 million are aged eighteen or older. While disaggregated citizenship data are not available for 2023, using 2022 data, the authors estimate that there are roughly 2.6 million Indian Americans eligible to vote in the 2024 election.
- 3For a comprehensive overview of Indian migration to the United States, see Sanjoy Chakravorty, Devesh Kapur, and Nirvikar Singh, The Other One Percent: Indians in America (Oxford University Press, 2016).
- 4A September 2024 survey of Asian Americans found that an identical share—96 percent—of Indian American registered voters are either absolutely or fairly certain to vote in this November’s elections.
- 5For instance, in the July 2024 Asian American Voter Survey, which had an overall sample of 2,479 respondents, only 447 were of Indian origin, making further subgroup analyses challenging due to small and potentially nonrepresentative samples.
- 6This study reports sample sizes as raw totals, but all analyses include sampling weights. Therefore, the numbers discussed here are weighted, unless otherwise noted.
- 7The discrepancies in reported median household income between the IAAS 2024 and ACS 2023 could be due to a range of factors, including varying definitions, recall bias, and question wording.
- 8For comparison, the 2020 Asian American Voter Survey found that 54 percent of Indian Americans identified as Democrats, 24 percent as independents, and 16 percent as Republicans. The remaining share identified with another party, did not think in terms of political parties, or responded “don’t know.”
- 9These numbers deviate somewhat from data collected in another recent survey of Asian American voting behavior. According to the findings of the September 2024 AAPI Voter Survey, 69 percent of Indian American registered voters reported their intention to vote for Harris while 25 percent backed Trump. Seven percent of respondents indicated they would vote for a third-party candidate. According to the AAPI survey, 64 percent of Asian Americans overall intended to vote for Harris in the November election, placing Indian Americans slightly above the average for this group. The reasons for the slight deviation with the 2024 IAAS could be multiple, including different samples and timing of the surveys.
- 10Forty was chosen as the cutoff age since it represents the median age in the IAAS sample.
- 11See appendix B for more details on sample size.
- 12Refer to appendix B for details on sample size.
- 13In the 2020 IAAS, respondents gave the Democratic Party a rating of 64, Biden a rating of 65, and Harris a rating of 63. On the other hand, they gave the Republican Party a rating of 41 and Trump a rating of 35.
- 14As Washington Post reporting puts it, “In an immigrant community stratified by religion, language, caste, and class—and whose political divides in the United States often mimic the fissures back home—Harris’s background has been embraced by some but rings hollow for others.”
- 15For an accessible introduction to this survey method, see Courtney Kennedy, Andrew Mercer, Scott Keeter, Nick Hatley, Kyley McGeeney, and Alejandra Gimenez, “Evaluating Online Nonprobability Surveys,” Pew Research Center, May 2, 2016, https://www.pewresearch.org/methods/2016/05/02/evaluating-online-nonprobability-surveys. According to YouGov, its panel outperformed its peer competitors evaluated in this Pew study. See Doug Rivers, “Pew Research: YouGov Consistently Outperforms Competitors on Accuracy,” YouGov, May 13, 2016, https://today.yougov.com/topics/finance/articles-reports/2016/05/13/pew-research-yougov.
- 16To find details on the Economist-YouGov collaboration or to compare some of our findings on Indian Americans with the American population more generally, visit https://today.yougov.com/topics/politics/explore/topic/The_Economist_YouGov_polls.
Carnegie does not take institutional positions on public policy issues; the views represented herein are those of the author(s) and do not necessarily reflect the views of Carnegie, its staff, or its trustees.
More Work from Carnegie Endowment for International Peace
- Indian Americans in a Time of Turbulence: 2026 Survey ResultsPaper
A new Carnegie survey of Indian Americans examines shifting vote preferences, growing political ambivalence, and rising concerns about discrimination amid U.S. policy changes and geopolitical uncertainty.
- +1
Milan Vaishnav, Sumitra Badrinathan, Devesh Kapur, …
- What Happens When a Conservative Movement Continues on Without a Leader?Commentary
Lessons from Korea’s political right.
Darcie Draudt-Véjares
- Can Europe Still Matter in Syria?Commentary
Europe’s interests in Syria extend beyond migration management, yet the EU trails behind other players in the country’s post-Assad reconstruction. To boost its influence in Damascus, the union must upgrade its commitment to ensuring regional stability.
Bianka Speidl, Hanga Horváth-Sántha
- European Democracy Support Annual Review 2025Paper
European democracy support strategy in 2025 prioritized protecting democratic norms within Europe. This signals the start of a structural recalibration of the EU’s approach to democracy support.
- +6
Richard Youngs, ed., Elena Viudes Egea, Zselyke Csaky, …
- Where Does the Split in the Ruling Tandem Leave Kyrgyzstan?Commentary
Despite its reputation as an island of democracy in Central Asia, Kyrgyzstan appears to be on the brink of becoming a personalist autocracy.
Temur Umarov
