

Article
Apoorva Jadhav
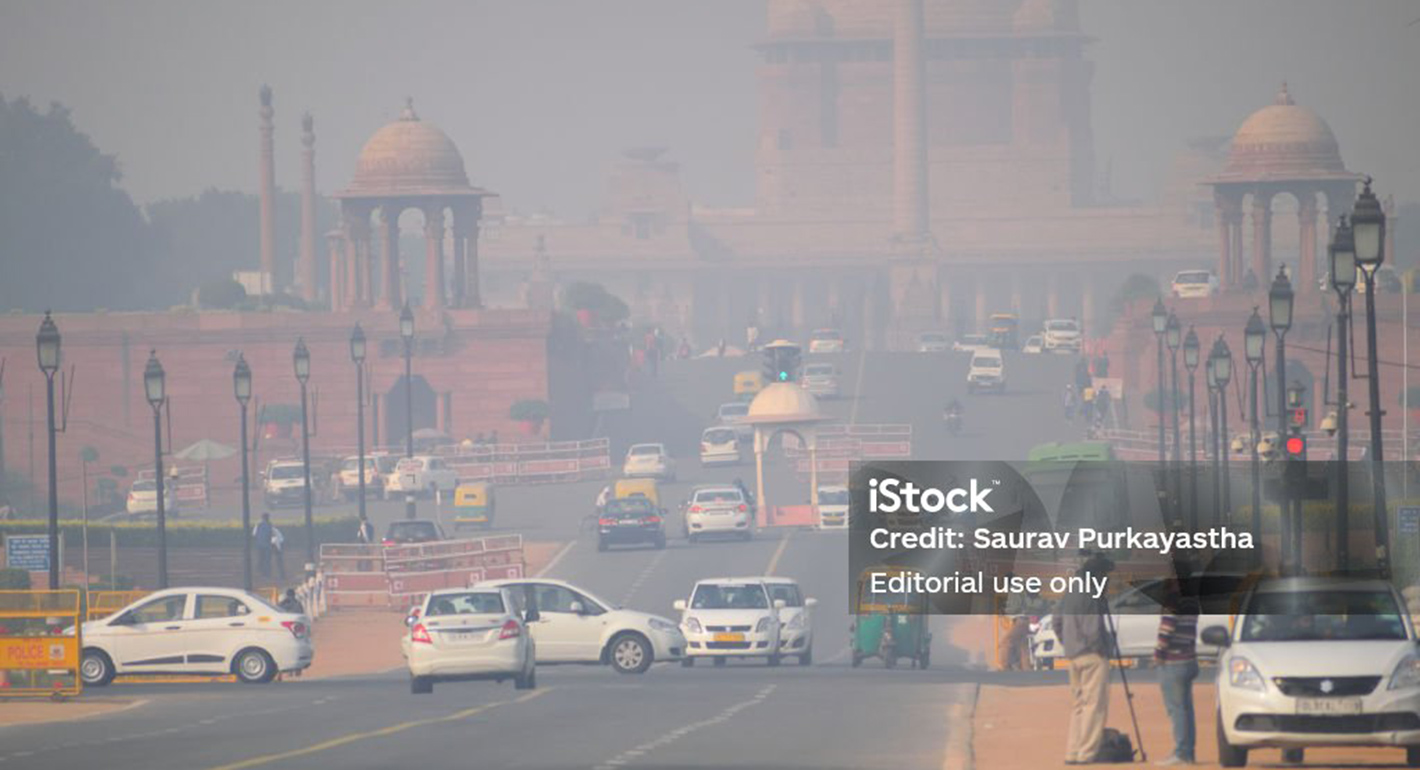
Source: Getty
Too often, the climate solutions generated by the state are built on data that are out of date and insufficiently detailed.
This article is part of a new Carnegie series called “India’s Unfinished Demographic Dividend.” India’s demographic transition should be a historic advantage, but structural constraints are limiting its potential. This series examines the key barriers that could cap India’s growth trajectory—and the pathways to unlocking its demographic potential. The first two articles in the series are available here and here.
In July 2026, Mumbai’s rail, road, and airport services were disrupted across the metropolitan region, and at least thirteen people died as monsoons lashed the city. The chief minister of the state of Maharashtra said Mumbai had received nearly 90 percent of its typical July rainfall in just four days. But just one month earlier, authorities had worried about drought. The lakes supplying water to the city were at 10 percent of their total capacity, leaving Mumbai’s 13 million residents with only forty days’ worth of water.
This whiplash is not an isolated event, nor is it unique to Mumbai, as El Niño complicates monsoon patterns across India. The economic and human costs of extreme weather events are substantial. Climate change has made erratic weather more regular, thus exposing weaknesses in India’s infrastructure (particularly in urban areas) as communities contend with unseasonal rains, flash floods, and droughts linked to extreme heat, leaving millions at risk of disease and displacement. The National Disaster Management Authority estimates that monsoon damage typically costs the Indian economy ₹30,000–₹50,000 crore ($3.5–5.5 billion) in infrastructure losses, agricultural damage, disrupted logistics, and health-related costs every year. Researchers find that rainfall causes more than 8 percent of Mumbai’s deaths during the monsoon season, an order of magnitude more than official statistics. By 2100, climate change could reduce the country’s GDP by 6.4 percent to over 10 percent, and an estimated 50 million people could fall back into poverty because of climate-related challenges.
Behind these disruptions sits a quieter, more urgent failure. The Sixteenth Finance Commission, a constitutional body that recommends how tax revenues should be divided between the government’s center and the states, recently released its 2026–2031 report. To determine how disaster management funds are allocated to states, the commission changed its predecessor’s Disaster Risk Index to use a new, multiplicative formula: hazard x exposure x vulnerability. Hazard is the physical event itself: a heatwave, a flood, a drought, considered separately from whether anyone is standing in its path or able to withstand it. Exposure is operationalized as each state’s projected total population, not just the population that is most at risk (for instance, those in a floodplain or drought-prone district). And vulnerability is reduced to a single variable: per-capita income. The formula thus seemingly rewards sheer demographic size over disaster risk, distributing a substantial ₹2,04,401 crore ($21 billion) in disaster management grants on that basis.
The problem points to a deeper data failure: Granular, hyperlocal spatial data tracking hazard zone populations are inconsistent across state lines, so the formula falls back on population sizes rather than true ecological exposures. Odisha carries the highest hazard score of any Indian state, yet Uttar Pradesh’s Disaster Risk Index is five times higher on a lower hazard score, because exposure is measured by headcount. A state can receive more funding simply because more people live in it, not because more of them live in harm’s way.
India is confronting a demographic transition it can no longer accurately see. The first article in this series identified fertility and mortality as the primary forces behind India’s demographic transition, with migration emerging as a third principal pillar over the next half-century. Climate change is now reshaping all three. Importantly, it runs the causal arrow in the direction demography usually does not: The older debate asks whether population growth drives environmental damage, but this series is concerned with age structure rather than population size alone. Climate change threatens India’s demographic dividend through three growing mismatches: that between the climate risks India faces and what its instruments actually measure; between the demographic transition the state plans for and the one climate change is producing; and between the health shocks reaching Indian workers and the protection available to absorb them.
Understand the world with the latest from our scholars around the world.
The Intergovernmental Panel on Climate Change (IPCC) treats climate risk as the product of three distinct metrics: a hazard, the people exposed to it, and how vulnerable those people are when it arrives. For any given level of global warming, the IPCC finds that the resulting level of risk depends on trends in human exposure and vulnerability. For instance, it notes that between 2010 and 2020, mortality from floods, droughts, and storms was roughly fifteen times higher in the most vulnerable regions than in the least vulnerable ones. India’s adaptation instruments are well-placed to measure the first dimension—the hazards—but they measure the second and third far less accurately. What follows is an examination of that gap across three hazards: heat, floods, and drought, each of which exposes a different part of the same measurement failure.
Extreme heat can cause severe heat stress, organ failure, and even death. Beyond health challenges, the International Labour Organization (ILO) projects that India could lose the equivalent of 34 million full-time jobs by 2030 due to heat alone, mostly in agriculture and construction. Economists put the resulting drag at 2.5 to 4.5 percent of GDP annually.
The district-level heat risk index created by the Council on Energy, Environment and Water (CEEW) is both comprehensive—drawing on climate data from 1982 to 2022—and instructive. Close to 57 percent of Indian districts, home to 76 percent of the country’s population, are currently at “high” to “very high” heat risk. Mumbai, Delhi, and much of the Gangetic plain face the highest exposure, as population density, densely built environments, and existing socioeconomic and health conditions compound one another. The unmeasured population density this series documented in the second article is not only an administrative failure, but it is also a heat trap.
Mapped against this series’ three demographic groupings (see box 1), the pattern inverts what the first two articles found: Aging Frontier states carry the heaviest burden for heat, with 90 percent of their districts falling in the “high” or “very high” risk categories, compared with 66 percent in Youthful Engine states and 20 percent for the Transitioning Middle (see figure 1).
In the Aging Frontier states, heat risk is driven by urban density. These states are among India’s most urbanized, and the index places significant weight on built environment and population concentration. In the drier Youthful Engine states—such as Gujarat, Madhya Pradesh, and Rajasthan—intense heat alone is the main driver, and weaker cooling infrastructure increases residents’ vulnerability. The deeper takeaway is that the states with the strongest fiscal positions and deepest administrative capacity—the Aging Frontier states—will have to adapt the most. Consequently, much of these states’ governing capacity will be devoted to managing heat in cities that are simultaneously aging and warming.
India’s states and territories are at different stages of their demographic transitions. The tripartite classification utilized here is based on the number of years it took each state or territory to reach the demographic leader Kerala’s threshold of survival (life expectancy of sixty-two, reached in 1973) and fertility (based on a total fertility rate of 2.1, reached in 1988). These states and territories are then clustered into three groupings, requiring distinct policy responses:
Aging Frontier (Andhra Pradesh, Kerala, Karnataka, Maharashtra, Punjab, Tamil Nadu): These states converged on advanced health and low-fertility benchmarks relatively early. Their early demographic success, reflected in older, longer-living populations, has created significant fiscal pressures: high debt, persistent deficits, rising pension and welfare commitments, and modest revenue growth.
Transitioning Middle (Haryana, Himachal Pradesh, Jammu and Kashmir, West Bengal): These states and territories achieved rapid gains in life expectancy, reaching the benchmark within roughly twenty-five years of Kerala, but their fertility rate decline lagged considerably. The mismatch between lower mortality and higher fertility means they retain sizable working-age populations while simultaneously facing rising aging-related care needs.
Youthful Engine (Assam, Bihar, Gujarat, Madhya Pradesh, Odisha, Rajasthan, Uttar Pradesh): These states are characterized by large and growing youth populations requiring sustained investment in health, education, and skill development. They experienced significant delays in mortality decline, often twenty-five to thirty-five years behind Kerala, with fertility transitions lagging even further.
India is not starting from scratch in responding to heat risks. For example, Ahmedabad in the western state of Gujarat pioneered South Asia’s first heat action plan (HAP) in 2013, establishing the blueprint for early warning systems. Yet persistent physical hazards, chiefly extreme heat compounded by water stress, mean it remains among the world’s highest residual risk hot spots, despite adaptation plans. This paradox is symptomatic of a broader governance gap: An evaluation of thirty-seven state and city HAPs found that only two had conducted an explicit vulnerability assessment, and the plans overlooked the intersecting realities of caste, gender, class, and labor informality that shape heat risk, which is not spread evenly across the workforce.
Incorporating disaggregated demographic data is essential to confront the reality of a hierarchical “division of laborers,” not merely of labor. The distinction is important. A division of labor sorts tasks, while a division of laborers sorts people into occupational groups that may be inherited rather than chosen. Researchers found, during the 2019 and 2022 heat waves, the relationship between hours worked outdoors and heat stress to be 25 to 150 percent greater for marginalized caste groups, even after controlling for age, gender, education, and economic status.
Climate exposure does not resolve into a single variable that tracks demographic stage or governance capacity. Different hazards have different geographies, so heat, floods, and droughts must be considered separately. This also explains why the Transitioning Middle’s position on the left side of figure 1 should not be read as meaning those states are safe; it simply means that heat is not the principal hazard facing the group’s Himalayan members. There, water held in glacial ice can lead to disastrous floods, as demonstrated by the glacier collapse in August that led to tremendous loss of life and the destruction of communities and infrastructure on the Nepal–Tibet border.
Consider the district-level flood and drought risk mapping released in 2024 by the Department of Science and Technology (DST) with the Swiss Agency for Development and Cooperation (SDC). The assessment was built to give state governments district-level risk maps to plan adaptations. Rather than matching demographic scale, the data reveal geographic concentration: Districts at “very high” or “high” risk of floods are localized across seven states, while districts with the same level of drought risk are spread across thirteen states. Comparing the top fifty flood- and drought-prone districts identifies just eleven facing simultaneous “very high” dual risks, including Patna in Bihar, Alappuzha in Kerala, and Kendrapara in Odisha—representing one in each of this series’ three demographic groupings.
Sorted by demographic cluster, the fifty highest flood-risk districts demonstrate that the hazard component is relatively similar across the Transitioning Middle and Youthful Engine groupings (contributing between 30 and 32 percent of total risk). What changes is the balance of the other two terms, which move in opposite directions. For instance, exposure falls from 39 to 29 percent while vulnerability, measured using eleven development indicators, rises from 31 to 39 percent.
For the Youthful Engine states, flood risk stops being a story about how many people and assets sit in harm’s way and becomes a story about how badly they withstand it. The comparison is confined to these two groupings because only one Aging Frontier district appears among the fifty. For drought, where the Transitioning Middle is represented by only three districts, the same shift is present but much weaker. One caution applies throughout: The DST index builds vulnerability from development indicators such as multidimensional poverty, female literacy, and health infrastructure, that correlate with how far a state has moved through its demographic transition. Therefore, some overlap with these groupings is expected.
Set against the Finance Commission’s Disaster Risk Index, the contrast is stark. But the difference is not a disagreement over the appropriate framework; both the DST and Finance Commission use the IPCC’s framework of hazard, exposure, and vulnerability. However, they differ sharply in how they define and measure each term (see table 1).
The Finance Commission plays the largest role in funding state disaster relief yet uses the least precise measurement to allocate funds.
The three indexes apply the IPCC framework with wildly different rigor. The DST/SDC index includes eleven development indicators for vulnerability, while the Finance Commission index uses a single per-capita figure. Exposure is measured at a more granular level in two of the indexes and less so in the third. The Finance Commission, which oversees the distribution of vast financial allocations, measures the three standards most crudely—the body that plays the largest role in funding state disaster relief uses the least precise measurement to allocate funds.
How exactly do heat, floods, and drought affect health and demographic outcomes? The answers are as varied as the climate exposures themselves, but the defining feature of this series’ demographic analysis is that we are still learning in real time. This points to a fundamental mismatch: India’s demographic instruments were built to track a transition driven from within, yet climate change is now altering it from the outside. This section examines three domains in which climate stress is easily discernible: disease exposure, pregnancy, and migration.
Consider dengue, a mosquito-borne viral disease. Nationally, reported dengue cases between 2016 and 2022 were three times higher than those reported between 2007 and 2015. Himachal Pradesh, a state where dengue was relatively rare, saw 168 times more cases, while Jammu and Kashmir, Mizoram, Meghalaya, and Sikkim also experienced sharp increases. Researchers cautiously attribute this surge to a combination of growing mountain tourism, better detection, and warming. Himachal Pradesh and Jammu and Kashmir sit firmly in the Transitioning Middle grouping, the same cluster that appeared least at risk on the heat index. This example shows that even if warming does not directly harm health, it can bring disease vectors into territories where they are not endemic. Dengue poses a substantial risk to workers, and widespread transmission could result in significant productivity losses, particularly in labor-intensive sectors, linking the climate change and disease narrative to the demographic dividend.
Even if global warming does not directly harm health, it can bring disease vectors into territories where they are not endemic.
Projections suggest that by 2030, the largest proportional increases in dengue will be in Gujarat and Maharashtra, with Andhra Pradesh, Karnataka, and Tamil Nadu potentially seeing increases of 10 to 80 percent. Most of these are among the more urbanized Aging Frontier states. They also rank among the states with India’s highest age-standardized diabetes prevalence, according to Global Burden of Disease estimates, which increases the risk of severe dengue. Put differently, aging, urban populations with high rates of diabetes may be particularly vulnerable. Uttar Pradesh, Bihar, and the rest of the Gangetic Plain are projected to see fewer dengue cases, but these states also have weaker disease surveillance. A decline in reported cases could mean less dengue or less detection.
However, the most important finding of the dengue projection model discussed above actually cuts across all three demographic groupings. When it comes to predicting how many dengue cases a state will report in a given year, climate variables account for only 5 to 6.5 percent of the model’s predictive power. By contrast, per capita income contributes 29 percent, hyperglycemia contributes 12.5 percent, and a simple time trend—capturing, among other things, the improvement in surveillance over time—contributes another 16 percent. This means climate variables are a factor, but their impact is dwarfed by population conditions.
While dengue is one illustration of the links between climate change, demographic outcomes, and productivity losses, the most visceral link starts before birth. The largest study yet connecting extreme heat to pregnancy outcomes in India found that exposure to extreme heat during the first trimester raised the risk of preterm birth, exposure in the second trimester lowered birth weight, and exposure in the third trimester had the strongest link to stillbirth. Risk was concentrated among people with low body mass index and those who were poorer and less educated.
A separate study found that air pollution compounds the danger: Pregnant women exposed to higher ambient air pollution faced higher odds of both low birth weight and preterm birth. This can cause detrimental effects later in the child’s life. The developmental origins hypothesis, which finds that conditions in the womb shape disease risk decades later, is supported by evidence from India that low birth weight raises the risk of type 2 diabetes and coronary heart disease in adulthood. Extreme heat or air pollution increases the likelihood that a baby born today is underweight, which can result in a chronically ill worker with reduced productivity.
The state can see changes in fertility and mortality through hospital records and household surveys. Migration is different. Despite being the most visible of the three demographic forces, it is the least recorded. The Internal Displacement Monitoring Centre (IDMC) counted 672,000 disaster-related displacements in India in 2025. By the end of the year, 130,000 people were still living in displacement. Floods accounted for nearly 472,000 of these displacements, with Uttar Pradesh alone accounting for more than a quarter. Smaller monsoon-related floods that occurred between June and September accounted for much of the remaining displacement. Yet even these numbers understate the typical scale. Reviewing decadal trends, IDMC found that India averages around 3.5 million flood displacements per year; the 2025 figure was roughly one-seventh as large, in part because few large cyclones made landfall.
This type of displacement is one of the most visible manifestations of climate migration. But other effects—such as people being trapped and unable to leave due to fewer resources—are harder to see. India currently lacks a statistical category for climate migrants. This means that an individual fleeing a flooded village is recorded, if at all, as an economic migrant. While disaster-related displacement tends to dislodge entire households, attrition typically involves individual workers. Research shows that weather shocks push migrants toward cities in other states, and migrants from agriculture-dependent households are prone to end up at the lower end of the skill distribution. The population left behind disproportionately consists of the elderly, women, and children. Hence, climate stress drives out the household members best equipped to survive it. But, in a cruel twist, climate migrants often end up working in industries with the most heat exposure, such as construction, kilns, logistics, delivery, and street vending.
Climate migrants often end up working in industries with the most heat exposure, such as construction, kilns, logistics, delivery, and street vending.
India is beginning to build the statistical machinery needed to track climate migration. The National Migration Survey, which is currently in the field, marks the first government-sponsored dedicated migration survey in two decades. The survey captures respondents’ reasons for migrating, short-term and return migration data, and migrants’ employment profiles. The 2027 Census, also underway, will collect migration and fertility data (and, for the first time since 1931, caste data). However, the ability of these instruments to address existing blind spots will turn on whether they identify the environmental reasons for migration and how the results are disaggregated and published.
Across all three domains, the pattern is the same: The signal exists, but the instrument cannot read it. Dengue spreads into states that record it poorly, heat and air pollution shape a worker’s health decades before that worker enters the labor force, yet no survey connects the two. The transition India is planning for and the transition it is experiencing, have begun to diverge.
People who survive a heat-exposed pregnancy or flood-related displacement emerge with worse health and encounter a labor market that does not allow them the space or time to recover. The mismatch here is between health shocks that are rising and increasingly chronic, and protections that reach only the small proportion of the workforce in formal employment. Air pollution is a clear example of how detrimental effects accumulate over a working life and have a material impact on productivity. Although air pollution is not a climate impact, it is closely connected with climate change: Fossil fuel combustion contributes to both, and rising temperatures can worsen pollution by increasing ground-level ozone and trapping pollutants in stagnant air.
As India’s economy has grown, the nature of its air pollution burden has evolved. Between 1990 and 2019, the crude death rate from household air pollution fell from an estimated 122 to 44 per 100,000 people. During this period, burning solid fuels for cooking at home declined. However, deaths from ambient particulate matter (PM) pollution nearly doubled as traffic, industry, and construction increased. The two rates crossed in the mid-2010s. This is the environmental analog of the demographic transition: India is moving away from poverty-related pollution challenges as it confronts pollution inexorably linked to economic development. Youthful Engine states remain more exposed to the first, while the Aging Frontier states increasingly confront the second.
India is moving away from poverty-related pollution challenges as it confronts pollution inexorably linked to economic development.
This shift, rising PM2.5 pollution and declining household air pollution, is a predictable consequence of growth. Similarly, one study finds that states with a larger share of people aged thirty-five to forty-nine have higher per capita carbon dioxide emissions than states whose populations skew either younger or older. This presents something of a paradox: The cohort whose productivity is essential to delivering growth is the same cohort whose consumption, transportation, and building intensify the environmental pressures that threaten growth.
Air pollution accelerates the chronic-disease burden—the impact of conditions such as heart and lung disease, diabetes, and stroke that disable workers for years rather than killing them quickly—which the first article in this series identified as India moves past the middle phase of its demographic transition. Air pollution was responsible for an estimated 18 percent of deaths in India in 2019, and the lost output from premature deaths and pollution-related illnesses totaled $36.8 billion, roughly 1.4 percent of GDP. That study, while a few years old, separates the loss into output foregone because workers died early and output foregone because workers were sick. It spotlights interesting gradients across this series’ demographic groupings (see figure 2).
In Youthful Engine states, illness accounts for 19 percent of the economic loss; the rest is output lost because people died prematurely. In the Transitioning Middle, that share rises to 23 percent, and in the Aging Frontier to 25 percent. As a state moves through its demographic transition, air pollution appears to stop killing workers and start sickening them.
Illnesses from air pollution include stroke, lung cancer, and chronic obstructive pulmonary disease (COPD). Age-standardized death rates from lung disease have fallen roughly 26 percent globally since 1990. But South Asia’s decline has been far smaller, and its mortality rate is now more than double the global average. The contrast between prevalence and mortality is especially revealing. For instance, Australia, New Zealand, and the United Kingdom report some of the world’s highest prevalence of chronic lung conditions, but comparatively low mortality. This is because better primary care and diagnostics, such as routine spirometry, help detect disease earlier. India and Pakistan have higher mortality despite lower recorded prevalence. Lung function testing is uncommon in India, and cause-of-death certification is uneven, meaning that a low recorded prevalence alongside high mortality should not be mistaken for a healthy population. Meanwhile, ambient air pollution is the major COPD risk factor for people in South Asia. For women in poorer households, smoke from solid cooking fuels compounds that exposure. The researchers make this explicit: Lung damage accrues over time. Patients in their fifties arrive at clinics after decades of exposure to smog, construction particles, and disease infections. These are also peak working years, and the exact age when the Aging Frontier’s demographic dividend is supposed to pay out.
Noncommunicable diseases (NCDs) accounted for an estimated 58 percent of India’s disability-adjusted life years (DALYs) in 2020, with their share of deaths ranging from 40 percent in Madhya Pradesh to 75 percent in Kerala. A World Economic Forum–Harvard School of Public Health study, which remains the standard reference, projected that NCDs would cost India $3.55 trillion in lost economic output between 2012 and 2030 (measured in 2010 dollars), roughly six times its projected health spending during this period.
Notably, India has no official workplace program addressing chronic disease and productivity in either the public or private sector. Given the low-birth weight cycle traced above, this burden is not simply a consequence of aging. Some of it was set in motion before today’s youngest workers were even born. Protections against lost income during illness are concentrated in formal employment, leaving them unable to reach the roughly 80 percent of India’s workforce that is informal. For that majority, illness produces presenteeism: working through illness at reduced capacity. A review of ten Indian urban HAPs notes that work performance is projected to decline by up to 40 percent under high-emissions scenarios, emphasizing the urgent need to reinforce an Indian workforce against such effects.
The advantages of a demographic dividend are typically lost through unemployment or through workers who lack the skills to be productive. But there is a third route: through workers who are employed and present at work but produce less because of a heat spell, a chronic condition seeded before birth, or lungs that have absorbed pollutants for decades. Fortunately, India has options to create a more resilient workforce.
First, India should measure exposure rather than population. The Sixteenth Finance Commission has adopted the right framework; the task now is to fill it with high-quality data. Exposure should be weighted by the population living in hazard zones rather than the total projected population, and vulnerability should draw on multiple indicators (such as those used for measuring flood and drought risk) rather than per capita income alone. The commission’s recommendation to classify heat waves and lightning as national disasters should be implemented. Finally, HAPs and flood-risk instruments should be mandatory in vulnerability assessments, which should also incorporate occupation, informal housing, and caste.
Second, India should publish the mobility data currently being collected and ensure climate data are included. The National Migration Survey already captures migration data, shifting the challenge from data collection to whether environmental factors are coded at all and, if they are, whether they are appropriately disaggregated and disseminated. The survey results should be disaggregated by environmental drivers and linked to district-level hazard data so states can track climate mobility rather than treating it as part of the black box of “economic migration.” India’s disaster architecture is built to respond to discrete events such as cyclones. Other slow-burning disasters, such as drought, do not catalyze emergency government action.
Third, India should extend income protection during illness to the informal workforce. Employees’ State Insurance offers a template for wage-linked sickness benefits. Extending some form of protection beyond formal employment would support the workers most affected by climate exposure. Alongside this, maternal health surveillance should track heat and air pollution exposure during pregnancy, instead of treating them as background conditions, and routine lung function testing should be incorporated into primary care.
India’s demographic window will not wait for climate and demographic data to catch up. The first article in this series asked whether the state has the foresight and capacity to count, govern, and equitably support its population through this transition. The second article argued that the state cannot manage urbanization it refuses to accurately measure. This article identifies shortcomings in the data on who is being born, who is surviving, and who is moving. Too often, the answers generated by the state are built on data that are out of date and insufficiently detailed. Commuters in Mumbai who must wade through rainwater to get to the office, the mother whose third trimester coincides with an extreme heat wave, and the worker who left a drought-stricken district for a construction site might appear unrelated, but they are part of the same demographic story.

Nonresident Scholar, South Asia Program
Apoorva Jadhav is a nonresident scholar in the Carnegie South Asia Program. Her work centers on translating complex global demographic trends—specifically fertility changes, population aging, and migration—into actionable frameworks for governments and international institutions.
Recent Work
Apoorva Jadhav
Apoorva Jadhav
Carnegie does not take institutional positions on public policy issues; the views represented herein are those of the author(s) and do not necessarily reflect the views of Carnegie, its staff, or its trustees.
Does the NPP have the will or vision to create a new social contract for Sri Lanka?

Bhavani Fonseka
The 2024 Republican gains among this important constituency have not held.



Sumitra Badrinathan, Devesh Kapur, Annabel Miller, …

Despite public disputes over trade and immigration, the strategic partnership’s foundations remain sturdy.

Sameer Lalwani
Economic recovery has brought Sri Lanka a modicum of stability, but domestic strains and great-power rivalry could test how long it lasts.

Avinash Paliwal

There is a transnational far-right populist movement that links middle powers in a global movement that extends well beyond Trump.



Christopher S. Chivvis, Rohan Mukherjee, Milan Vaishnav