Commentary
Ultimately, Zelensky sided neither with the reform camp nor with the military establishment as such, but with political control.
Balázs Jarábik
{
  "authors": [
    "Sergei Ermolaev"
  ],
  "type": "other",
  "centerAffiliationAll": "",
  "centers": [
    "Carnegie Endowment for International Peace",
    "Carnegie Russia Eurasia Center"
  ],
  "collections": [],
  "englishNewsletterAll": "",
  "nonEnglishNewsletterAll": "",
  "primaryCenter": "Carnegie Endowment for International Peace",
  "programAffiliation": "",
  "programs": [],
  "projects": [],
  "regions": [
    "Russia"
  ],
  "topics": [
    "Political Reform",
    "Climate Change"
  ]
}
Source: Getty
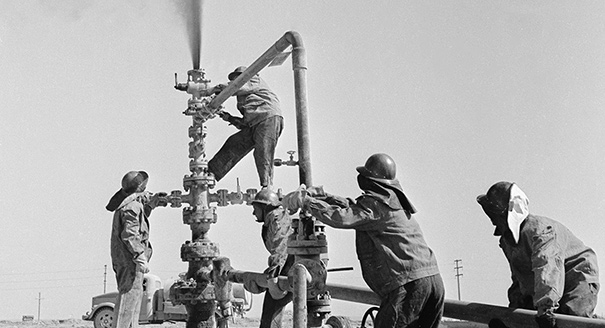
Between the end of World War II and the mid-1960s, the Soviet Union’s economy was one of the most vibrant in the world. The country had successfully launched the first man into space and was competing with the United States in developing cutting-edge military technology. However, by the end of the 1980s, the economy was in a miserable state.
Discovering Oil From Azerbaijan to Western Siberia
Estimates of the Russian Economy’s Resource Rent in the Soviet Period
Oil and Gas in Soviet Foreign Trade
This paper is a part of “Comparative Analysis and Policy Proposals Aimed at Diversifying the Russian Economy and Enhancing Prosperity” project, supported by the UK Foreign and Commonwealth Office.
![]()
Between the end of World War II and the mid-1960s, the Soviet Union’s economy was one of the most vibrant in the world. The country had successfully launched the first man into space and was competing with the United States in developing cutting-edge military technology. However, by the end of the 1980s, the economy was in a miserable state (but this was not obvious to everyone). How did it get to that point? Back in 1960, just twenty-five years earlier, the Soviet Union’s GDP per capita was on par with Japan’s. There are many explanations for the decline of the Soviet economy:
The existing methods of social sciences do not apparently allow us to conduct a detailed analysis of the role of the above-mentioned factors, considering the share of each of them, in the slowdown and depression of the Soviet economy. In this publication, we will focus on the formation and development of the Soviet economy’s oil and gas dependence.
For an extended period of time, the Soviet Union was the world’s largest producer of energy resources. In 1989 (the last year for which comprehensive data is available), total energy production, including oil, natural gas, coal, hydropower, and atomic energy amounted to about 21 percent of the world’s total production, as opposed to the United States’ 20-percent share. Gas made up 36 percent of the total energy output in the USSR; oil comprised 36 percent; and coal amounted to 20 percent.1
There were ongoing debates about the resource dependence of the Soviet, and later, Russian economy. The debates intensified, most naturally, after each time the price of oil began to decline (soon followed by price drops in gas and other natural resources). In particular, this happened during and after the crises of 1982, 1986, 1998, 2008, and 2014.
Here, we would like to conduct an in-depth analysis of the origins and progress of the Soviet Union’s oil and gas dependence in order to reach a deeper understanding of its parallels with the oil and gas dependence of modern Russia. The text will consist of the following parts:
Before the resource curse theory emerged, the problems linked to the Soviet Union’s oil and gas complex were usually divided into two groups2:
We will take a brief look at each of these factors. The central planning system affected economic policy through three main channels. Firstly, the system is considered to have generated incorrect, incomplete, or irrelevant information, which was then passed into the wrong hands. In particular, the price system was creating the wrong supply and demand signals, especially related to new goods and services. Interest and discount rates did not reflect the preferences of society (and only loosely reflected those of the country’s leaders) in regards to risks or the choice between the present and the future. Information flows were moving mostly vertically, not horizontally. The people who were supposed to make decisions lacked the necessary information, whereas those who had access to the best information were not responsible for making decisions. This is why plans based on misinformation are hard to implement.
As Vasiliy Pater, the former head of the State Planning Committee’s (Gosplan’s) oil industry subdivision, recalls, in the 1970s, annual plans did not correspond to the five-year plans, and actual figures were different from both of them. For instance, in 1975, the five-year plan prescribed to extract 505 million tons of oil.3 This figure was then reduced to 487.4 million tons in the annual plans, and 491 million tons were actually extracted. Despite the fact that the five-year plan was not fulfilled, they planned to extract 640 million tons in 1980, then lowered the figure to 606 million tons in the annual plans, and actually produced 603 million tons. Again, despite not hitting the previous target, in 1985, the country was supposed to produce 630 million tons according to the five-year plan; annual plans lowered the level to 628 million tons, and 595 million tons were actually extracted (it’s important to mention that despite problems with accurate information in the five-year plans for the development of the national economy, the difference between the planned level and the actual one was not as striking as one might expect, and amounted to 2.8–5.8 percent in the mentioned years).4 The gaps were particularly dangerous in regards to receiving and using information on oil and gas deposits that were potentially ready for exploration.
Secondly, the planned system generates irrational incentives and conflicting preferences and doesn’t have a way of bringing them together other than time-consuming negotiations or administrative pressure. For instance, distorted incentive systems and the lack of strict financial limitations encouraged excessive use of all resources, despite the quality standards and delivery timetables in use, and neglect for the needs of the consumers.
Thirdly, as a consequence of the first two reasons, the goals set by the leadership were considerably distorted in the process of achieving them. Resources were delivered in the wrong composition, were presented in the wrong order, and then often used for a purpose other than that for which they were intended. Manufacturers shirked the consequences, which went to consumers, and reported wrong information about fulfilling the plans to the leadership. This caused another round of dysfunctional planning.
Egan Neuberger, Thane Gustafson,5 and, later, Gaddy and Ickes,6 put an emphasis on another important feature of the Soviet economic system: its accumulated effects, embodied in the country’s physical infrastructure. Gustafson uses a metaphor to compare the Soviet economy with a warped tree that has grown under the strong northerly wind of industrialization. This is reflected in the structure and location of the nation’s capital stock, network of roads and railroads, size and type of enterprises, distribution of labor resources, and the types of fuel and minerals it uses. This feature of the Soviet (and now the Russian) economy has determined, among other things, its high oil and gas dependence in a sense that large amounts of oil and gas were required to keep the economy running. From an economic viewpoint, this problem was caused by the extremely low mobility of economic resources, first and foremost, the low mobility of physical capital.
Bornstein (1985), Chistovich (1990), and Nove (1986) single out the following reasons why the use of energy was inefficient in light of nature of the Soviet planned economy7: (a) the heads of enterprises did not have incentives to minimize production costs; (b) energy caps and the distribution of energy led to an excessive use of energy; (c) technological progress was suppressed by the lack of incentives to innovate and the fact that any changes could lead to problems in receiving new resources and higher risks in achieving production goals; (d) exclusive production of multiple goods by one enterprise meant that the goods were always in demand, regardless of their features; (e) construction of a large number of apartments in the 1950s and the 1960s led to the situation where their quality and energy features were less important than the volumes of construction; and (f) it was meant a priori that large central heating systems had no alternatives, and systems that were potentially more efficient were never considered.
This posed the question about whether the appearance of large oil and gas revenues had actually made the mentioned drawbacks of the planned economic system worse. One of the leading experts in the resource curse, Michael Ross, on the back of reviewing multiple studies, assumes there are no sufficient grounds to state that oil negatively affects the quality of government institutions.8 This means that oil was highly unlikely to aggravate the disadvantages of the planned economy.
When reflecting on whether the resource curse existed in the Soviet Union, it is important to determine the meaning of this term. We will adhere to its initial interpretation, which is the reduction of long-term economic growth rates of a country along with the growth of certain indicators of its resource availability (the share of raw materials in exports, total raw material exports, or raw material extraction per capita). There is a consensus in economic science that the resource curse, if it exists, is relative. This means that the negative consequences of high resource availability take place only under certain conditions (while the composition and threshold values of these factors are subject to debate; this is largely explained by the difficulty of evaluating the influence of different conditions on the dependence of economic growth from resource abundance empirically).
The resource curse theory is not an all-inclusive doctrine, but rather a combination of many hypotheses about the effect of different factors (mechanisms) that determine the negative correlation between the growth of resource availability and the change in economic growth rates. All these mechanisms could be divided between the purely economic and the political-economic. Until the end of the 1990s, economics mostly focused on economic factors, but currently, the emphasis has shifted to the political economy of the development of resource dependence.
According to this thesis, the terms of trade of resource-exporting nations get worse over time. This is linked to the fact that these countries mostly import final products, prices on which grow faster than prices on raw materials in the long term. As different kinds of raw materials occupy the main share in exports of most developing nations, they become victims in the global division of labor system.9
A consequence of the dissemination of this theory (first and foremost in Latin American nations) was large-scale import substitution industrialization. There is evidence that the Soviet Union’s industrialization became a role model for it. The idea that the Soviet Union adhered to during the industrialization aligned with the conclusion made by Latin American nations from the Prebisch-Singer thesis two decades earlier. This is the idea to reduce the dependence on developed nations in the consumption of industrial (and all technologically complex) production.
But, the Soviet Union was pursuing another goal that was, according to its leadership, just as important: the creation of a powerful military-industrial complex that was independent from the West. Recent studies have shown that only certain kinds of raw materials can experience a long-term downward price trend, and oil is not on the list.10 But not only the long-term price trend for the exported raw materials but also its short-term fluctuations are important for a country. And few resources can be compared to oil in this regard (see more about price volatility below).
This disease emerges and progresses through the real exchange rate of a national currency and, in particular, through its strengthening.11 There are two ways that this could happen: through the increase of the national currency’s nominal exchange rate or through a higher rate of inflation in the country compared to that in other countries (its trading partners). This, in turn, causes two effects: resource movement and expenditure. The first effect leads to movement of capital and labor from the processing industry and the service sector. The second one, through spending extra revenue of the resource sector inside the country, increases the demand for services (it is assumed that the service sector is non-traded, that is, it’s hard to substitute foreign goods with domestically produced ones). Both effects cause the deindustrialization of the economy.
Were these mechanisms functional in the Soviet Union in the 1970s and early 1980s when oil prices skyrocketed? It was the State Bank, not the free market, which set the ruble’s nominal exchange rate. From the Soviet ruble’s official exchange rate (see figure 1), note that it often dropped during the periods when oil prices went up (for example, between August 1973 and February 1974). The principal price hike took place in January 1974: from $4.31 to $10.11 per barrel (see figure 2). However, between February 1974 and August 1975, the ruble’s exchange rate climbed from 0.79 to 0.69 per dollar (but oil prices increased insignificantly from $10.11 to $11.16 per barrel). Obviously, a change in the ruble’s real exchange rate did not correlate with the scale of changes in oil prices.


All the economic mechanisms of the resource curse we review presume the existence, in one form or another, of market mechanisms (that is, the existence of private economic agents who react to incentives). However, the planners (Gosplan staff) who were not interested in boosting the profits of state-run enterprises as business owners in capitalist countries are, still responsive to incentives, albeit with delay. The growing returns on the invested capital and labor in the oil industry should cause a resource movement effect, and they did.
However, available data (see table 1) shows that despite the rapid growth in oil prices after 1973, the share of investment in the energy sector decreased from 29.4 percent to 28 percent between 1971 and 1975, then stabilized and started growing only in 1978, reaching 38.6 percent in 1985. Thus, we can’t say that the effect of capital’s movement to the oil extraction industry started to work all at once, it started to take effect in the late 1970s, as the national leaders clearly realized that the increment of oil stock started to lag behind oil production. Between 1977 and 1985, the share of investment in the energy sector grew by 10 percentage points (in fact, since the early 1970s, geologists have not been fulfilling the exploration drilling plans every year12). Between 1970 and 1986, the growth rates of capital investment in the oil and gas industries were considerably higher (three- to five-fold) than in the industry and the economy on average. Between 1970 and 1973, before the energy crisis, the share of the oil industry in total capital investment across all industries hovered around 8.8–9.3 percent; in 1986, it amounted to 19.5 percent. The increase of the oil sector’s share in the whole energy complex was not as surprising; it rose from 31.4 to 40.6 percent.13

The mechanism at the heart of Dutch disease assumes that the movement of labor and capital to the resource sector only takes place when this sector experiences a boom, or, more precisely, until the returns on the invested capital are higher than in other industries. Unfortunately, we don’t have data for such an analysis, but we repeat: starting from 1986, the Soviet Union had to invest a lot of effort into boosting oil production because the price of oil dropped sharply in 1986. According to some experts, the cost of extracting an extra ton of oil during this period exceeded its price. Matthew J. Sagers estimates the cost of extracting an extra barrel in the mid-1980s at $15, while the world price of a barrel of oil stood at $14.14 According to other estimates, “It was only due to huge expenses that oil output somewhat increased in 1986. [In this year], [the authorities] allocated 31 percent more of capital investment than in 1985” (the 1986 output amounted to 615.4 million tons, that is, only 3.1 percent higher than in 198515)16 This also meant that the rent from each additional ton of oil tended toward zero (and probably was occasionally negative).
The Dutch disease is called a disease because it implies that it’s hard for the economy to recover after a period of high oil prices since over this period the processing industry and agriculture lose their competitiveness due to reduced output volumes during a boom period (it learns by doing less than it could have if there was no boom). For the Soviet Union, the stagnation in agriculture was perhaps even more influential (see data on grain imports later on). We can assume that the Soviet authorities would have to reform the country much sooner if there were no high resource revenues.
In real life, the capital stock of the economy (material and human) cannot change its structure overnight, even if it gets very profitable to move it to other industries. This means that the economy has to undergo very painful changes in its industrial structure. However, ideal economic models deal with a perfect capital market, meaning that banks and other financial institutions can evaluate the prospects of investment projects even in completely new sectors of the economy and provide capital under a reasonable interest rate. This means that companies have easily available capital during periods of structural changes in the economy.
In a planned economy, there was no financial market in the modern sense (there was a fight between different ministries, authorities, and regions over maximizing their shares in the distribution of resources). However, even Gosplan had to react to the demands of consumers and the leaders of the country in one way or another and change the flows of investment. Can we imagine that the Soviet Union could have converted a part of the military-industrial complex into manufacturing civilian products more successfully and thus smooth the drop in oil prices? It is difficult to estimate this now.
When the Soviet Union received more dollars for the oil it was selling, this created an incentive to import more goods both for the population and for industrial consumption. It is important to keep in mind that the military-industrial complex was drawing in the best resources, including the most skilled staff and material resources. Even the oil and gas complex was suffering from the never-ending shortage of necessary resources and was highly dependent on imports of many investment products.
Available data shows that during the 1970s and 1980s, imports of a range of goods increased. “If in 1970, the USSR bought 2.16 million tons of grain, by 1985 the figure amounted to 44.2 million tons (a 20-fold increase). Procurements of meat from abroad increased by 5.2 times: from 164.9 thousand tons in 1970 to 857.5 thousand tons in 1985. Imports of clothes and footwear quadrupled in monetary terms (from 699 million to 2.7 billion rubles) and 4.6 times (from 271 million to 1.25 billion rubles), respectively,” notes Russian oil sector historian M. Slavkina.17
On the whole, it could be said that the mechanisms of Dutch disease manifested themselves in the Soviet economy in a specific manner: during the raw materials boom, resources were moved to the oil and gas sector, while the authorities’ willingness to develop the processing industry declined and agriculture stagnated.
Global raw materials’ prices were much more volatile than prices on end products. The results of many studies showcase this. An in-depth study of economic growth of thirty-five nations between 1870 and 1939, conducted by Christopher Blattman, Jason Hwang, and Jeffrey Williamson, concluded that nations specializing in the production of raw materials (with highly elastic prices) have a higher elasticity of the terms of trade, a smaller amount of foreign direct investment (FDI), and slower rates of economic growth.
We can’t discuss FDI in regards to the Soviet economy, but we know the following fact about the change in the country’s terms of trade: the purchasing power in 1988 of one barrel of Soviet oil, expressed in items of West German machinery, decreased to one-quarter from the 1985 level.18 A change in terms of trade like this is highly painful for the economy; it means that the country had to export four times as much oil in order to buy the same number of imported goods. (This is, of course, an exaggeration for foreign trade, but it’s still important to remember that oil and gas accounted for about four-fifths of the Soviet Union’s exports in the 1980s.)
It is highly ironic that before the 1970s, the Soviet Union was trying to hedge against fluctuations caused by its involvement in global trade, was creating a highly diversified industry for this purpose (it bought the goods it lacked in the members of the Council for Mutual Economic Assistance, or Comecon), and was importing high-tech products from Western nations only in case of a grave necessity. At the end of the day, the country suffered a lot from this trade (see below for more details on energy exports).
Early theories of economic resource dependence emphasized the economy’s reliance on exports of natural resources. But what if the principal volume of resource rent comes from the internal consumption of resources, rather than from their exports? In the latter case, the economy is highly dependent on the global market (and its consequences, such as Dutch disease and extremely high volatility of resource prices and capital flows). But what if the functioning of market mechanisms is suppressed? In this case, only planning authorities determine to which industries and in what volumes resources should be distributed (which, in theory, was supposed to prevent Dutch disease from developing).
If cross-border capital flows are nonexistent or very small, their volatility should pose no threat to the economy (as there is no stock market and the pressure on the national currency’s exchange rate is tiny in both directions). Would the resource curse exist in the ideal case of a completely autarkic country? In the case of a resource boom caused, for instance, by the discovery of new deposits, the costs of production (and hence consumption) would rapidly decrease; in case the deposits are drained, they would increase again. Thus, it still would not stop volatility in the economy. It would, however, be volatility caused by a fluctuation of volumes of resources in natural deposits. The Soviet Union had to encounter the volatility of both oil production and the demand for it.
The political-economic mechanisms of the consequences of resource abundance are not as well known and not as empirically backed up as purely economic mechanisms. However, it is the political-economic mechanisms that have been attracting the lion’s share of researchers’ attention over the last two decades. Economic mechanisms may seem reliable, but a question arises: why can’t the government develop and apply the necessary corrective steps? As Michael Ross points out,19 why can’t governments boost the efficiency of extraction sectors and diversify the exports in order to prevent the long-term drop in the terms of trade? They could also dampen the economy to prevent unfortunate events on international raw material markets using stabilization funds, cautious fiscal policy, and unforeseen resource revenues to boost the development of sectors in the lower levels of the technological chain. They could cure Dutch disease by conducting tough fiscal policy, temporarily providing subsidies to the agriculture and processing industries, and keeping the unforeseen resource revenues in foreign currencies in order to prevent the strengthening of the national currency.
We should mention that the Russian government applied some of these measures in 2004, in particular, the creation of a stabilization fund and the struggle with the strengthening of the ruble (although it was not that successful, considering the fact that the dollar’s exchange rate dipped to almost 23 rubles, when oil was at its peak). The incapability of governments to take steps to turn the resource curse from a liability into an asset became the biggest brain-teaser in the resource curse theory.20
The political-economic explanation of the resource curse is composed of three groups of theories: cognitive, which accuse government actors of short-term vision;21 social, which point at adverse effects of privileged classes, sectors, networking clients, or interest groups;22 and statist theories, which put an emphasis on institutional weakness or strength of the government, its capability to produce and use resources, ensure property rights, and oppose the demands of interest groups and rent seekers.23 All these theories view resource rent as an independent variable and economic stagnation as a dependent variable.
Each of these theories is applicable to an extent in explaining how the Soviet Union, and later Russia, have found themselves with resource dependence. Cognitive explanations could partly reveal why the Soviet, and later Russian, leaders have proved to be shortsighted, as they failed to foresee a dangerous trend for at least a decade ahead (although oil prices started to drop earlier than ten years after they had started to rapidly grow).
In the first case, the difference made up about eight years (from 1974 to 1982), and in the second one, it was also about eight years (2000–2008). This was typical of other nations experiencing a resource boom. For instance, Nurske and Watkins wrote about the “get-rich-quick mentality” among the entrepreneurs and the “boom-and-boost” psychology among the politicians, which can be described as a rotation of excessive optimism and harsh austerity.24 Because of that, the resource curse can lead to instable economic policy. This can translate into excessive borrowing, which negatively affects the economy both in the short- and long-term periods.25 Excessive borrowing on the global market leads to the devaluation of the national currency in the long term.
Similar models (of overlapping generations) assume that the current generation has no intention to leave an inheritance and gets credits at the expense of resource revenues for future generations. This is why the current generation, maximizing its current wealth, borrows much more than it would if it cared about the well-being of future generations. Manzano and Rigobon also found that resource-rich countries have an incentive to borrow excessively. But the cognitive approach has serious drawbacks: firstly, it departs from the assumption that economic agents act rationally; secondly, it is applied ad hoc,26 rather than as part of a clear-cut and tested theory; thirdly, there is little evidence that politicians experience collective catatonia, caused by resource wealth.27
The social approach is usually used to explain why East Asian nations were able to switch from import substitution industrialization (ISI) to rapid export stimulation strategies, and why Latin American nations failed to do so. This approach presupposes that manufacturers and workers in extractive industries of Latin American nations were used to the rent coming from the extraction sector and opposed the departure from the ISI. In East Asian nations, there were considerably less advocates of the ISI, thanks to the fairly insignificant flow of incoming resource rent. Such an approach is used to explain the existence of many non-competitive industries in the Soviet, and then in the Russian, economy. Gaddy and Ickes use the term “inverted funnel” to explain how the resource rent flows vertically down in the economy—from the beginning to the end of value chains.28
Social explanations can be used to describe the negative effect of the military-industrial lobby in the Soviet Union on the distribution of resources—first and foremost, the most scarce ones—between the industries, including to spell out why there were not enough resources to diversify the economy and boost the efficiency of the oil and gas complex.
The social approach, however, has a number of disadvantages. Firstly, most authors rely on the data of a small number of nations, which are different in many ways, not only in resource availability (usually, Brazil, Colombia, Mexico, South Korea, and Taiwan). Secondly, the problem of low economic growth rates is considered to stem from high trade barriers. But many studies have found low correlation between resource wealth and trade barriers.29 Thirdly, social arguments work best when nongovernmental actors have a priority right to the resource rent. In most cases, it’s the government that withdraws the principal part of this rent. This, in theory, should allow it to leverage nongovernmental actors by isolating them from the pressure of interest groups and buying opponents. It’s unclear why a resource boom should aggravate the quality of policies. Indeed, with the start of the resource boom in the 2000s, the government in Russia has started to rapidly strengthen, which is showcased by the Yukos case and the increase of the government’s participation in the oil sector.
Statist explanations are suitable for explaining why decisionmakers at every level of managing the Soviet economy lacked motivation to raise the energy efficiency of both production and consumption. They can also be applied to understand why Russian taxpayers were not particularly interested in controlling the efficiency of state expenses in the 2000s (and still aren’t): high resource rents allowed taxation to be kept low, creating relatively low costs for taxpayers.
The Russian oil industry was born in the nineteenth century in Baku, now in Azerbaijan. This city was part of a khanate that was annexed by the Russian Empire at the beginning of the century. By that time, a primitive oil industry had already begun to appear, and by 1829 the area had eighty-two hand-dug wells. However, the volume of oil production was very modest. The industry’s development was considerably hindered by the underdevelopment of the region, its location away from industrial centers, its corruption, its despotism, and the low qualifications of the Czarist administration, which ran the oil industry as part of the state monopoly.
However, beginning in the 1870s, the Russian government terminated the monopoly and opened Baku for competing private companies. According to Daniil Yergin, “this resulted in a blast of entrepreneurial activity. The time of hand-dug wells had ended. The first wells were drilled in 1871-1872 and over 20 small oil refineries were active in 1873. Crude oil output in Russia amounted to 600,000 barrels in 1874 and reached 10.8 million barrels within a decade, which equaled to about a third of the USA’s output. In the beginning of the 1880s, about 200 oil refineries were active in Baku’s new industrial suburb with a suitable name, the Black City.”30
At the turn of the twentieth century, the area around Baku was the world’s biggest oil-producing region. However, in the decade prior to World War I, the Russian oil industry started to lose momentum, particularly in the Baku area. “The domestic oil extracting technology fell behind Western technologies and there was a stagnation in the availability of equipment. The best years of the Russian oil industry, when it was a vibrant element of the world market, were over. Between 1904 and 1913, the Russian share in the world’s total oil exports dropped from 31 to 9 percent,” says Yergin.31
Compared to Western nations, the Soviet Union started to turn oil and gas into the energy backbone of its economy relatively late. This seems a little strange, as in 1901 Russia extracted about 250,000 barrels daily, almost on par with the United States.32 Back in 1959, coal, peat, slate, and wood accounted for almost two-thirds of the country’s total energy consumption, despite the fact that huge deposits in the Volga-Urals basin had already been discovered.33
After World War II, efforts at first focused on resuming oil production in the Baku area, but subsequently, the extraction moved to the north to the Volga-Urals basin. Oil was first found there in 1929.34 By the beginning of the war, this region was producing over 2 million tons of oil annually. In 1944, large deposits were found during the war, but most drilling activities began only in 1955.
Daniil Yergin noted that “only a decade had passed since the time when Stalin was gloomily reflecting on the weakness and incapacity of the Soviet oil industry. However, huge investment and efforts have yielded results which made the Russian industry surpass its previous output levels. The new Urals and Volga region turned out to be a honeypot. Between 1955 and 1960, the Soviet Union’s oil production almost doubled, and by the end of the 1950s, the Soviet Union occupied the second place in global oil production after the United States, surpassing Venezuela. The actual Soviet oil output amounted to three quarters of the total Middle East production.”35
As for oil production in the Baku area, it failed to reach the pre-war (1940) level even in 1966, the post-war peak. Oil production in the Volga-Urals region was growing fast and reached its peak by around 1975.36 However, afterward, its decline was steeper than expected. This largely explains the immense pressure the oil industry experienced during the 1970s in Western Siberia, with the aim to sharply increase the output to make up for the decline in the Volga-Urals region.
The example of the increase in production and the exhaustion of the Volga-Urals oil-and-gas-bearing region during the Soviet era shows how unstable oil production can be. There are no “ifs” in history. What if Western Siberian oil was never found? How would it affect the national leaders’ decision to conduct the Kosygin reforms that aimed to raise the workers’ material interests in the results of their labor? Could the transition to a market economy have been carried out in an evolutionary manner, like in China, and not in a revolutionary one? History has no place for the subjunctive mood, but, proceeding from the political-economic explanation of resource dependence, it may have been likely.
Western Siberia became the third major oil-producing region in the USSR and the biggest one in the country’s history. While there were nearly twenty years between the discovery of oil deposits in the Volga-Urals region and the start of extraction (from 1929 until the end of the 1940s), this transition only took eight years in Western Siberia (1960–1968).
Gas was first extracted there in 1953. The authorities decided to terminate the geological exploration works in the northern latitudes when a telegram was sent from the little village of Beryozovo to the city of Tyumen about an emergency in a well which led to the discovery of the first Siberian gas: “Urgent. Tyumen. Oil geology. Shilenko. Outburst during retrieval of instrument. Head pressure 75 atmospheres. Waiting for airplane urgently. Surkov.”37
Thanks to the Beryozovo oil blowout, the presence of oil and gas in the Western Siberian Plain was proven for the first time. Other gas deposits were found shortly after the discovery at Beryozovo. However, the industrial use of gas was only planned for 1965, as the gas deposits were considered insufficient to plan and develop a main gas pipeline.38 The discovery of large oil and gas deposits became “a total surprise for the political and economic leadership of the country as well as for the staff of the USSR and Russian SFSR Gosplan, who had been encharged with planning the development of the oil and gas industry and who had been previously ignoring the decisions of the [Communist Party] on developing the oil and gas industry in Siberia.”39
The first oil blowout in Western Siberia was found in the Shaim oil field in 1960, after over five years of geological exploration. As a result of concentrating efforts in the Priobye area in 1961, a powerful oil gusher was found near a settlement called Megion, which launched the big oil period in Siberia. Other huge deposits were explored shortly after this, including the immense Samotlor field in 1965 (it was rapidly put into service; the first industrial well was completed in April 196840).
Almost all Western Siberian wells discovered in 1961–1965 were considered unique according to the existing classification, as the recoverable oil reserves of each of them exceeded 300 million tons. These deposits had extremely high well-production rates of over 100 tons per day (during the second half of the 1970s and the 1980s, they began to plunge, resulting in two severe oil production crises in the USSR). Also, by the end of the 1960s, geologists came to the conclusion that the Yamalo-Nenets Autonomous Region in the northern Tyumen Region had huge, unprecedented natural gas deposits.41
It’s important to note that Western Siberian deposits were located in extremely harsh climatic conditions (although less extreme than Eastern Siberian ones, which Russia plans to explore in the medium term). Almost impassable swamps occupy up to 70–80 percent of the region’s territory. Geologists could only work in the winter, when many swamps were frozen enough to be able to withstand heavy machines. During winter, temperatures drop to -30˚C (-22˚F)—and sometimes to -50˚C (-58˚F)—and there are strong northerly wind squalls. Initially, there were absolutely no communications or social infrastructure. In the fragile tundra of the northern Tyumen Region, even the slightest human intervention led to ravines and the complete destruction of the tundra’s lichen.42
The main negative consequence of Dutch disease is considered to be the fact that the processing industry, which usually suffers during the expansion of the raw materials sector, generates a lot more positive effects than the latter (although research shows that this is not always true). This example shows that the raw materials sector can lead to even more negative external effects by causing huge ecological damage to areas with a fragile ecological equilibrium.
If each ton of the oil sold included a tax equal to the damage done by its production, the costs of oil production would skyrocket (and the amount of oil rent would be reduced by the amount of the tax). Only a separate measure like this could serve as a catalyst for economic diversification (although one could object that some processing industries such as the chemical and metallurgical industries create highly negative externalities through ecological damage). In this case, the pressure to pay for externalities would lead to diversification in cleaner productions under the condition that the residents are rich enough to value good ecology.
After the discovery of Western Siberian oil and gas deposits, the authorities faced the issue of choosing a strategy for exploring the region, considering both its huge prospects and, at the same time, its remoteness and lack of development. In our opinion, the following point is very curious: in 1961, the new program, adopted at the Communist Party’s Twenty-Second Congress, planned to increase oil output five-fold by 1980, reaching 690–710 million tons. Gas output was planned to grow fifteen-fold, from 45.3 million to 680–720 billion m3 (all of this came as part of Nikita Khrushchev’s idea that “the present generation of the Soviet people will live under Communism”).
It’s also worth noting that growth in industrial output was supposed to be six times greater than growth in oil production, and growth in agricultural production was supposed to be three-and-a-half times greater than that of oil production43. In fact, despite the intensive exploitation of Western Siberian oil deposits in the 1970s, oil output by the USSR reached just 603.2 million tons in 1980, and the country was the world’s biggest oil producer. Even during the record-breaking year of 1987, oil output (at 625 million tons44) was way below estimates. The fact that these plans were drafted when there was no information yet regarding the biggest oil deposits makes this even more surprising.
Possible explanations are the planned steep growth of industrial output of about 9.9 percent annually (starting from 1962, the year after the Communist Party’s convention), the sharp increase in the vehicles-to-population ratio, and the substitution of coal with more energy-efficient oil and gas in the country’s energy balance. In this case, the annual oil production growth rate of 8.8 percent doesn’t seem too big (and assumes that the energy intensity of industrial production should have grown a little).
Broadly speaking, such industrial output growth rates are not completely unique, albeit they are very solid over the two decades. The Soviet Union’s previous experience and the unprecedented economic growth of Japan between 1955 and 1990, China between 1979 and 2007, and a number of other countries (mostly the East Asian tigers) showed that this was possible. But two factors need to be considered.
Firstly, it’s much easier to grow when the level of economic development is very low (and the Soviet Union in the 1970s was not underdeveloped). But a counterargument can be cited that back in 1960, the Soviet Union’s GDP per capita was almost equal to that of Japan (see figure 3), although the Japanese economy kept growing for thirty more years while the Soviet one started to slow down in the 1970s. Secondly, as a country becomes richer, the share of industrial output in its GDP declines and gets substituted mostly by an increase in the share of services. But, the Soviet Union’s service sector was underdeveloped compared to the service sectors in market economies, and, obviously, for this reason, industry and agriculture received the most attention.

On the whole, assuming that the Soviet economy grew at the same rate as the Japanese economy, it would still hardly be able to export considerable amounts of oil in the 1970s and 1980s. This assumption is very important since if oil and gas production efficiency (calculated as the percentage of material actually extracted from deposits) approached Western standards, output would grow much faster. Also, according to many studies, the Soviet Union’s oil and gas exports did not greatly depend on the conditions of world markets; rather, they depended more on the extent to which the demand for imported food and machinery had to be satisfied.45 In particular, there were statements that if market conditions were followed, the USSR was supposed to export considerably less oil in the 1970s when it was still quite expensive.
The United States is a good example. Between the beginning of the twentieth century and 1974, the country was the world leader in oil production, but it was never mentioned as a nation that suffered from the resource curse. The thing is, despite the economy’s high energy efficiency, its high level of economic development has led to the country consuming a great deal of oil, both by industries and households (thanks to the very high level of vehicles per capita), and it even had to import large amounts of oil. In 1988, the USSR consumed 7.7 million barrels per day, which made up about half of the United States’ oil consumption.46 Considering that the USSR had a population of 286.7 million (in January 1989) as opposed to the United States’ population of 244.5 million (in 1988),47 Soviet oil consumption per capita was just a little over 40 percent of the U.S. level. This means that if the USSR came close to the the United States’ level of oil consumption while maintaining the same energy efficiency, it would have turned from being an oil exporter into an oil importer. In 1977, the CIA prepared a set of reports that forecasted, in particular, a decline of oil output in the Soviet Union to 400 million tons, which would have made the country a net importer of this resource.48 However, this forecast was far from reality (in 1987, the country produced 625 million tons49).
This is why the Soviet Union had to export less and less oil as its level of economic development approached that of developed nations, especially considering the distances and the climate. This thesis is backed up by theoretical studies. It has been shown that the more developed the economy’s production sector is, the higher the price of raw materials extracted in the country should be in order for the migration of resources to the materials sector to commence. This issue was also pointed out in studies that attempted to determine adequate metrics of measuring a country’s resource richness. In particular, it was noted that a high share of natural resources in exports can illustrate weak development of the economy’s nonresource sectors rather than the fact that the nation exports too many raw materials.50 But even such a situation does not mean that there is no dependence on material exports as the currency supply is exposed to extremely high volatility due to the volatility of raw material prices and a high share of raw material exports.
In the beginning of the 1960s, when the giant Western Siberian oil and gas deposits had not been discovered yet, the authorities actively promoted the idea of building the Lower Ob Hydropower Plant (in 1961, Nikita Khrushchev talked about its construction as a resolved issue51). If this idea had been implemented, a large part of the oil and gas rich territory would have been flooded and apparently made impossible to use by the industrial oil and gas production at the existing level of technology.
In the first half of the 1960s, two main strategies were subject to debate regarding the further development of the country’s oil and gas complex. The first scenario can be considered moderate. According to it, Western Siberian deposits were supposed to be actively explored in the short term. In 1965, Nikolai Baibakov, the head of the USSR Gosplan’s State Oil Industry Committee, claimed that by the beginning of the 1970s, the optimal oil output in Western Siberia should amount to 15 million tons, and by 1980 it should reach 200–250 million tons, with another 450–500 million tons extracted in the European part of the country.52 In reality, oil production in the region reached 31 million tons by 1970, 145 million tons by 1975, and about 210 million tons by 1977.53 Thus, Western Siberian oil production had a rapid start but it also became exhausted much earlier than had been anticipated.
Active export of oil and gas to distant foreign nations was also not planned. According to the advocates of this scenario, its implementation did not have any serious risks. But this was based on the assumption that the Volga-Urals oil-and-gas-bearing region still had significant and relatively easy-to-extract oil deposits. Indeed, its oil production in 1965 (173.5 million tons) was still far from the maximum that it reached ten years later (about 225 million tons). However, in 1980, output was 188 million tons; it fell to 135.5 million tons in 1985, and only 109 million tons in 1990.54 But what is even more important than how it was falling is the fact that it was doing so faster than the authorities expected (experts started to point toward negative trends in the mid-1960s55). Moreover, in the mid-1960s, many experts working in Gosplan and the oil and gas industry did not expect that this could happen at all.
The moderate way generally presumed that a bird in the hand is worth two in the bush. But, as often happens, its advocates did not know that it was even more risky than the exploration of Western Siberia. In the 1960s, Gosplan considered the second option of active exploration of the Western Siberian oil-and-gas-bearing region to be a very risky one. For example, in the early 1960s, the deputy head of Gosplan responded to the offer from senior Tyumen officials to establish annual production of 10–15 million tons of oil without even checking the geological maps in front of him, saying that “the huge oil and gas deposits frequently mentioned by the Tyumen people are nothing more than a creation of a provincial and sick imagination. . . . They need to stop messing with everyone’s heads and do their business.”56
Nevertheless, the advocates of the second option included the ministers of the oil and gas industry and the geology minister, so this strategy won. Its supporters cited solid arguments. Firstly, thanks to the existence of huge deposits, existing resources could be focused entirely on exploration, without even touching other deposits. Secondly, the Tyumen deposits were relatively close to the European part of Russia (and also near the extremely large Urals industrial region), much closer than the deposits around Baku and Grozny, in proximity to the state border. Consciously damaging them in order to prevent Nazi Germany from using them had put the Soviet Union’s oil availability at risk (lend-lease supplies helped a lot) and also led to a steep drop in production after the war.
Finally, the costs of exploring Western Siberia were supposed to be reduced by the broad use of a rotational system of work in which workers did not need permanent places of residence and all the necessary infrastructure. Nikolai Maltsev, USSR oil industry minister from 1977 to 1986, confirmed that “undoubtedly, the country didn’t have the necessary financial, material and technical resources. . . . The desire to quickly explore this huge region and get maximum returns with minimal costs has led to the situation in which the issues of long-term infrastructure planning were not paid the attention they needed.”57 The emphasis on the second option—the intensive one—has paid off (from the medium-term perspective, up to the beginning of the 1980s). After 1965, eleven of the biggest deposits were discovered, five of which had over 1 billion tons of initial in-place resources (Samotlor had 6,684 million tons; Fyodorovskoye had 1,822 million tons; Mamontovkoye had 1,349 million tons; Lyantorskoye had 1,954 million tons; and Priobskoye had 1,987 million tons).58
Overall, a pattern in the Soviet Union’s oil output can be observed: the country began to explore oil in a new area when the output in the previous major area started to drop (it was often reducing faster than expected). The production in the Volga-Urals region, which started at the end of the 1940s, compensated for the fall in output from the Baku area. In turn, Western Siberian production compensated for the decline in output from the Volga-Urals region (and each time the authorities managed to make output more than it had been previously).
Despite the sharp increase in production in Western Siberia, the country’s establishment demanded the extraction of even more oil. The oil sector workers who supported the demand were called “optimists,” and those who were against it were called “pessimists.” As Valeriy Grayfer, the last head of the Main Tyumen Oil and Gas Department (Glavtyumenneftgaz), recalled, “it was fairly dangerous to be dubbed a ‘pessimist’. It does not mean you are an ‘enemy of the people’, but it means the end of your career. That’s why ‘optimistic’ plans had to be implemented at all costs.”59
In 1977, after a tough talk with then oil minister Nikolai Maltsev, who demanded a boost in output then head of Glavtyumenneftgaz, died of a heart attack. His successor, Feliks Arzhanov, was fired in 1980 for attempting to maintain the 1985 production plan at the level of 340 million tons (in 1980, a total of 312.7 million tons were extracted in the whole of Western Siberia), while Gennady Bogomyakov, then first secretary of the Tyumen Regional Committee, demanded that production be increased to 365 million tons.60 In the early 1980s, hundreds of men at the wheel of the Western Siberian oil industry, including two future heads of the Central Committee, were fired for failing to meet the overstated plans.61
It could be that the planned economic system, or, to be exact, the system of incentives it created, was largely to blame for the impossibility of a rapid increase in output. For instance, as the planned numbers were usually set in units of a physical quantity, the number of meters drilled was a reasonable indicator for geologists. It seemed that the larger this number was, the better geologists worked. But geologists soon realized that the deeper they drilled, the harder it was to drill.62 As a result, geologists soon developed a practice of drilling small wells. As a newspaper article stated, “deep drilling means a lower pace of work and lower bonuses.”63 But without drilling deeper, it was impossible to boost oil production at the same pace, as new deposits were getting smaller. According to geologist John Grace, “the Soviet planning system had nothing to do with it; it was just a reflection of the Gauss distribution of the size of deposits observed around the world.”64
Maybe this luck, and the huge geological exploration efforts, did more harm to the Soviet Union (and Russia in the 2000s). The appearance of huge new oil and gas deposits made it possible to postpone the transition to more efficient energy use further and further. What is just as important, it led to extremely high volatility of output (and, therefore, of oil exports and revenues), which is considered one of the main manifestations of the resource curse (only under certain conditions, linked to the fact that the country doesn’t have good instruments to overcome the volatility of revenues, such as a stabilization fund or a developed financial market).
Rent is payment to a factor of production excluding the minimum payment needed to maintain the current level of this factor’s supply. In the case of oil and gas, resource rent is excess income on top of normal income received from investments with normal profitability. In other words, rent is revenue from selling a resource minus its production costs. Thus, rent equals economic profit—the difference between revenue and economic/alternative costs (including the amortization of fixed assets and normal returns on the invested capital).
Frankly speaking, this is not the most correct definition of rent. In a strict sense, resource rent is the sum of differences between the price and marginal costs of resources (not necessarily natural). If a deposit has the economy of scale effect, then, as production increases, the rent from every additional item of a resource (marginal rent) first increases (until the marginal cost stops diminishing) and then starts to fall. Marginal rent disappears completely at the moment when the resource’s price starts to equal its marginal cost (but the rent still exists, as it equals the sum of marginal rents from all the items of the resource).
Mechanisms of extracting and distributing rent in the USSR were quite unusual and mostly hidden. The energy sector had been developing, first and foremost, in order to provide the military-industrial complex and heavy industry with resources and earn hard foreign currency to fund key import needs. The lack of transparency in these mechanisms was very handy for the Soviet government, as it allowed it to attribute economic and social successes to the “advantages of the Socialist system,” rather than to the profits from using cheap natural resources. The success of the Soviet Union’s transformation to a modern industrial nation was largely determined by a set of various high-quality raw materials (to be fair, it should be noted that the success of the United States was largely determined by the same thing).
The government (represented by the State Committee on Prices, interacting with industry-specific ministries) was setting domestic prices in the Soviet Union for extended periods of time. They were heavily marked down compared to world prices. There were three sets of prices: wholesale prices of enterprises (producers’ prices); wholesale industrial prices, different from the producers’ prices as they included costs and profits of transport companies (plus the turnover tax in the case of refined products and natural gas); and end sale prices (differentiated by the type of consumers in the case of natural gas and electricity), which exceeded the wholesale industrial prices by the amount of costs and profits of trade intermediaries or distributors.65 The difference between end prices on refined products (gasoline, diesel fuel, lubricating materials, black oil fuel) or natural gas and the prices (on crude oil or natural gas) of producers was the main rent-extracting mechanism. The turnover tax composed the principal part of this difference.
In the mid-1980s, the ratio between the average wholesale price on crude oil and the retail price of 93-octane petrol was about 1:17. Thus, the share of indirect taxes or turnover tax (which helped extract the rent) in these products’ retail prices amounted to about 80 percent.66
Describing the methodology of calculating the resource rent, Gaddy and Ickes point out that “both the revenues and the costs of production must be considered in relation to the most profitable alternative use of resources. First, the revenue from selling a resource must be considered potential revenue that could have been received from selling the resource at a market price, rather than as actual revenue received from the sale. . . . In the same way, the cost of production is not the reported cost of production at any moment of time, but the cost that could have been established under the efficient organization of the industry, i.e. the cost of production in a competitive market.”67
They suggested referring to this cost of production as natural production costs, and to the surplus as excess costs. Thus, even if a material is traded below the world price, according to this calculation methodology, this doesn’t reduce the resource rent received by the country. In a similar way, if excess value (of extraction) appears during the extraction of raw materials, it is also included in the calculations of resource rent. In other words, if an economic agent doesn’t receive the full amount of rent (and/or the government is a part of this rent), a share of this rent goes to someone else or to consumers (who buy at an underrated price) or to suppliers of resources for production (who sell at inflated prices). According to the authors, the omitted amount is an integral part of the rent, and its existence itself reflects decisions regarding the use of wealth. We’ll describe the amount of resource rent and distribution following Gaddy and Ickes’s methodology:
Rt = PtQt — Ct,
where Rt is the actual rent over the t period, P is the current spot price, Q is the actual extracted volume, and C is the natural cost of production.
If we take the actual production costs Ĉt = Ct + εt, where ε is the excess value of production, the corrected rent will be R = PtQt – Ĉt = PtQt – Ĉt – εt. Then, assuming that from each item of a resource, the consumers will be paid a subsidy ρ, the actual price of the producer is Pt = Pt – ρ. Then we can assume that there are taxes—formal and informal (such as bribes for government officials and involuntary support of the social sector of the city or the region). To make things more simple, assume that they make up a fixed share of profits: τ for fixed taxes and τ' for informal taxes. Thus, profits after tax can be expressed in the formula:
π't = (1 –τ –τ')πt = (1 – τ – τ')[PtQt – Ĉt]
This is what is left for the owners of an enterprise. But the R variable is important for society. It can be expressed the following way:
Rt = (1 – τ – τ')[PtQt – Ĉt] + τ[PtQt – Ĉt] + τ'[PtQt – Ĉt] + ρQt + εt
Thus, rent can be divided into five categories:
All these categories need to be taken into account during the calculation of rent. The first reason for this is that it’s impossible to measure the real scale of total rent without considering certain ways of distributing rent. For instance, the Soviet Union provided huge subsidies to both domestic and foreign (Comecon nations) energy consumers. Production costs were routinely amplified for various reasons, such as the need to boost output above the optimal pace under the pressure of federal authorities, and the necessity of not using the best production resources available (the oil and gas complex, albeit to a lesser extent, also experienced the scarcity of necessary resources). The second reason is that these categories are used to hide and redirect flows between stakeholders of the rent. The size of the share of each category of participants has important political-economic consequences. Essentially, it largely determines the political economy of the society, which lives off resource rent.
Unfortunately, there are several technical difficulties that considerably reduce the accuracy of calculating the total oil and gas rent both in Soviet and post-Soviet Russia. As we already mentioned, a correct estimation of total rent means that we have to consider the difference between the price and marginal costs. The figure of marginal cost is almost always unknown. That’s why economics usually uses average costs, the data on which is available, as an approximation. The accuracy of an approximate estimation depends on how fast marginal costs were growing when the output was increased to the actual level. If the output of low-cost deposits is stable and has a large share in the country’s total output, then the rise of marginal costs of the new deposits doesn’t have a remarkable effect on average production costs (that is, figures of marginal and average costs don’t go separate ways during the increase of production). If the share of output with rapidly growing marginal costs in the total production is large, the figures of marginal and average costs diverge quite considerably. Then, using average costs in calculating rent will significantly overstate its amount. Gaddy and Ickes consider that the first assumption about the slow substitution of low-cost deposits by high-cost ones is true.69
Another controversial issue is how to consider different types of fixed costs, first of all, capital expenditure. In other words, should the costs of pipelines, geological surveys, and so on, be considered? Under the formal definition of rent, there is no need to do this, as rent emerges when the actual prices exceed the minimal price, forcing a company to supply raw materials to the market. And in the short term, the company has no opportunity to avoid nonrecoverable capital investment (that is, in the worst case, it is ready to downplay the prices until the loss exceeds the amount of amortization of these capital investments). Any situation better than the very worst one—the lack of money to pay for amortization—brings the rent.
The authors define natural value as value corresponding to a competitive manufacturer who uses market interest rates and maximizes the expected discount cost of deposits.
It is not clear how the authors drew the difference between actual and natural oil and gas costs. As can be understood from their argument, by natural costs they mean the best result the USSR could have achieved under a certain technological and organizational level of its energy sector.70 Unfortunately, the authors analyze the distribution of oil and gas rent by the five above-mentioned components only in post-Soviet Russia. Figure 4 below represents oil and gas rent in the USSR and Russia between 1950–2010 (in 2011 prices).

This leads to certain conclusions. First, oil and gas rent was fluctuating heavily. There were two periods of huge growth: between 1974 and 1981 (from the start of the first price shock until the drop of prices after the second price shock) and between 1999 and 2008 (that coincided with the start of the Russian economy’s rapid recovery after the 1998 crisis), which were then followed by sharp downturns. Notably, the drop after the first peak (1980) was much longer and stronger than after the second one (2008). However, the analysis should be prolonged to the present time, as another downturn started in 2014, the end of which is still unknown (some researchers think oil prices will never fully recover due to the technological revolution both in cheaper alternative energy sources and in oil and gas production.) “At the peak, in 2008, rent amounted to $650 billion, which is bigger than the Russian GDP for any year before 2003. Over the period between 1999 and 2011, the average rent amounted to 33 percent of GDP and in the Soviet period . . . approximately to 11 percent of GDP.”71
However, we should make two notes that make the calculated data different from reality. Firstly, we are dealing with potential rent, calculated on the basis of the difference between world prices and minimal possible costs. In particular, this means that a considerable part of rent went not to the country itself, but to the countries receiving oil and gas at subsidized prices. This also means that sales would plummet both domestically and abroad if the subsidies stopped, and this would lower the overall volume of rent. Thus, potential rent exaggerates the total amount of rent.
Another issue is that if oil and gas were supplied to subsidized countries at world prices, Russian GDP would increase (real GDP of the current year is the volume of production of this year, measured in prices of a basis year—f we use world prices instead of the subsidized ones, the prices of the basis year will rise, and so will the current year’s GDP). That’s why the actual share of oil and gas rent is lower than the cited figures.
Secondly, starting from the mid-1970s (and until the early 1980s), gas rent approximately equaled oil rent, and for many years after 1991 it was about twice as big as oil rent. On the whole, we can see that gas rent was a much more stable part of the total rent than oil rent. Considering the huge size of gas rent and its relative instability, this poses the question: if Russia suffers from oil and gas dependence, which factor is the main one behind this dependence—oil or gas?
These resources are considerably different in the volume of required investment. Transportation of gas demands huge capital expenditure on constructing gas pipelines and compressor stations, but the marginal cost of its extraction and transportation are relatively low. Extraction and transportation of oil demands smaller capital investment but at a larger marginal cost. If gas deposits are located far from consumers, control over deposits makes little sense if there is no control over pipelines. In theory, the resource curse is strongly associated with concentrated resources, that is, those located within a limited area, which are, due to this reason, easier to control. The ease of control is associated with the temptation to acquire this control, which, given the weakness of government institutions, can lead to armed conflicts (which has often happened in many African nations).
The authors consider two possible scenarios: the baseline (production costs of $10 per barrel of oil and $20 per 1,000 m3 of gas, in 2011 prices) and the scenario of increasing costs (supposing they have been growing 2 percent annually between 1970 and 2011). Figure 5 illustrates both scenarios.

In the second scenario of 2 percent annual growth of marginal production costs the rent does fall, but insignificantly. In particular, in the peak year of 2008, the rent dropped from $650 billion to $600 billion. During low-price years, such as the end of the 1990s, the rent was significantly below the baseline scenario. During high-price years, according to the authors, the difference was no more than 10 percent.72
Now, let’s take a look at the estimation of the Soviet oil and gas rent, calculated in Matthew J. Sagers, Valery Kryukov, and Vladimir Shmat (see table 2).73

According to the authors, crude oil production costs (transportation included) in the mid-1980s amounted to a little over $40 per ton (or $5.33 per barrel),74 with the world oil price of $240 per ton (as opposed to Gaddy and Ickes, they take the actual crude oil and gas production costs, including the normal level of profitability on the invested capital instead of the so-called natural costs).75 This was yielding rent of $150–$200 from each ton. In fact, the Soviet Union’s rent income was much smaller, as about 60 percent of oil and petrochemicals exports were going to the Comecon nations at prices well below the world level (these nations paid on average $7–$9 per barrel of oil, which is about one third of the world market price; a similar situation existed on the natural gas market).
Considering that about 70 percent of the produced oil and 87 percent of gas were consumed domestically at well below world prices, the main share of oil and gas rent went to prop up the industries that were uncompetitive on the global scale. Given this, we have to remember that a large part of the industry was military. That’s why cheap energy supported the huge, by international standards, but very energy-intensive military and industrial complex.
Then, the authors add to the amount of rent ($153 billion) the difference between the revenues from the sale of petrochemicals at world and domestic prices, counting it as part of the oil and gas rent (and estimating that it composes at least 50 percent of the rent coming directly from oil and gas). They evaluate the total rent at about $250 billion. Despite the differences in methodology, the estimation of rent in the mid-1980s was approximately the same in both studies. They also suppose that the total oil and gas rent made up about 40 percent of the USSR’s budget.
According to other estimates, the maximum amount of Soviet oil and gas rent was $270 billion in 1980–1981, while in 1986 and later, it dropped below $100 billion.76 This was mostly linked to the drop in world oil prices, but the production expenses also played a part—they grew by two-thirds between 1983 and 1987.
Despite the differences in the presented estimates of Soviet oil and gas rent, it’s clear that in the second half of the 1980s, it sharply declined, making the USSR’s economy less and less stable.
Lvov and Pugachev,77 using the input-output data of Russia for 1991 at world prices, tried to estimate the volume of indirect subsidizing of the economy with the help of oil and gas rent. According to their estimates, the extraction industries created all net profits of the economy (270.3 trillion rubles) and also compensated for the losses carried by many other industries, such as agriculture (53.1 trillion rubles) and transportation (11.3 trillion rubles).
It’s important to remember that a country’s amount of resource rent does not reflect the extent to which the country is exposed to the resource curse. What is important is the following:
Even the fluctuations of these two kinds of rent result in different incentives of economic agents inside the country. As the resource rent of a country often (but not always) weakly depends on its actions, it often leads to the above-mentioned “get-rich-quick mentality” among entrepreneurs and “boom-and-boost” psychology among politicians. This happens because of the high uncertainty regarding the maintenance of this rent, and this is known to make economic agents discount future revenues and focus on the short-term horizon. Technological rent apparently doesn’t cause these developments in such an over-the-top way.
Thus, speaking about the amount of resource rent, we should keep in mind a set of particular factors linked to its effect on the incentives of economic agents. But in our case, we speak about oil and gas rent, which reduces the array of possible characteristics linked to it (although it could be very broad).
Energy is the necessary basis of any economy, and the Soviet Union in the late 1980s was the world’s biggest oil and gas producer and the third-biggest coal producer. But despite this, within its last ten years, it experienced grave problems caused by its fuel and energy complex. They were not linked to the shortages of oil and gas, but rather had to do with rapidly increasing costs (of exploring, extracting, and transporting materials), huge inefficiency, repeated shocks, and other unpleasant surprises. The policy aimed at solving these problems was so high-cost and demanded so much attention that it became the main undermining factor of the situation with the Soviet industry after the mid-1970s and one of the main direct reasons behind the downturn and stagnation of the Soviet economy.78
Mikhail Gorbachev, the last Soviet leader, seemed to realize that the state energy policy was one of the main causes of economic problems. He claimed that the struggle to curb the economic downturn rates had led to excessive spending on the expansion of the fuel and energy complex and boosted supplies of new resources and their irrational use.79 According to Gorbachev, one of the main directions of this was the excessive export of energy resources. At the same time, the hard currency received in return for resources was spent on current needs instead of the modernization of the economy. In Gorbachev’s mind, Leonid Brezhnev was the main person to blame for this. Gorbachev himself was unable to break the policy, which began under Brezhnev, of a rapid growth of investment in the fuel and energy complex and the inability to introduce energy-saving policy.
The reaction of the Soviet Union and developed nations to the energy shocks of the 1970s is indicative. In response to the rapid growth of the relative oil price, a technological boom started in the West that affected geological exploration and extraction of natural resources and the search for energy-efficient technologies and alternative energy sources. The heavy dependence of energy-resource consumption on economic growth had disappeared due to the widespread use of energy preservation. Oil consumption was reduced both in absolute figures and as a share of the total energy balance. In the USSR, attempts to boost oil production (and atomic energy) were the principal response. Energy saving efforts mostly failed. The irony is that the most powerful stimulus for the Soviet energy-saving policy was not the growth of oil prices in the 1970s, but their drop in the 1980s. This sharply reduced the inflow of foreign currency and made the Soviet Union export more oil.
The domination of heavy industry in the demand structure was an extremely important reason behind the USSR’s inability to curb energy consumption. In the West, a significant share was composed of private automobile and house owners, who reacted to the changes in energy costs much faster (although industrial consumers also reacted much more swiftly).
It’s widely known that the rise in oil prices in the 1970s led to an energy crisis in most developed nations, but at the same time, became a powerful catalyst for increasing the energy efficiency of their economies. Unfortunately, the Soviet Union lost that opportunity. This is a paradox: when a country has the opportunity to make the necessary changes, there is no longer the desire to do so (as in most raw-materials-exporting nations during resource booms) and, on the contrary, when the opportunity to conduct changes is sharply reduced, the willingness to make changes caused by acute necessity sharply increases.
This paradox is one of the symptoms of the resource curse, which lies in the drop of the quality of economic policy, when long-term goals become increasingly neglected for the sake of achieving short-term ones. This could be explained both from the viewpoint of rational economic behavior, when economic agents value the future less due to the increase of discount rates by the government, companies, and households, and this rate grows due to increasing uncertainty regarding the country’s future revenues from raw materials; and from the viewpoint of the behavioral approach to economic activity (which also increases due to the growth of uncertainty about the future).
This situation can be analyzed in the categories of the substitution effect and the income effect. As oil rapidly gets more expensive, even with the same real incomes, it gets more profitable for companies, households, and the government to substitute it with other energy sources (the substitution effect). As real income in nations heavily dependent on oil imports goes down when oil is expensive, and the demand on oil incomes has a positive elasticity (quite high, but less than one80), oil demand also falls due to the income effect.
In the Soviet Union, the substitution effect was also supposed to work. It’s better to export oil when it gets more expensive and substitute it with other energy resources in domestic consumption. But, as we already mentioned, the planned system was, firstly, unreactive in regard to making such decisions, and secondly, the viewpoint that domestic consumers are more important than foreign ones was still influential. The income effect for the USSR as a large oil exporter was positive, that is, it increased the domestic demand for oil (of course, a separate study is needed in order to understand how the growth of oil revenues in the 1970s led to the growth of military expenses, vehicles-to-population and vehicles-to-industries ratios, and so on, and how it affected the demand for oil).
The USSR was no exception in providing energy subsidies to domestic energy consumers; such a policy is widespread among nations rich in oil and gas. From what was said above, we could assume that these nations were leaning toward suppressing the substitution effect, the effect of which, through intensive adoption of alternative energy sources and energy-saving measures on the whole, helped them survive the periods of low raw materials incomes much more easily.
In order to analyze the effect of increased oil incomes on the energy efficiency of oil, let’s take a look at the dynamics of the Soviet GNP’s energy intensity (see table 3). We notice that the energy intensity of Soviet GNP, after staying at the same level in the 1960s, sharply increased in the 1970s, and then grew slightly in the 1980s. Between 1960 and 1973, the amounts of energy used in the OECD nations and in the Soviet Union were growing at the same rate as their GDPs. According to other estimates, since 1973, energy consumption in the OECD was growing four times slower than GDP, and in the USSR it was growing 16 percent faster than GDP.81

There are alternative Western estimates of the correlation between GNP growth and energy consumption in the USSR between 1960 and 1980 (see table 4). We can note that between 1950 and 1965, the elasticity of energy consumption by GNP growth was more than 1,82 while between 1965 and 1975 it was below 1. The sharp increase in the efficiency of energy use is largely explained by the transition from the less efficient hard fuel (mostly coal) to the more efficient hydrocarbons (oil and gas). At first sight, the change of trend in 1975–1980 is unusual: energy consumption had been growing much faster than GNP. But the explanation may be simple: by the mid-1970s, incentives to save energy started to disappear under the influence of oil and gas abundance.

It should be noted that according to credible Soviet estimates, energy intensity of production was falling (see table 5).83 But instead of GDP or GNP, they looked at national income (it was growing faster than GNP, as it doesn’t include social expenses and services, which grew slower in this period).84 It can be seen that over two decades, the energy efficiency of the USSR’s national income decreased by 22 percent. But the biggest drop of 17 percent happened between 1960 and 1970, while in the 1970s, the period of fast growth of oil output, the energy efficiency dropped by only 6 percent (compared to the 1970 level).

Analyzing the overall efficiency of energy use, experts distinguish between two types of energy intensity85: the first one is the efficiency of end energy use (that is, how many items of national income are created from one item of end energy, usually electric power) and the second one is the efficiency of transforming primary energy (of various kinds) into end energy. In the 1960s–1980s, the main benefits in energy savings—three-quarters—were achieved by decreasing the second kind of energy efficiency. This happened, among other things, at the expense of the shift of primary energy consumption from coal to oil and gas (the share of coal was reduced from 52 percent to 24 percent86). In this sense, the Soviet Union, with a delay of a few decades, was following in the footsteps of many developed nations, by sharply boosting oil and gas intensity of GDP (although the transition to gas took longer) and respectively reducing the intensity of coal use.87 Almost 90 percent of the new demand for energy resources was satisfied by oil and natural gas with the costs twice as cheap as those of coal.88
The authorities failed to reduce the efficiency of end energy use in the 1970s (see table 6). Also, it could be noted that while the energy efficiency coefficient increased from 31 to 39 percent in the 1960s, in the 1970s it grew just a bit, from 39 percent to 42 percent. In the beginning of the 1980s, experts in the energy sector realized that “the abundance of cheap energy resources led to a notable weakening of the energy saving trend already taking place in the 1970s. . . . The energy component of most products’ prime costs was reduced to 5-7 percent, which greatly decreased the incentives to save energy resources. . . . The end of rigid limiting . . . also facilitated the drop in interest in energy preservation during operations.”89

However, what was even worse, energy efficient measures started to be considered economically inefficient when planning new equipment, objects, and enterprises in many sectors of the economy and in prospective developments on the whole. One of the reasons for this was the baseless extrapolation of the prospect of very favorable conditions of economic development in the 1960s.90
In the 1960s, the Soviet economic science developed a notion of “closing costs”—the maximum amount of expenditure on the increase of production of a particular product for a certain period (this definition is close to the notion of marginal cost, used in world economic science).91 Future costs of extracting natural resources were supposed to be evaluated by their closing costs, that is, considering the fact that deposits with worse production and transportation conditions would have to be used.
This methodology of estimating costs was adopted only in the beginning of the 1970s, but within two to three years it became clear that even these estimates were understated (it’s important to remember that while calculating the marginal cost of oil on the domestic market, one has to consider not only the cost of extracting an extra ton of oil, but also how much money this ton would have brought if exported). It’s commonly believed that in a planned economy, enterprises don’t have sufficient incentives to cut costs, but still, as confirmed by the argument above, these incentives can change and are influenced by the flow of incoming resources. In this case, we can say that economic agents were getting used to the increasing flow of oil and gas rent, and it was reproduced through the resulting stock of material capital.
Nevertheless, the Soviet economy turned out to be incapable of adequately reacting to the sharp growth of marginal oil production costs (which tripled in the 1970s and 1980s92) and the increase of world oil prices. The first factor was supposed to create incentives to boost the efficiency of extraction and transportation of oil, which is what one can expect from a market economy. The situation with gas in the Soviet Union was completely different. The developed gas fields were so huge that the marginal cost of exploring them was minimal. As the oil industry was the cash cow, its well-being was a priority.
This poses an interesting question: how would the rise of efficiency of oil and gas production to the frontline world level affect the emergence of the Soviet Union’s oil and gas dependence? On the one hand, it would make it possible to considerably boost the output with the same costs and, thus, increase the available oil rent. This would result in larger economic growth rates during the downturn (in 1986 and the following years).
But how would this affect the Soviet leadership’s incentives to diversify the economy? Higher volumes of oil and gas income would have made it possible to conduct even more massive procurements of food (and increase subsidies to the stagnating agriculture sector), consumer goods, and investment goods. So, possibly these industries would create even more problems. Thus, it’s quite likely that the relatively low (by world standards) efficiency of the Soviet oil and gas sector did not allow the economy to become even more dependent on oil and gas.
During World War I and the Civil War, oil production in Russia suffered a lot but then started to recover. In 1918, oil exports amounted to 2 million tons (almost half of the annual production). Between 1929 and 1932, they made up between 3.9 million and 6.1 million tons. By 1939, they dropped to 0.4 million tons. During World War II, there were no exports; in 1946–1949, exports were also almost nonexistent (0.5–0.9 million tons), and they only slightly exceeded 10 million tons in 1956.93
After this, exports rapidly grew: up to 57 million tons in 1964, 111 million tons in 1970, 183 million tons in 1980, and 216 million tons in 1989. The share of exports in oil production had also been increasing: from 11 percent in 1954 to 25.3 percent in 1964, and finally to 35.5 percent in 1989 (see table 7).94 One could note that the Soviet Union was exporting large volumes of oil compared to output in the first few years of industrialization (1929–1933), when the share of exported oil in the total output stood at 28.5 percent. This share is comparable to the level of the 1960s and 1970s, the period of the highest rise in oil exports. But oil dependence was not an issue back then as absolute volumes of exports were small and prices were not highly volatile.

Prior to the mid-1950s, Soviet oil was consumed inside of the Soviet bloc. But by 1955, the USSR had resumed commercial oil exports to the West. According to Daniil Yergin, “The Soviet Union was ready again to take on the role of a big oil supplier to the West that Russia had played in the 19th century. It was looking for any buyers and scaled down prices in order to attract them. In Washington, they called it a ‘Soviet economic offensive.’”95 Between 1960 and 1980, net energy exports grew almost 10 percent per year (compared to the 4.4-percent growth of domestic energy consumption).96
On the whole, surprising as it is, the attitude toward exports was somewhat neglectful. In particular, some of the most praised experts in the USSR energy complex wrote in 1983 that “world prices on energy resources, first and foremost, hydrocarbons, are currently much higher than domestic prices. This poses the question to what extent the USSR should consider such export-import connections in developing its energy sector. One answer seems obvious: the average damage from short delivery of energy resources inside the country was much higher than the effect from its exports.”97 However, the authors then stated that measures on the more economical use of energy resources and energy in the country could become the source of extra resources for exports.
Although the Soviet Union was a big exporter of all energy resources before the 1970s, it supplied only a fraction of their total output volume to foreign markets. In 1950, less than 1 percent of the total USSR energy resources production was exported; by 1960, this share rose to 8 percent, and by 1970 it increased to 14 percent. Along with this, the share of oil and petroleum products over the period between 1950 and 1980 was more than 80 percent (in the second half of the 1970s, gas exports started to grow quickly and their share in the total value of exports in 1980 amounted to 16 percent).98 According to alternative (Western) estimates, the share of energy resource exports in the total volume of their production reached 7.1 percent in 1960, 11.9 percent in 1970, 15.8 percent in 1980, and 16.7 percent in 1988.99
The hike in world oil prices was affecting the Soviet oil industry slightly differently than other oil-exporting nations. They obeyed (and still obey) the famous rule: with an increase in the price of an item (oil), the volume of its supply needs to grow to get more profit. The Soviet Union’s behavior on the world oil market often ran contrary to this logic. There is evidence that in some periods its supply curve sloped downward.100 In other words, it could have sold more oil when it was cheaper and exported less when it was getting more expensive. For instance, in 1980, 1985, and 1986, the crude oil exports in freely convertible currency amounted to 27.4 million, 28.9 million, and 32.1 million tons with the prices,101 equaling respectively to $87.65, $50.11, and $25.63 per barrel.102
One Western research paper pointed out that “the Soviet Union was the only big industrial nation whose policy was aimed at ensuring a never-ending increase of raw material output in order to achieve sufficiency for itself and its allies, as well as to export them to get hard currency. This policy wasn’t linked to implementing the country’s relative advantages and did not take into account fluctuations of world prices on natural resources.”103
The thing is that the USSR had been striving to stabilize the total amount of export revenues in hard currency in order to ensure more or less stable volumes of imports (see the data on wheat and other agricultural imports below). Daniil Yergin also points at this, but in regard to the industrialization period: “The Soviet Union, without thinking, would cut the prices, when it saw an opportunity to boost profits. It was a stranger to normal commercial motivation. The Kremlin demanded that Russian trade organizations earn as much foreign currency as possible to pay for the equipment that Russia needed for industrialization.”104
Starting from the mid-1980s, the oil and gas sector, on the one hand, became the main source of the Soviet economy’s vulnerability, and on the other, despite this, the main hope for receiving hard currency. This resembles Giffen goods—goods for which the amount of demand rises along with the increase in their price. This happens due to a combination of two effects—the substitution effect and the income effect. Due to the former, a Giffen good gets more expensive compared to other goods and the amount of demand for it drops. The income effect acts in the opposite direction; demand for such goods drops sharply with the increase of income (that is, these are inferior goods) and falls to the level that it exceeds the increase of demand due to the substitution effect.
But what does it have to do with the drop of oil prices in the 1980s? According to conventional logic, when oil got cheaper (meaning that the real exchange rate of the Soviet ruble dropped), the Soviet Union was supposed to export less oil and more other goods. But instead, it started exporting even more oil! In fact, at the moment it didn’t have a choice. Most other goods were so uncompetitive (or, maybe were produced in insufficient quantities) that it would take either a significant drop of their prices in dollars or an unbelievable growth of exports in order to compensate for the shortfalls in oil exports revenues.
The unbelievably strong (and increasing since the 1970s) dependence of the Soviet Union on, first of all, imports of wheat and a number of other categories of consumer and industrial goods, especially high-tech ones, became one of the plates in its armor (table 8 has the data on the wheat and agricultural goods trade balance105). However, we can assume that this explanation of the emergence of oil exports dependence is incomplete; it seems that there was a two-way dependence. In other words, the growth of oil and gas exports, bringing more and more hard currency, encouraged the authorities to import even more wheat and other products. The increasing imports made the Soviet Union include large volumes of oil and gas (mostly oil) exports in future plans. When oil prices increased (and they continuously increased between 1974 and 1980), there was a temptation to boost imports even more.
For instance, at a Politburo session in May 1984, then premier Nikolay Tikhonov said: “The oil we sell to capitalist nations mostly goes to pay for alimentary and some other goods. In this regard, it seems feasible to provide for a reserve for possible extra oil supplies of 5-6 million tons over the five years when a new five-year plan will be developed.”106 There is a lot of evidence that, by the beginning of the 1980s, the Soviet Union developed a strong dependence on oil and gas exports. Then Ministers Council chairman Alexey Kosygin is known to have personally addressed the head of GlavTyumenneftgaz with requests like this one: “We’re short on bread — give [us] 3 million tons above the plan.”107 Carrying and lifting equipment, ships, and agricultural machinery became the main articles of imports. Imports of oil and gas equipment surpassed record heights; from 1970 to 1983, they increased eighty times in terms of value. And their physical volume increased by thirty-eight times.108]

The above-mentioned publication, The USSR Energy Complex, notes that “between 1960-1980 . . . a significant cheapening of energy had a beneficial effect on all industries of the economy, [and] by saturating them with energy, made it possible to significantly raise the productivity of the public labor.”109 Such an approach to natural resources was typical for the Soviet planning authorities, and they had been ignoring alternative costs of domestic energy consumption for a long time in the form of shortcomings in revenues from its exports.
There is a conventional theoretical justification of subsidizing inefficient production if the stated cost of positive externalities from such subsidies (in the form of inside-company, inside-industry, or inter-industrial “learning-by-doing”) exceeds the losses from profits not received from the export of goods. But the Soviet Union conducted “classic” import substitution policy without constantly increasing the requirements for the subsidized enterprises to increase exports (as in the case with most East Asian nations) and closing inefficient companies.
As hard currency from exports has been received only from supplies to developed nations, it’s important to know the distribution of the supplies between groups of nations (see table 9). It can be noted that despite the sharp increase of prices of oil, its share sold to developed nations plunged, while the share of gas, on the contrary, rose. The resource curse theory maintains that rent seeking (or, to be exact, the fight for rent) is one of the main roots of oil extracting countries’ problems that diverts resources from production activities.110
But who received the rent from exporting hydrocarbons to socialist nations? The prevailing opinion in the literature is that deliveries of energy resources to these countries were a sort of payment for loyalty or, in other words, for the existence of the Soviet “empire.”111 The annual size of such oil and gas subsidies made up, according to various estimates, between $10 billion and $20 billion.112
If it’s true, we can hardly say that the fight for this rent inside of the Soviet Union’s allied nations had diverted significant resources from production activities. It’s rather that it, just like in the USSR itself, had been hindering the process of raising the energy efficiency of production. Evidence of this is the wide energy efficiency gap with Western nations, although it was considerably reduced after the crash of the USSR. This can be explained considering that most of them stopped receiving energy subsidies from Russia. And those who continued to get subsidies, Ukraine and Belarus, have failed to considerably raise their energy efficiency.

The above poses the question of how the cancelation of energy subsidies to allies would affect the Soviet Union. We can assume that this would diminish the loyalty of these nations and make them start market reforms earlier than they did. As many of their products were not competitive on the world market, production would have started to decrease much earlier. If, in addition to the above, the USSR sharply reduced procurements of these products (which would be natural in these circumstances), it would have two choices: to create the necessary production inside the country (subsidized at the expense of resource rent) or to increase procurements in developed nations (at the expense of oil and gas deliveries).
The second option seems more likely, considering that the Soviet Union did sharply raise the deliveries of high-tech products in the 1970s. In this case, it would have been even more exposed to fluctuations in world oil prices (as it used a more complex scheme of determining oil price when trading with allies: first, the moving average over five years, then—over three years; this enabled the leveling out of the short-term oil price fluctuations). But it’s also possible that it would have pushed the nation toward market reforms earlier, making them less revolutionary.
In 1991, the Soviet Union collapsed, but the debate on the role of oil and gas dependence is still a huge issue. In 1987, one of the USSR Gosplan employees noted at a meeting of economists: “If Samotlor oil did not exist, perestroika [reconstruction] of the economy would have occurred 10-15 years sooner.”113
Georgy Arbatov, a member of the Soviet Academy of Sciences, gave an excellent insight to the reasons why hydrocarbon exports were authorized by government officials the following way: “It seemed a cure for all problems. . . . Do [we] really need to solve the food problem radically and quickly, when it’s so easy to buy tens of millions tons of grain, followed by huge amounts of meat, and other food products from America, Canada and Western European nations? Do we really need to pull our construction industry out of the horrible underdevelopment, if we can just utilize Finnish, Yugoslavian or Swedish construction specialists to build or reconstruct important objects and import the scarcest materials and plumbing equipment from West Germany, and shoes and furniture from other places? Many of my colleagues and I, in the end of the 1970s until the beginning of the 1980s, were thinking that the West Siberian oil saved the economy . . . then we started to come to the conclusion that this wealth had at the same time seriously undermined our economy; the due and overdue reforms were continuously postponed.”114
In turn, historian Steven Kotkin writes that oil money made it possible to boost salaries and expand perks and privileges of the constantly increasing number of Soviet elite. Thanks to oil, the USSR got an opportunity to acquire Western technologies for manufacturing cars, synthetic fiber, and other consumer goods, and also to buy animal feedstock. In the future, USSR residents would warmly recall the Brezhnev era, when state-run shops had plenty of sausage products at subsidized prices. It appeared that oil allowed the USSR to live through the 1970s. But it only postponed its inevitable crash.115
In the Soviet period, oil prices peaked in 1980 ($88 per barrel) and then gradually fell to $50 per barrel by 1985 (a 43-percent drop), and crashed to $26 per barrel in 1986 (slightly recovering again to $36 per barrel in 1990 before starting to fall sharply again in 1991116). Irrespective of the drop in international oil prices, we can’t state that oil prices played a key role in the crash of the Soviet Union. Many other oil-exporting nations suffered just as much, if not more than the Soviet Union. The Soviet Union had a relatively diverse economy compared to that of other oil dependent countries. Currently, many experts are convinced that the main reason behind the rapid crash of the Soviet system was perestroika.
And still the oil and gas factor played a very important part in the crash (in fact, oil has always been a much greater contributor to international currency than natural gas). At the peak of the development of the oil industry in 1980, the USSR’s oil export revenues amounted to $3,100 per capita, and by 1991 they had dropped by about two-thirds, to $1,050 per capita.117
Modern theories related to the concept of the resource curse have led us to a better understanding of the mechanisms behind the negative effect of oil abundance on economic development. Many of these mechanisms were manifested in the Soviet economic system. It was Dutch disease that made things worse for the already troubled industrial and agricultural sectors, and the extreme volatility of oil prices that showed itself in the 1970s and 1980s, which first raised the Soviet economy to the top, and then plummeted it to the bottom.
The most important factor is that the institutions established in the Soviet planned system turned out to be extremely poor at preparing for adapting to the chaos of the world markets, which the state couldn’t control. The Soviet Union didn’t establish stabilization funds to smooth out the drops in oil prices (actually, very few nations did at the time), as it had never faced such situations before. It was unable to react by devaluing the currency, and even if it did, it would not make much sense as civic industry had continuously experienced a deficit of resources (as most high-quality resources were directed to the military-industrial complex output) and wouldn’t be able to boost output. Agriculture wouldn’t be able to boost the harvest output due to chronic problems that had accumulated over decades.
Perhaps, the main factor is that the authorities in the 1970s didn’t understand the nature of the situation they faced. A highly unusual situation—the multiple increase of prices on the world market and the discovery of huge oil and gas deposits—started to seem quite natural. This led to the government getting many permanent (not temporary) expenditure commitments, which it found difficult to fulfill afterward.
There is a temptation to compare the economic crises caused by drops in oil prices in the late Soviet Union and modern Russia, and to try to draw lessons from the Soviet crisis in order to exit the current one. On the one hand, the parallel seems natural: the Soviet Union carelessly developed an oil and gas dependence and suffered a lot as a result (many researchers say this accelerated the dissolution of the USSR), while modern Russia has failed to learn any lessons from this crisis, and they also face a difficult situation during the sharp drops in oil prices in 2008 and 2014.
But this explanation seems overly simplified. Firstly, the Soviet economy existed under a centrally controlled system. The modern Russian economy, although under pressure from government intervention, is still qualitatively different from the Soviet economy. Secondly, the Soviet economy, even during periods of the highest oil and gas prices, was dependent on oil and gas much less than modern Russia. The USSR’s population was much bigger than Russia’s, almost 242 million in 1970 and 292 million in 1991,118 which is 68 percent and 103 percent higher than the Russian population in 2014.119 This means that oil and gas output per capita was much smaller (2.12 tons/person per year in 1989 against 3.72 tons/person per year in Russia in 2016).120 At the same time, in the 1970s, about 80 percent of the Soviet Union’s earnings in hard currency came from oil and gas, which can be compared with modern Russia. This made both the Soviet Union and Russia extremely dependent on energy markets they could barely influence. However, since the share of the USSR’s exports as a percentage of the GDP of the USSR was much lower than that of modern Russia’s, export fluctuations were therefore less harmful to the Russian economy.
Thirdly, the crises of oil and gas incomes in both cases were accompanied by crisis phenomena of no less importance. The crisis in the Soviet economy was the combination of the attempt to introduce an open market to a planned economy along with the liberalization of political life—it’s still debatable whether the drop in raw material incomes brought about Gorbachev’s reforms (perestroika) or if his reforms caused the drop in raw material incomes. In the case of the modern Russian economy, the drop of raw material revenues is accompanied by the foreign policy crisis that led to a few rounds of sanctions (and countersanctions) against a number of sectors in the Russian economy and individual companies.
Modern Russia should remember the harsh lessons taught to the Soviet Union by oil and gas dependence. As for the resource dependence of the Russian economy, it is another topic that needs separate research.
1 Mr Manmohan S, Kumar and Kent Osband,“Energy pricing in the Soviet Union,” Working Paper, no. 91-125 (Washington, D.C.: International Monetary Fund, 1991).
2 Thane Gustafson, Crisis amid plenty: The politics of Soviet energy under Brezhnev and Gorbachev (Princeton University Press, 2014), 10–15.
3 Translator's note: all tons (of oil, etc.) mentioned in this paper are metric tons.
4 Mariya Slavkina, Oil and gas factor of domestic modernization 1939-2008 (Moscow: Ves Mir, 2015), 295–297.
5 Gustafson, 11.
6 Gaddy Clifford. G., and Barry Ickes, Bear traps on Russia’s road to modernization (Routledge, 2013).
7 As cited by: Martinot, Eric, “Energy efficiency and renewable energy in Russia: Transaction barriers, market intermediation, and capacity building,” Energy Policy, vol. 26, no. 3 (1998): 905-915.
8 Michael Ross, Oil Curse: How Rich Oil and Gas Raw Material Deposits Shape Development of States (Moscow: Gaidar Institute, 2015), 359.
9 See review of Prebisch-Singer hypothesis in: S. Yermolayev, O. Vasilyeva, A. Mishura, Phenomenon of Resource Curse in Economic Development (Moscow: Plekhanov Russian University of Economics, 2012).
10 Harvey D. I., Kellard N. M., Madsen J. B. and Wohar M. E., “The Prebisch-Singer Hypothesis: Four Centuries of Evidence,” The Review of Economics and Statistics, vol. 92, no. 2 (2010): 367–377.
11 About mechanisms of the ‘Dutch disease’ see: Corden W. Max and J. Peter Neary, “Booming Sector and Deindustrialisation in a Small Open Economy,” Economic Journal, vol. 92, no. 368 (1982): 825-848; Corden W. Max, “Booming Sector and Dutch Disease Economics: Survey and Consolidation,” Oxford Economic Papers, vol. 36 (November 1984): 359-380.
12 Gustafson, 67.
13 Alexander Arbatov, Vladimir Feygin and Victor Smirnov, “Unrelenting Oil Addiction,” Russia in Global Affairs, no. 2 (April-June 2005), http://eng.globalaffairs.ru/number/n_4960
14 Sagers, Matthew .J, “Oil Production Costs in the USSR,” PlanEcon Long-Term Energy Outlook (Washington, D.C.: PlanEcon, Inc., Fall 1987), 43-54 (as cited by Gustafson, 266).
15 Calculated on the basis of: Global, British Petroleum, “Statistical Review of World Energy 2006,” http://www.bp.com/content/dam/bp-country/en_ru/documents/publications_PDF_eng/Statistical_review_2007.pdf (2007).
16 Arbatov, Feigin, Smirnov.
17 Slavkina, 328.
18 PlanEcon Report 4, nos.39-40 (October 1988), 2 (as cited by Gustafson,286).
19 Michael L. Ross, “The political economy of the resource curse,” World politics, vol. 51, no. 02 (1999): 297-322.
20 Ibid, 307.
21 Rodrik, Dani, “Understanding economic policy reform,” Journal of Economic Literature, vol. 34, no. 1 (1996): 9-41.
22 See, for instance, Charles Tilly and Mancur Olson, The Rise and Decline of Nations: Economic Growth, Stagflation and Social Rigidities (New Haven: Yale University Press, 1982).
23 Evans, Peter, Embedded Autonomy (Princeton: Princeton University Press, 1995).
24 Ross, 309.
25 Mansoorian, Arman, “Resource Discoveries and Excessive External Borrowing,” The Economic Journal vol. 101, no. 409 (1991): 1497-1509.
26 For this case.
27 Ross, 310.
28 Clifford G. Gaddy and Barry W. Ickes, "Resource rent and the Russian economy," Eurasian Geography and Economics vol. 46, no. 8 (2005): 559-583, 569.
29 See for instance: Jeffrey D. Sachs and Andrew M. Warner, “Natural resource abundance and economic growth,” (National Bureau of Economic Research, 1995) no. w5398.
30 Daniil Yergin, Extraction: World History of the Fight for Oil, Money and Power (Moscow: DeNovo, 1999), 44.
31 Yergin, 109-110.
32 John D. Grace, Russian oil supply: performance and prospects (Oxford University Press, 2005).
33 Robert W. Campbell, Economics of Soviet oil and gas (1968), 2—10.
34 Campbell, 126
35 Yergin, 552-553.
36 Slavkina, 53.
37 A. Bystritskiy, “The First One, Beryozovo. The Dawn of the ‘Discovery of the century’, The Tyumen Pravda, 1973, no. 223.
38 Slavkina, 260.
39 Nikolai Maltsev, Valery Igrevskiy and Yuri Vadetskiy, Oil Industry in Russia in the After-War Years (Moscow: VNIIOENG, 1996) (as cited by Valery Kryukov and Y. Shafranik, Oil and Gas Sector of Russia: the Hard Way to Diversity (Moscow, 2016), 150).
40 Marshall I. Goldman, Petrostate: Putin, power, and the new Russia (Oxford University Press, 2008), 38.
41 Energy of Yamal (Tyumen, 1999), 24.
42 Figures from “22th Congress of the Communist Party of the Soviet Union,” verbatim record (Moscow, 1962), vol. 1, 170 (as cited by Slavkina, 262).
43 Slavkina, 264.
44 Data on actual oil output from: Global, British Petroleum, “Statistical Review of World Energy 2006 (2007).
45 See, for instance: Margaret Chadwick, David Long, and Machiko Nissanke, Soviet Oil Exports: Trade Adjustments, Refining Constraints, and Market Behavior (Oxford University Press, 1987).
46 Data on output, exports and consumption from: “Handbook of International Economic Statistics 1992” (Washington, D.C.: Directorate of Intelligence, September 1992), Tables 36, 37, 38, 43 (as cited by ) Цит. по: Soviet Legacy on Russian Petroleum Industry. http://www.beg.utexas.edu/energyecon/new-era/case_studies/Soviet_Legacy_on_Russian_Petroleum_Industry.pdf
47 USSR population data: Wikipedia, https://ru.wikipedia.org/wiki/%D0%9D%D0%B0%D1%81%D0%B5%D0%BB%D0%B5%D0%BD%D0%B8%D0%B5_%D0%A1%D0%A1%D0%A1%D0%A0. US population data: US Census, http://www.census.gov/popest/estimates.html
48 Gustafson, 29.
49 Global, British Petroleum, “Statistical Review of World Energy 2006 (2007).
50 Ross.
51 Slavkina, 266.
52 N. Karyagin, O. Mezhslumov, Y. Shayevskiy, V. Timonin, “Problems of Siberian Oil,” Pravda, 1965, no. 91 (as cited by Slavkina, 269).
53 Goldman, 38.
54 Mariya Slavkina, Development of Oil and Gas Complex in the USSR in 1960-1980s (Moscow, 1995), 85 (as cited by Slavkina, 267).
55 See.: N. Baibakov, N. Pravednikov. V. Staroselskiy, Yesterday, Today and Tomorrow of Russian Oil and Gas Industry (Moscow: IGiRGI, 1995), 85 (as cited by Slavina, 267).
56 Viktor Andriyanov, Kosygin (Moscow: 2004), 238 (as cited by Slavkina, 271).
57 Maltsev, Igrevskiy, Vadetskiy, 148 (as cited by Shafranik and Kryukov, 150).
58 G. Vakhitov, “Half of century of Domestic oil Production: from Soar to Crash,” in Oil of the Soviet Nation: Problems of History of USSR Oil Indistry (1917-1991), edited by V. Alekperov (Moscow: Russian Academy of Natural Sciences, Oil and Gas Section, 2005), 513 (as cited by Shafranik and Kryukov, 151).
59 Mariya Slavkina, Triumph and Tragedy. Development of USSR Oil and Gas Complex in 1960-1980s (Moscow: Nauka, 2002),192.
60 Viktor Karpov, “Oil and Gas Profile of Industrialization in Tyumen Region in 1960-1980s.” Taxes, Investments, Capital (Tyumen, 2004), vol. 5-6, http//nic.pirit.info (as cited in Thane Gustafson, Wheel of Fortune: The Fight For Oil and Power in Russia (Moscow: Alpina Publisher, 2017), 45).
61 Gustafson, 105.
62 Izvestiya, October 15, 1984 (as cited by Goldman, 42)
63 Pravda, January 27, 1978 (as cited by Goldman, 42).
64 Grace, 50.
65 Matthew J. Sagers, Valeriy Kryukov, Vladimir Shmat, “Resource Rent from the Oil and Gas Sector and the Russian Economy,” Post-Soviet Geography (1995), vol. 36, no. 7, 393.
66 Ibid, 393.
67 Gaddy Clifford. G., and Barry Ickes, “Russia’s Resource Dependence,” in Russian Economy. Oxford Collection. Book I (Moscow: Gaidar Institute, 2015).
68 Grace, 93-94.
69 Gaddy and Ickes, 543.
70 Ibid, 545.
71 Ibid, 547.
72 Ibid, 550.
73 Sagers, Kryukov, Shmat, 389-425.
74 They also consider the costs of 1,000 m3 of gas to equal to $40 (i.e. equal to costs of 1 ton of oil). All their estimates are for the mid-1980s. We'll note that Gaddy and Ickes suppose that costs of 1,000 m3 of gas are twice as big as of 1 ton of oil.
75 $32 per barrel.
76 Gustafson (2017), 47.
77 As cited by Sagers, Kryukov, Shmat.
78 Gustafson, 5.
79 Mikhail Gorbachev, “About Tasks of the Party on the Complete Perestroika of Economic Management,” Pravda. 26 June, 1987.
80 See, for instance: Joyce M. Dargay, Dermot Gately and Hillard G. Huntington, “Price and Income Responsiveness of World Oil Demand, by Product,” Energy Modeling Forum working paper EMF OP, vol. 61 (2007), http://citeseerx.ist.psu.edu/viewdoc/download?doi=10.1.1.527.7748&rep=rep1&type=pdf.
81 Kumar, Osband, 4.
82 Shows by how many percent enery consumption rises when GNP increases by 1 percent.
83 Energy intencity and energy capacity are considered synonyms in this context.
84 Calculated under the Soviet methodology.
85 Their product is the total efficiency of energy use (in this case — energy intensity of national income).
86 Melentyev, 41.
87 Also, the intensity of using of atomic and hydro energy.
88 Melentyev, 50.
89 Ibid.
90 Ibid.
91 See more about the notion of closing costs in Soviet economic science: http://www.mining-enc.ru/z/zatraty-zamykayuschie.
92 Gustafson, 230.
93 Russian foreign trade. Data by the Customs Revenues Department for various years (as cited by Goldman, 5-6).
94 Calculated by the author on the basis of: Russian foreign trade. Data by the Customs Revenues Department for various years (as cited by Goldman, 5-6).
95 Yergin, 410.
96 Net energy exports are exports minus imports of energy. See also Campbell, 5.
97 Melentyev, 30.
98 USSR Foreign Trade in 1980 (Moscow: Finansy i Statistkia, 1981), as cited by: Melentyev, 229.
99 Gustafson, 266.
100 Chadwick, Long, Nissanke.
101 National Economy of the USSR in 1989, 644.
102 Global, British Petroleum, “Statistical Review of World Energy 2006 (2007)”.
103 U.S.Bureau of Mines, Mineral Yearbook 1986 (Washington: U.S. Bureau of Mines, 1986), 859. As cited by: “Foreign investment barriers or other restrictions that prevent foreign capital from claiming the benefits of foreign government programs,” Report to the United States Trade Representative and the Congress on Investigation no.332-268 under Section 332(g) of the Tariff Act of 1930.
104 Yergin, 213.
105 FAOSTAT data, 2005, as cited by Yegor Gaidar, Collapse of an Empire: Lessons for Modern Russia (Washington, D.C.: Brookings Institution Press, 2010), 101.
106 Russian State Archive of Contemporary History, Fund 89, Inventory 42, Case 66, List 6, as cited by Slavkina, 331.
107 Slavkina, 193
108 Arbatov, Feygin, Smirnov.
109 Melentyev, 41.
110 Havlor Mehlum, Karl Moene, Ragnar Torvik, “Institutions and the resource curse,” The Economic Journal, vol. 116, no. 508 (2006), 1-20.
111 See Gaidar.
112 The figure of $10 billion is backed in: Michael Maresse, Jan Vanous, Soviet Subsidization of Trade with Eastern Europe: A Soviet Perspective (Berkeley, Calif,: Institute of International Studies, 1983), as cited by Gustafson, 273.
113 Arbatov, Feigin, Smirnov.
114 Georgy Arbatov, Man of the System (Moscow: Vagrius, 202), 313, 315 (as cited by Slavkina, 327).
115 Kotkin, 16 (as cited by Ross, 155).
116 Global, British Petroleum, “Statistical Review of World Energy 2006 (2007).
117 Ross, 157.
118 USSR Population, https://ru.wikipedia.org/wiki/%D0%9D%D0%B0%D1%81%D0%B5%D0%BB%D0%B5%D0%BD%D0%B8%D0%B5_%D0%A1%D0%A1%D0%A1%D0%A0
119 Russian Population, https://ru.wikipedia.org/wiki/%D0%9D%D0%B0%D1%81%D0%B5%D0%BB%D0%B5%D0%BD%D0%B8%D0%B5_%D0%A0%D0%BE%D1%81%D1%81%D0%B8%D0%B8
120 Calculated by the author using the data on USSR and Russian population, Global, British Petroleum, “Statistical Review of World Energy 2006 (2007) and Global, British Petroleum, “Statistical Review of World Energy 2016” (2016), https://www.bp.com/content/dam/bp/pdf/energy-economics/statistical-review-2016/bp-statistical-review-of-world-energy-2016-full-report.pdf.
Sergei Ermolaev
Associate Professor at the Plekhanov Russian University of Economics
Carnegie does not take institutional positions on public policy issues; the views represented herein are those of the author(s) and do not necessarily reflect the views of Carnegie, its staff, or its trustees.

Ultimately, Zelensky sided neither with the reform camp nor with the military establishment as such, but with political control.

Balázs Jarábik

Trump is distracted and Ukraine wants Europe to step up. The continent’s leaders must find their voice and assert it in talks with Russia.

Alissa de Carbonnel
Tokayev’s predecessor, Nursultan Nazarbayev, outlined arrangements for a power transition too soon and in too much detail, ultimately losing control over the process. Tokayev is determined not to meet the same fate.

Temur Umarov
That statistic about a bottle of water may not live up to scrutiny.


Jon Bateman, Andy Masley
Mounting economic strain and battlefield losses will not necessarily make the Kremlin less dangerous. They could instead push Moscow toward a more aggressive hybrid campaign designed to test NATO’s Eastern flank, exploit allied hesitation, and fracture European resolve.

Maksym Beznosiuk