Commentary
Ultimately, Zelensky sided neither with the reform camp nor with the military establishment as such, but with political control.
Balázs Jarábik
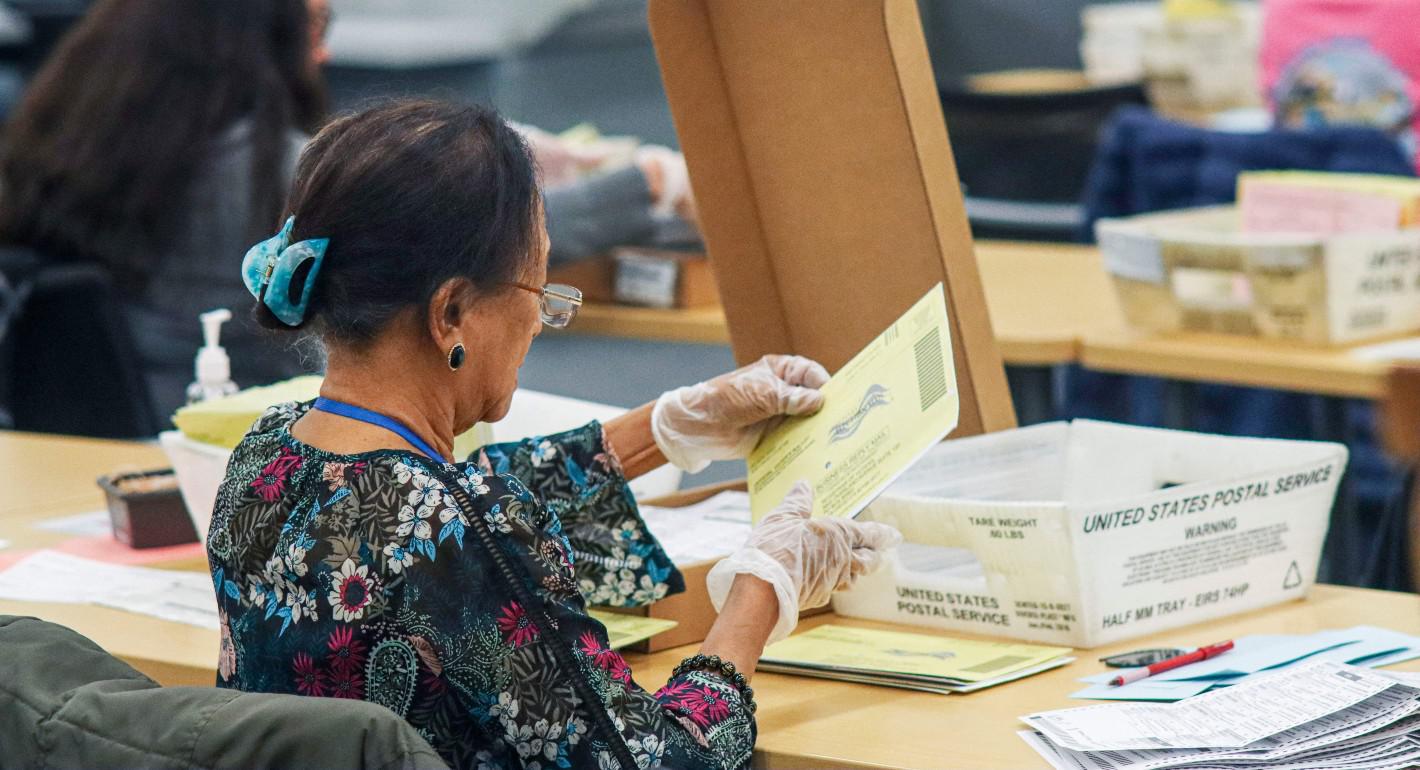
Source: Getty
More Asian Americans are turning out to vote than ever before, but to what extent do they participate in other civic and political activities? A survey of Asian Americans in California provides some answers.
One of the most striking statistics to emerge from recent electoral campaign cycles in the United States is the marked increase in the voter turnout of Asian Americans. Following the 2018 midterm elections, the U.S. Current Population Survey estimated that the voting rate among adult citizens belonging to the Asian American community rose from 28 percent in 2014 to 42 percent just four years later. Analyses of this data by AAPI Data found that this turnout surge was broad-based with sizeable growth evident across demographic categories such as age, gender, and place of birth.
This impressive growth continued in the presidential election year of 2020. U.S. Census Bureau data found that the turnout of Asian American voters reached nearly 60 percent during the 2020 presidential election, marginally lower than the turnout rate of African Americans but higher than that of Latinos. According to political data firm TargetSmart, Asian American voters increased their turnout at the polls in every 2020 battleground state, more than any other minority group. In fact, the increase in Asian American voter turnout surpassed the narrow vote margin that flipped Georgia and Arizona from Republican to Democrat.
These striking figures herald the rise of a pivotal new voting demographic, a development that has been met with considerable attention by the media, politicians, and America’s two major political parties. But these headline numbers, while important, do not shed much light on the broader patterns of civic and political behavior in the Asian American community. While Asian-origin Americans might vote in greater numbers than before, to what extent do they participate in important political activities other than voting? And beyond the political realm, how do Asian Americans engage in civic life in their own communities?
This article attempts to answer these and other pertinent questions about Asian Americans’ civic and political engagement. It is the fourth in a series of articles that explore the political and social preferences of Asian Americans in California, a state where today Asian Americans and Pacific Islanders make up nearly 16 percent of the state’s population.
Like the others in the series, this article draws on a 2022 online survey of 1,000 California-based Asian Americans conducted by the Carnegie Endowment for International Peace in partnership with the data and analytics firm YouGov. The sample includes respondents from twenty-one Asian-origin groups but excludes Native Hawaiians and Pacific Islanders.
Specifically, this article examines patterns of civic and political engagement among California’s Asian Americans. It focuses on how respondents engage with their communities, how they relate to politics, and how they interact with political campaigns—both as campaign contributors and consumers.
The first article in this series explored the political preferences of the community in the run-up to the 2022 midterm elections, while the second looked at their policy preferences, and the third unpacked the nature of Asian American identity. The fifth and final article in this series will explore the community’s foreign policy attitudes.
The data analyzed here are based on an original online survey of 1,000 California-based Asian American residents. The survey was designed by scholars at the Carnegie Endowment for International Peace and conducted by polling firm YouGov between September 9 and September 26, 2022.
YouGov recruited respondents from its proprietary panel of nearly 2 million U.S. residents. Only adult respondents (ages eighteen and above) who are full-time residents of California and who belong to one of twenty-one Asian-origin groups were eligible to participate in the survey.1 These twenty-one ethnic subgroups account for 97.4 percent of the Asian American and Pacific Islander population in California, according to 2020 U.S. Census data.2 The YouGov survey did not include respondents who principally identify as Native Hawaiian or Pacific Islander. The survey was fielded in English (see the next section for additional discussion).
YouGov employs a sophisticated sample-matching procedure to ensure to the greatest extent possible that the respondent pool is representative of the Asian American community in California; the procedure uses data from the U.S. Census Bureau’s 2019 American Community Survey as a target sample frame. All the analyses in this study employ sampling weights to ensure representativeness. The overall margin of error for the sample is +/- 3 percent. This margin of error is calculated at the 95 percent confidence interval.
The survey instrument contains an extensive range of questions organized across six modules: basic demographics, identity and discrimination, politics, policy preferences, foreign policy, and civic and political life. Respondents were allowed to skip questions except for important demographic questions that determined the nature of other survey items.
As related research has shown, surveys of Asian Americans have to contend with several thorny methodological challenges. While their numbers have increased, Asian Americans are still a distinct minority—even in California—making it difficult to recruit sufficiently large samples for surveys.
One major benefit of working with an extensive survey panel, such as the one maintained by YouGov, is that it provides access to large sample sizes that allow researchers to make reliable estimates about even relatively small populations of interest. However, online panels have a significant drawback: most online survey panels are conducted in English, and around seven in ten eligible Asian-origin voters report that they only speak English at home or speak the language “very well.”
Therefore, the survey results presented in this article cannot mechanically be extrapolated to the Asian American community in California at large. For instance, this survey’s sample includes a larger share of U.S. citizens than California’s Asian American population as a whole. It is best to treat the survey findings as representative of the views of English-proficient Californians of Asian origin.
Despite this caveat, this survey serves as an important barometer given that, in the years to come, the characteristics of the Asian American population will increasingly resemble those of the sample studied here.
The survey asked respondents whether—in the last twelve months—they participated in any of four common methods of civic engagement: performing voluntary community service without pay; working with others in their community to solve a problem; attending a protest march, demonstration, or rally; or attending a public meeting, such as for a school board or city council.
Overall, the level of civic participation appeared muted. Of the four methods of civic engagement the survey examined, the most popular was performing voluntary community service—an activity only 11 percent of respondents reported taking part in. Nine percent reported working with others in their community to solve a collective problem, 6 percent attended a public meeting of some kind, and 6 percent attended a protest march, demonstration, or rally.

On three of out of four measures—performing community service, working with community members to solve a problem, and attending a public meeting—U.S.-born respondents reported marginally higher rates of participation (see figure 1). Regarding the fourth category—attending a protest march, demonstration, or rally—participation rates were roughly equal between the two categories of respondents.
As the size of the Asian American population has grown over time, diaspora groups have invested significant resources in building civic organizations or nonprofit associations that play a variety of roles, including community service, religious expression, and policy and advocacy. Beyond generic measures of civic engagement, the survey asked respondents if they were a member of any Asian American organization or group, be it cultural, ethnic, regional, religious, caste, community, or school related. One in five respondents (21 percent) reported that they were currently involved with such an organization.
U.S.-born respondents were more likely to take part in diaspora activities; 26 percent of them reported engagement with diaspora organizations compared to 16 percent of foreign-born respondents. There was also variation on this score across Asian American communities (see figure 2). Thirty percent of respondents of Southeast Asian heritage reported membership in a diaspora organization, compared to 22 percent of South Asians and 16 percent of East Asians.

Regardless of their purpose, diaspora organizations could be organized narrowly along ethnic lines or broadly across ethnic communities that comprise the Asian American population.
Examining data on respondents who were members of at least one diaspora-based organization, around four in ten reported that these organizations were comprised of members who shared their ethnic background (see figure 3). However, there was no significant variation across ethnic subgroups. Between 41 and 44 percent of Southeast, South, and East Asians reported taking part in organizations with co-ethnics, while between 44 and 54 percent of respondents reported that their organizations possessed a membership of mixed ethnicities.

An individual’s propensity to vote is often used as a convenient shorthand for their level of political engagement, but the former is at best a proxy measure. Political engagement is a broader concept that involves activities that include voting but go well beyond it. This section explores the extent of political engagement before delving into the act of voting more specifically.
The survey queried respondents about whether they participated in any of five political activities in the last year: discussing politics with friends and family; posting comments online about politics; contacting their elected representative or another government official; contributing money to a candidate, party, or campaign organization; or volunteering or working on a political campaign.
By far the most popular mode of political engagement was the simple act of discussing politics with family and friends, an activity 36 percent of respondents reported doing in the past year. Fourteen percent reported posting comments on political issues online, 10 percent contributed money in some form to a political activity, and 9 percent contacted their member of Congress or other government official. The least popular activity was working on a political campaign, something only 4 percent of respondents reported doing in the past year.

As with the measures of civic engagement discussed above, U.S.-born respondents were more likely to engage in political activities, although the difference with their foreign-born counterparts was marginal (see figure 4). Indeed, it was striking how similar participation rates were irrespective of place of birth.
The survey also asked about respondents’ general level of interest in politics, which is a summary measure of political engagement. Specifically, the survey asked respondents the degree to which they followed developments in government and public affairs in the United States.
There was a wide distribution of responses (see figure 5). Twenty-two percent of respondents reported following the latest developments in U.S. politics most of the time, while a plurality of respondents—37 percent—reported tracking current events some of the time. Twenty-three percent reported staying abreast of political issues only now and then and another 11 percent reported that they hardly ever paid attention to government and public affairs in the United States. An additional 8 percent responded with “don’t know.”

While there was no significant difference in the political interest of respondents based on their place of birth, there was some evidence of differences on the age dimension. Interest in American politics and public affairs was highest among the eldest respondents in the sample: 61 percent of those ages fifty and above reported regularly following developments in American politics compared to 52 percent of respondents in the eighteen-to-twenty-nine age bracket. College-educated respondents also reported higher levels of political interest when compared to non–college educated counterparts.
The survey asked all respondents a set of basic questions about their voting behavior. While previous essays in this series explored California-based Asian Americans’ voting patterns and policy preferences and attitudes, this section focuses narrowly on registration and turnout. Based on the U.S. citizen sub-sample of survey respondents (who accounted for 93 percent of the overall sample), 88 percent of citizen respondents were registered to vote. One in ten who were eligible to vote were not registered, with an additional 2 percent unsure of their registration status.
Among unregistered voters, there were few differences by gender, place of birth, or age. However, there were discernible differences based on education and income levels (see table 1). For instance, just 5 percent of college-educated citizen respondents reported that they were not registered to vote. This share more than triples (to 17 percent) when considering respondents without a college degree. Similarly, 6 percent of respondents whose household income is in the range of $50,000–$100,000 and 4 percent of respondents who earn over $100,000 were not registered to vote. This share stood at 16 percent for those with household incomes below $50,000.

While voter turnout tends to be lower in primary elections than on Election Day, two-thirds of respondents (67 percent) reported voting in the June 7, 2022, California primary election. In terms of the midterm election itself, held on November 8, the survey was only able to ask about vote intention since it was fielded in the September before the election. Of eligible voting-age citizen respondents, between 12 and 13 precent reported that they did not intend to vote in the midterm election either for governor, Senate, or their respective House of Representatives race. Here too, class loomed large in the decision to vote; respondents without a college degree and/or who are from lower-income households tended to be two to three times more likely to abstain from voting on Election Day.
Although the 2024 presidential elections are still far off, 8 percent of respondents reported that they had no intention of voting in the 2024 race. This figure excluded voters who were undecided about the party they planned to support in the next election; about 21 percent of the citizen sub-sample fell into this “undecided” category.
Although there is no comprehensive data on the extent of Asian American campaign giving, anecdotal evidence suggests that Asian-origin citizens are stepping up their involvement as contributors to political campaigns, a new development that parties have taken cognizance of. In many states and localities, in California and elsewhere, Asian Americans are seen not simply as a crucial voting bloc, but also as a community of contributors and vote mobilizers. This section looks briefly at their campaign finance behavior.
Of the total respondent sample, around 15 percent reported contributing financially to a candidate’s campaign at some level during the course of the 2022 election cycle. By and large, these donations skewed toward the smaller end of the spectrum (see figure 6). Eighty-two percent of campaign contributors reported giving $250 or less during the 2022 midterm campaign: 34 percent reported giving less than $50, while 48 percent stated they had given between $50 and $250. Relatively few respondents were located on the upper end of this giving spectrum. Eleven percent reported contributing between $250 and $1,000 and just 6 percent reported contributing more than $1,000.

Interestingly, income was not neatly correlated with a respondent’s political giving status. While wealthier individuals were somewhat more likely to give than lower-income respondents, the differences were small and nonlinear. One variable that did seem to shape giving patterns was place of birth: 19 percent of U.S.-born respondents reported donating money in the 2022 cycle compared to under 8 percent of foreign-born respondents.
Existing research demonstrates that Asian Americans overall suffer from a campaign “contact gap.” Despite the fact that their numbers have grown, that their giving profile has risen, and that there is greater awareness of their political heft, most research finds that political campaigns tend to treat them as an afterthought. For instance, a 2020 Pew survey found that Asian voters lagged behind all other ethnic or racial groups in terms of the extent of campaign contact they received (across all methods of contact).
The 2022 Asian American Voter Survey (AAVS), a nationally representative survey conducted months before the 2022 midterm election, found that 45 percent of respondents across the United States reported no campaign contact from either major party.
To probe this issue in the California context, the Carnegie survey also asked respondents whether they were contacted by any political party during the 2022 election campaign (see figure 7). This contact could have been on the phone, in person, or via social media and the internet. A striking 44 percent reported no contact at all from any political campaign, nearly half of the entire sample.

This statistic is almost identical to what the AAVS found on a national level. Thirty-six percent of respondents reported experiencing “some” or “a little” contact, with only 10 percent acknowledging they had received “a great deal” of contact from political parties. Roughly one in ten respondents (11 percent) reported not knowing the extent of political contact.
To be sure, not all Asian Americans experienced the same degree of campaign contact (see figure 8). For instance, 33 percent of Southeast Asian respondents reported either some or a great deal of contact with political parties during the 2022 midterm season, compared to 30 percent and 24 percent for South and East Asians, respectively. Nearly one in two South Asians (49 percent) and East Asians (48 percent) reported no contact with campaigns as against 35 percent of Southeast Asian respondents.

Of respondents who were contacted by a political campaign, the survey asked which party was responsible for reaching out to them (see figure 9). The overwhelming majority of contact was driven by the Democratic Party; 68 percent of those contacted reported outreach from the Democrats. In contrast, half as many respondents—37 percent—reported outreach from the Republican Party.3

These outreach figures are not far out of line with the current voting patterns of Asian Americans in California: data analyzed in an earlier essay suggested that slightly more than half of survey respondents reported voting for Democratic candidates at the House, Senate, and gubernatorial levels in California. However, the extent of campaign contact reported in the Carnegie survey differed from the 2022 AAVS. In the latter survey, 44 percent of respondents reported having at least some campaign outreach from the Democrats while 35 percent of respondents reported experiencing some degree of Republican outreach. The data from the Carnegie survey in California suggested a higher degree of Democratic mobilization in the state, compared to the national average.
Beyond the two major parties, a small minority (8 percent) reported being contacted by a third party. Twelve percent of respondents experiencing some kind of campaign contact were not sure which party got in touch with them.
Finally, the survey asked respondents whether they were contacted by any Asian American organizations during the midterm campaign. (Several California-based Asian American organizations work, either in connection with parties or independently of them, to educate voters, conduct advocacy, or build political awareness.)

According to the survey, political parties had a stronger track record of engaging Asian Americans than diaspora organizations (see figure 10). Two-third of respondents (67 percent) reported that they had no contact at all with Asian American organizations during the 2022 campaign cycle. Eighteen percent reported either “some” or “a little” contact and only 3 percent reported a great deal of contact. An additional 12 percent were unsure of their contact with diaspora groups in the 2022 campaign.
In recent years, the profile of Asian Americans in state and national politics has steadily risen as their numbers have swelled and a greater share have exercised their right to vote. However, voting is but one form of how ordinary citizens engage in civic and political life. This essay looks at the broader picture of civic and political engagement among Asian Americans in the state of California, where they constitute a significant share of the population.
Using traditional measures of civic and political engagement, survey respondents’ participation appeared relatively muted across most activities. Performing community service emerged as the most popular mode of civic engagement while discussing politics with family and friends was the most popular manifestation of political participation. Across most measures, U.S.-born respondents tended to be more engaged than their foreign-born counterparts but the gaps were small in nearly all cases.
When it comes to voting, Asian Americans appeared energized but not all segments of the population were equally inclined to exercise their franchise. Two variables—education and income—helped to explain this variation. Respondents with lower household incomes and without a college degree were more likely than their peers to not be registered to vote. And, even among those who were registered, non-college educated and lower-income respondents were less likely to turnout on Election Day.
Beyond voting, some existing research suggests that Asian Americans have also begun flexing their muscles as campaign contributors. The survey data here suggested that around 15 percent of the respondent sample reported making a political donation in the 2022 election cycle, and most of these donations represented small-dollar contributions.
But despite their growing prominence, Asian Americans still experienced low levels of campaign outreach from the major parties, especially the Republican Party. And the data suggested that the reach of diaspora-linked organizations was also relatively shallow among the populations they work to advocate on behalf of.
The authors are grateful to Alexander Marsolais, Alexis Essa, Michael Finch, and their colleagues at YouGov for their help with the design and execution of the survey. Caroline Duckworth and Angela Saha were instrumental in designing the survey questionnaire. Alie Brase, Amanda Branom, Aislinn Familetti, Lindsay Maizland, and Jocelyn Soly provided excellent editorial, graphic design, and production assistance. Any errors found in this article are entirely the authors’.
1 The included ethnic subgroups are as follows: Bangladeshi, Bhutanese, Burmese, Cambodian, Chinese, Filipino, Hmong, Indian, Indonesian, Japanese, Korean, Laotian, Malaysian, Mongolian, Nepali, Pakistani, Singaporean, Sri Lankan, Taiwanese, Thai, and Vietnamese.
2 This percentage was calculated from population numbers from the 2020 American Community Survey by the U.S. Census Bureau.
3 These numbers do not add up to 100 since respondents could report receiving contact from multiple parties.
Director and Senior Fellow, South Asia Program
Milan Vaishnav is a senior fellow and director of the South Asia Program and the host of the Grand Tamasha podcast at the Carnegie Endowment for International Peace. His primary research focus is the political economy of India, and he examines issues such as corruption and governance, state capacity, federalism, and electoral behavior. He also conducts research on the Indian diaspora.
Nitya Labh
Former Nonresident Research Assistant, South Asia Program
Nitya Labh was a nonresident research assistant for the South Asia Program and for the Tata Chair for Strategic Affairs at the Carnegie Endowment for International Peace.
Carnegie does not take institutional positions on public policy issues; the views represented herein are those of the author(s) and do not necessarily reflect the views of Carnegie, its staff, or its trustees.

Ultimately, Zelensky sided neither with the reform camp nor with the military establishment as such, but with political control.

Balázs Jarábik
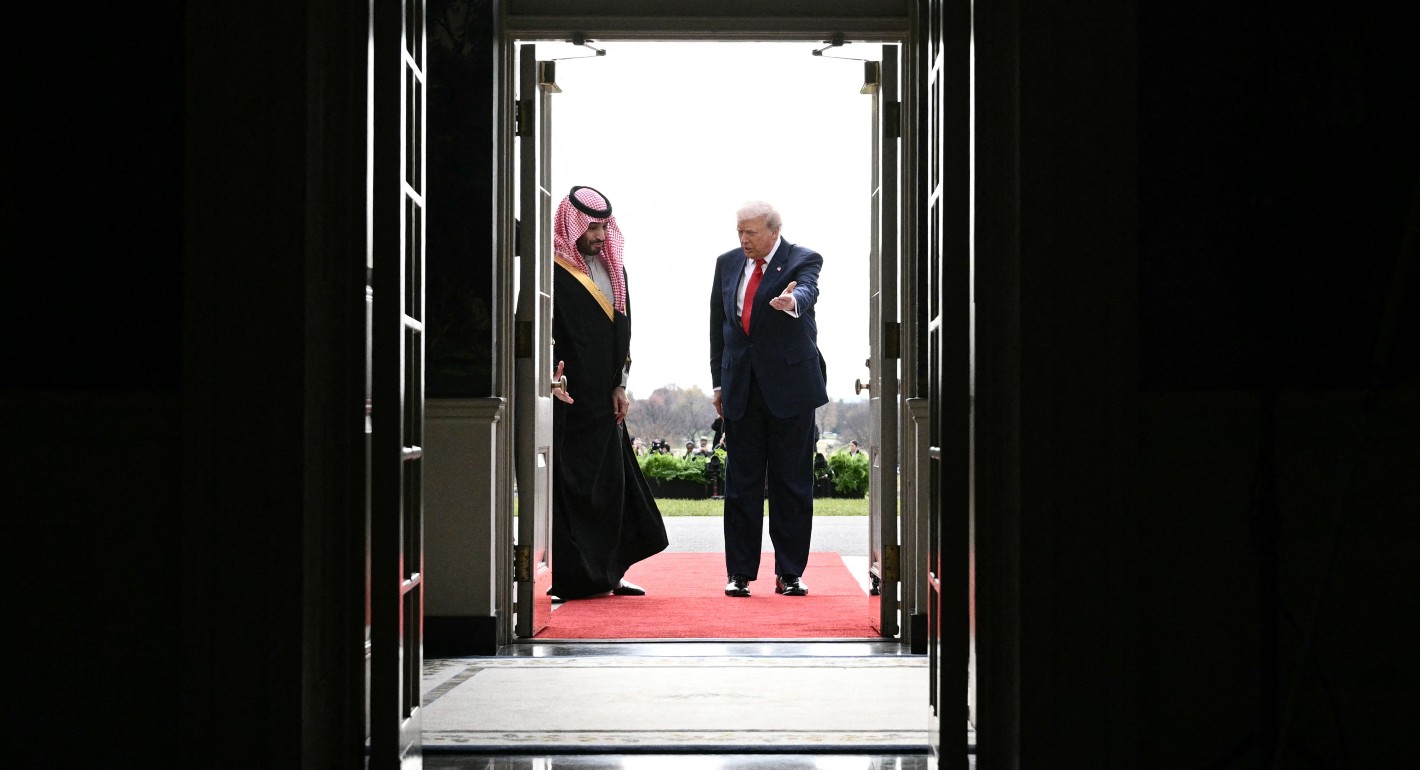
Despite the agreement’s uncertainty, it’s still a significant development in regional and nuclear policy.


Andrew Leber, Jane Darby Menton
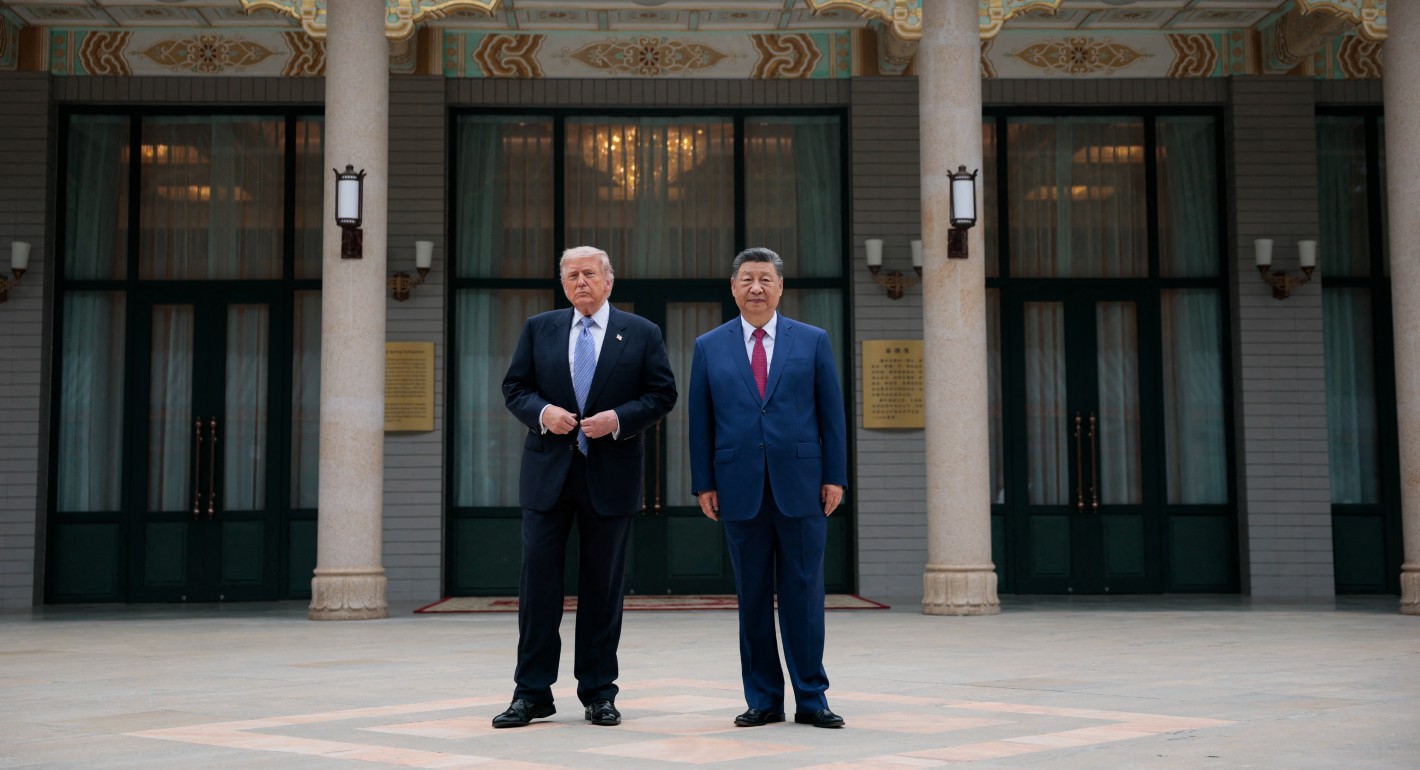
“AI safety in parallel” is modest and pragmatic but vital.

Matt Sheehan

Trump is distracted and Ukraine wants Europe to step up. The continent’s leaders must find their voice and assert it in talks with Russia.

Alissa de Carbonnel

There is a deeply rooted assumption in post–Cold War American statecraft that overwhelming military and economic power translates directly into favorable political outcomes. But force alone is rarely enough. To meet the challenges of the mid-21st century, Washington needs a cultural shift toward a mindset that takes negotiation far more seriously.

Cecily Brewer