Commentary
Reading the purported correspondence of celebrity Ksenia Sobchak sheds light on her role within the system, and how journalism and politics function in Putin’s Russia.
Vladislav Gorin
Source: Getty
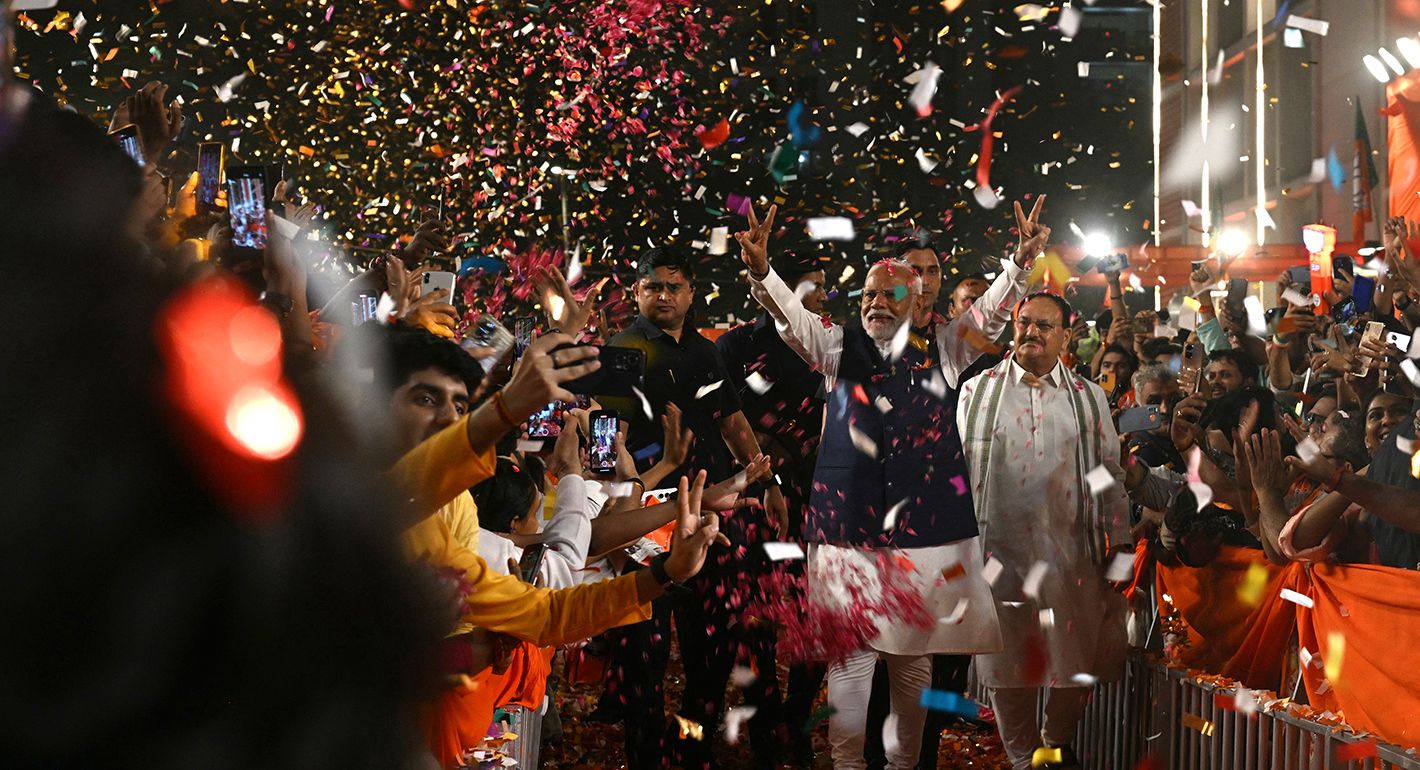
Despite this spring’s electoral setback, the BJP retains its dominant position at the center of Indian politics.
On June 9, 2024, Indian Prime Minister Narendra Modi and his handpicked Council of Ministers were sworn into office to lead India’s newly elected government following the country’s eighteenth general election. While the cast of characters occupying the topmost ranks of the government closely resembled the previous Modi administration, which held office between May 2019 and May 2024, a not-so-subtle shift took place beneath the surface.
As nationwide voting kicked off over forty-four days and in seven phases, Modi’s Bharatiya Janata Party (BJP) was widely expected to win a third consecutive single-party majority in India’s lower house of Parliament (the Lok Sabha). This expectation was based on two distinct data points. First, preelection surveys fielded in early 2024 were unanimous in predicting a BJP landslide. For instance, the India Today Mood of the Nation poll, released in January 2024, projected that the BJP would win 304 of the 543 seats in the Lok Sabha, with its National Democratic Alliance (NDA) partners chipping in another 31 seats.1 Top BJP officials themselves widely held the notion of an election landslide: the party went to the polls touting the slogan “Abki Baar 400 Paar” (“this time, more than 400 seats”), projecting confidence that the BJP and its allies would clinch a supermajority in the parliamentary election.2
Second, exit polls suggested that while such lofty ambitions might be out of reach, the BJP would face little trouble securing a clear majority.3 In reality, however, the final vote count was quite different. Ultimately, the BJP won just 240 seats out of the 543 up for grabs, short of the 272 seats needed for a parliamentary majority and 63 seats fewer than it won in 2019. For the first time since Modi catapulted to power in 2014, the BJP is reliant on its NDA coalition partners to stake its claim to the government. In the end, the NDA’s 293 seat total provides the BJP with more than enough support to govern comfortably. The opposition Indian National Developmental Inclusive Alliance (INDIA), in turn, far exceeded expectations, capturing 234 seats. The coalition, comprising three dozen parties, was significantly boosted by a reversal of fortune for the Indian National Congress (Congress Party); the once-dominant national party won 99 seats, a near doubling of its 2019 tally and the first sign in a decade of its national renewal.
On paper, at least, these results heralded a return to coalition politics—marking a sharp break with the previous decade of unquestioned BJP single-party dominance. Between 1989 and 2014, India experienced a “coalition era” of national politics in which no single party was powerful enough to form the government on its own.4 For a quarter-century, governments were formed through a combination of pre- and post-election alliance arrangements, diffusing power toward smaller regional parties whose support was essential for national parties to govern. The centrality of regional parties to government formation also enhanced the status of India’s state governments in the relative power balance between New Delhi and state capitals.
The BJP’s historic election triumph in 2014 put a decisive end to the coalition period by securing the first parliamentary single-party majority in three decades, winning 282 seats. No party had achieved such a milestone since 1984, when the Congress Party won a landslide victory in the aftermath of Indira Gandhi’s assassination. The BJP’s subsequent general election victory in 2019 only bolstered its numbers, cementing it as the new dominant party. As one of the authors has previously argued, the return of a dominant party in 2014 and the dramatic expansion of the BJP’s electoral footprint marked the beginning of a new electoral system in India known as the “fourth party system.”5
The resurgence of coalition politics in New Delhi and the presence of a much stronger political opposition together raise the question of whether the 2024 verdict reflects a repudiation of the fourth party system and a reversion to a more decentralized, fragmented era.6 Drawing on newly available data from the 2024 general election, this paper argues that, while the 2024 verdict represents a curtailing of the BJP’s dominance, many attributes of the fourth party system remain intact. Although the BJP fell short of a parliamentary majority, it remains a system-defining party. By and large, parties contest elections in India in favor of, or in opposition to, the Modi-led BJP. Furthermore, the BJP remains the single largest party in terms of its presence in the Lok Sabha, the Rajya Sabha (India’s upper house), and the country’s various state assemblies. While the recent general election results produced a greater degree of political fragmentation, stimulated more intense political competition, and lacked a coherent, all-India narrative, prevailing political conditions have more in common with a dominant party system than truly decentralized coalition politics. Nevertheless, the results of the 2024 general election demonstrate a weakening—if not quite a reversal—of several pillars underlying the fourth party system.
The following sections lay out the core principles of the fourth party system and how they differ from past systems. Then, they use data from the 2024 election to evaluate whether there are signs of reversal, either indicating a transition to a new system or a reversion to an older one. This paper examines principles underlying the fourth party system including the presence of a dominant party, rising political centralization, declining political competition, a nationalization of electoral politics, heightened voter mobilization in general elections, and changes in caste mobilization and representation. Finally, it enumerates potential factors that could disrupt the existing system.
Building on a framework developed and popularized by political scientist Yogendra Yadav, India has arguably witnessed four “party systems” since its independence from the British Raj in 1947.7
The first party system, dominated by the Congress Party, was in place from the time of independence until the elections of 1967, the year when the Congress Party’s grip on power in India’s states began to sharply wane.8 In the second party system, stretching from 1967 to 1989, the Congress Party largely retained its controlling position at the center even as its popularity in national terms gradually declined. The only time its hold on power in New Delhi slipped was when it was unceremoniously voted out of office in 1977—for a brief two-year period—in the aftermath of Indira Gandhi’s twenty-one-month period of emergency rule. India’s third party system, in place from 1989 to 2014, was synonymous with an era of coalition politics and the absence of a core political party around which the party system revolved.9 The 2014 election ushered in a new, fourth party system and a return to a dominant party era, with the BJP occupying the central position previously held by the Congress Party.10
The distinctiveness of the fourth party system is readily apparent when contrasted with the core principles of the third party system. During the coalition era, no single party was strong enough to serve as the central organizing pillar of Indian politics, and elections were marked by increasing party fragmentation, intensifying political competition, and a federalization of national politics. The third party system was also characterized by a new political sociology in which lower castes gained political representation, largely at the expense of historically dominant upper and intermediate castes.
Each of these principles was challenged by the resurgence of the BJP as a dominant national force in the post-2014 era.11 In this period, the BJP became the undisputed central pillar around which politics was organized. While it is certainly true that the BJP governed with coalition allies, it was not dependent on them for government survival. Further, the trends of growing fragmentation, rising competition, and federalization all exhibited sharp signs of reversal. While lower castes and previously disadvantaged groups continued to exert new influence in politics, the axis of competition shifted from broad umbrella caste categories to jati (individual caste)-specific combinations. Notably, the BJP painstakingly built electoral coalitions in key states by appealing to nondominant jatis that had not necessarily benefited from government affirmative action programs. These nondominant groups argued that the bulk of the gains emanating from government schemes and benefits had flowed to a small number of dominant jatis that served as the core votaries of key regional opponents to the BJP.
The following subsections review the principles underpinning this third party system, describe how those principles are at odds with the prevailing trends in the fourth party system, and then assess whether the 2024 general election represents a departure from those dynamics.
The third party system was characterized by the absence of a single party serving as the defining pole of India’s political landscape. The Congress Party had played that role in the decades prior to 1989, helming every government between 1952 and 1989—with the sole exception of the Janata Party government, which briefly held office between 1977 to 1979. But its declining national popularity, the rise of the BJP, and the growth in regional competitors meant it could no longer effectively play that part.
In 1998, the BJP under former prime minister Atal Bihari Vajpayee, with the support of its NDA allies, tasted national power for the first time. The BJP’s inaugural governing foray lasted only thirteen months, until a key ally pulled its support and fresh elections were called. Following the 1999 elections, the BJP formed another coalition government, once more under Vajpayee’s leadership, that remained in power until 2004. That year, in a surprise electoral verdict, the Congress Party emerged as the single largest party in Parliament and formed a wide-ranging coalition government with its United Progressive Alliance (UPA) partners. It repeated this feat in 2009, ruling for a decade under prime minister Manmohan Singh.
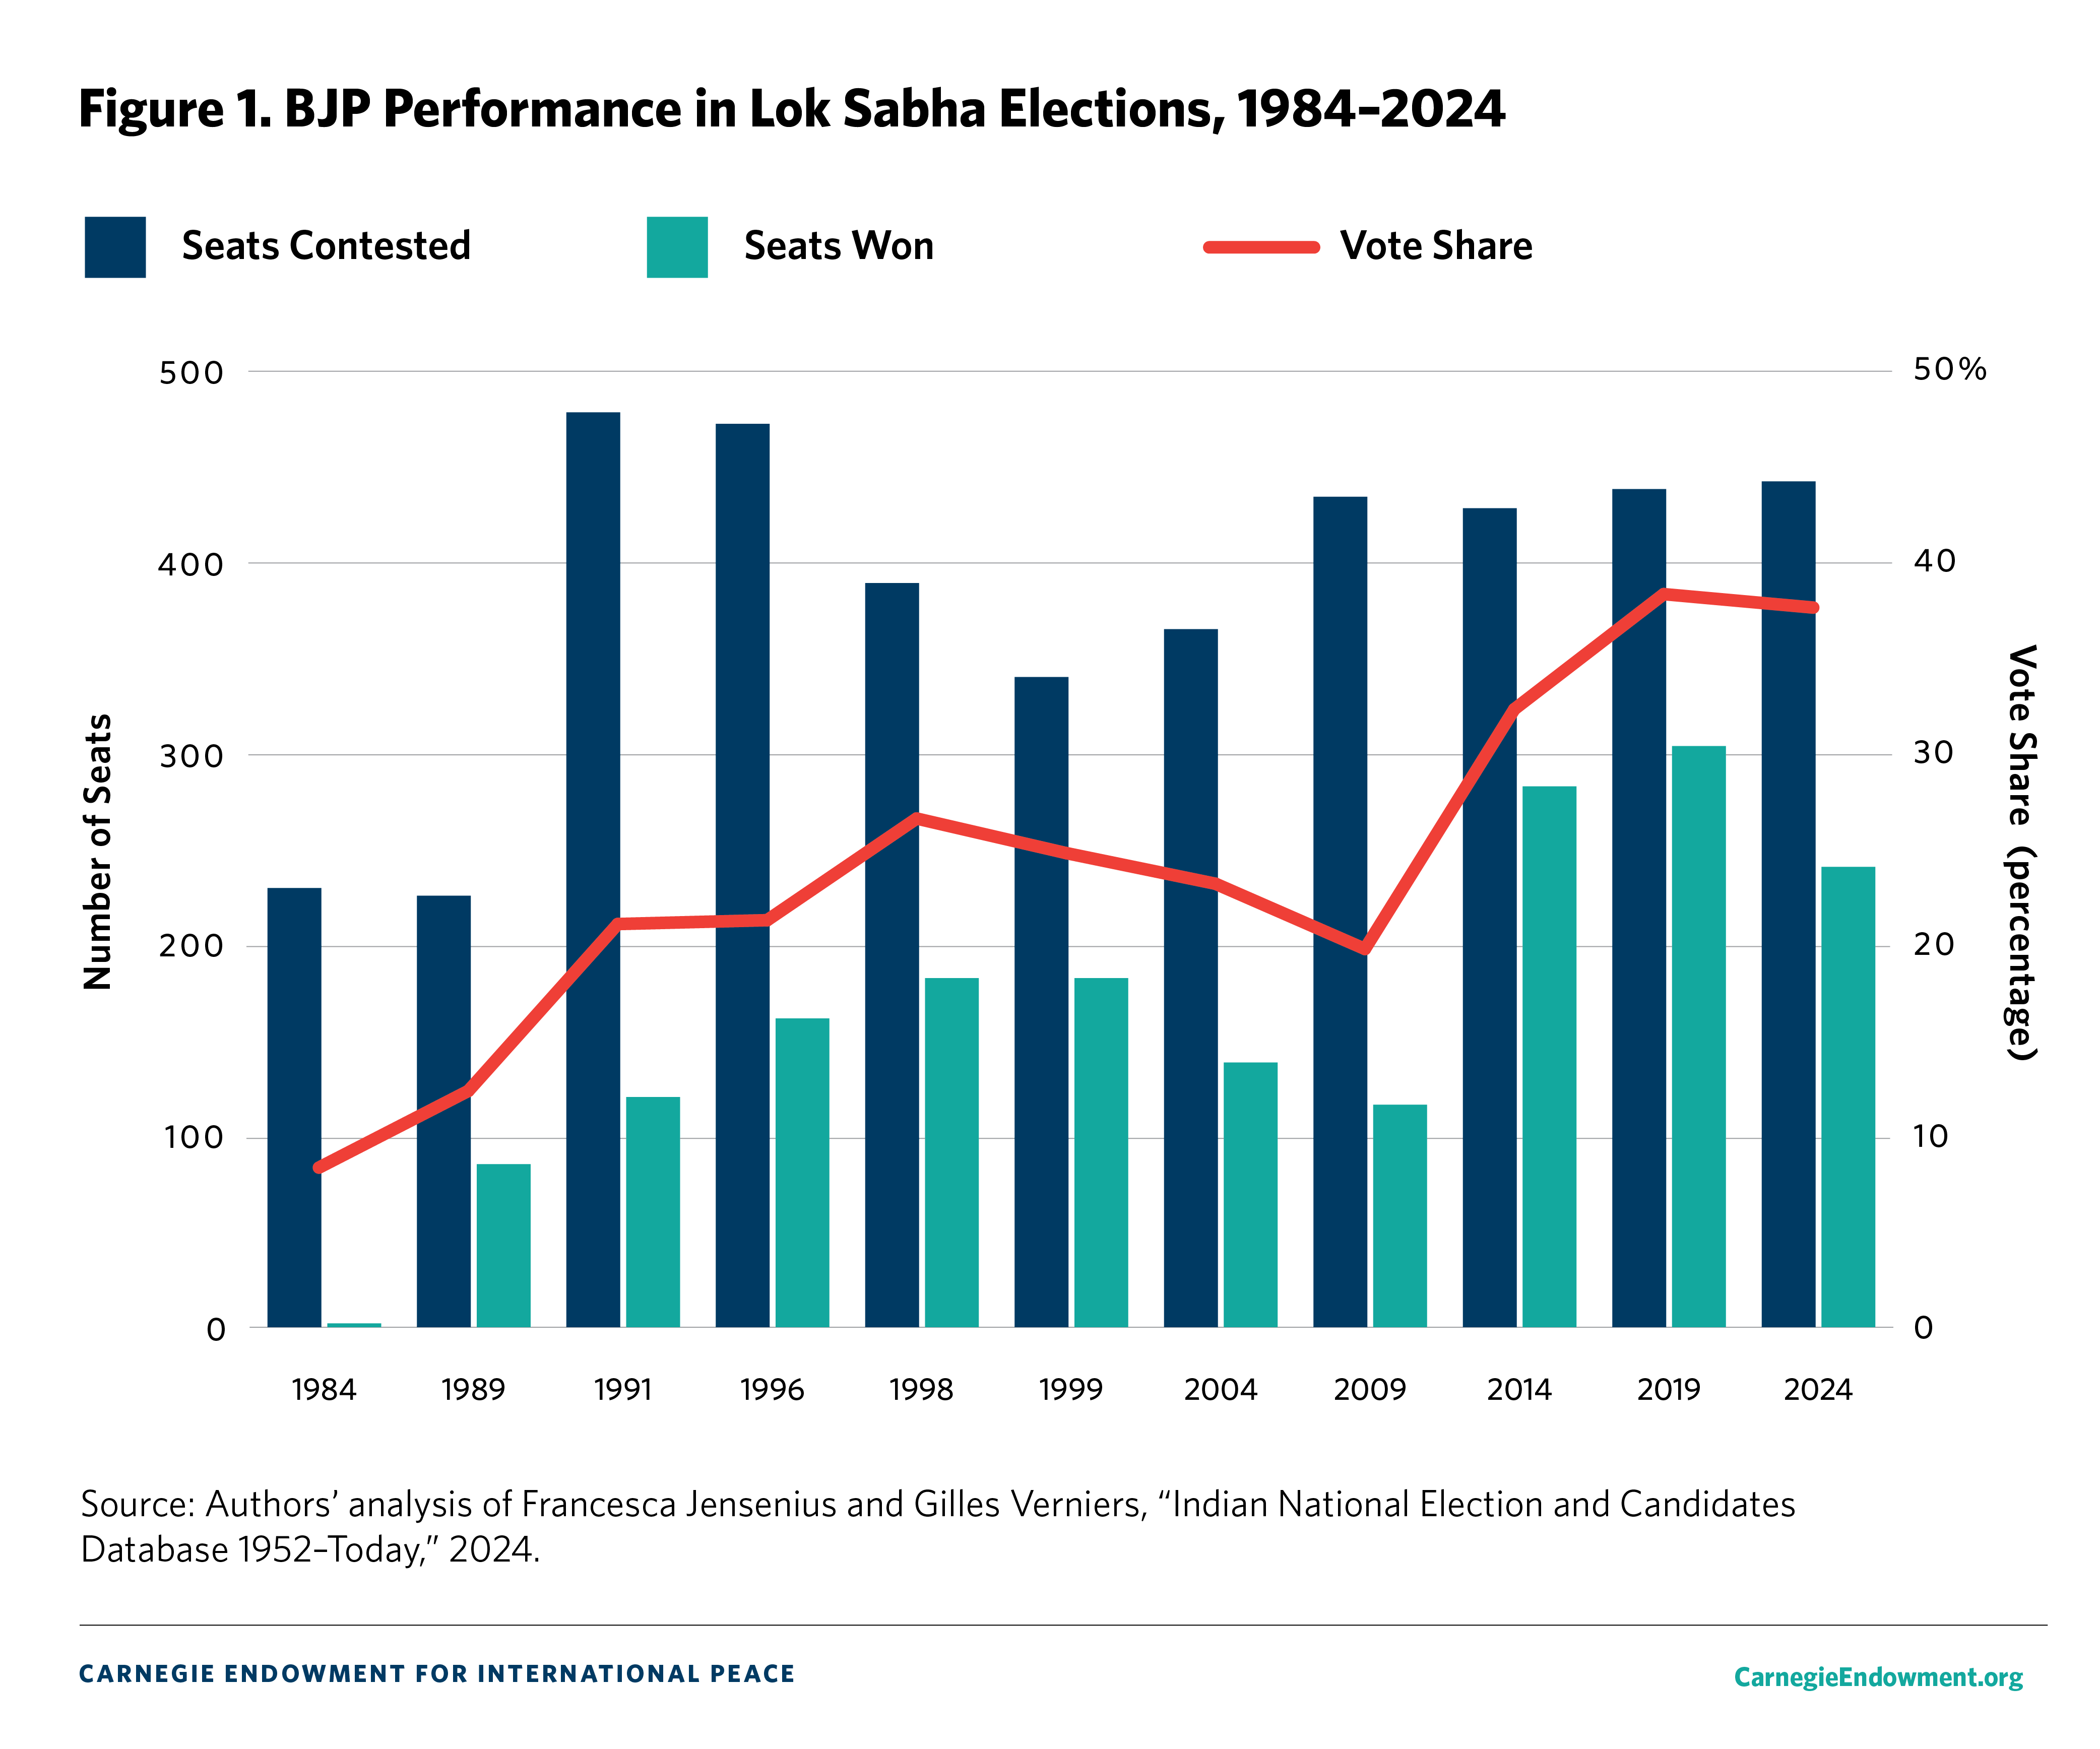
In the next election in 2014, the BJP reached new heights: it won a majority of 282 seats in the Lok Sabha, marking the beginning of a new party system in which it, not the Congress Party, became the system-defining party. The 2014 election was historic on several counts: It was the first time a party won a parliamentary majority in three decades, and it was the first time ever a party other than the Congress Party could claim this distinction. In the 2019 election, the BJP defied challenges of anti-incumbency and grew its tally to 303 seats, expanding its political footprint.12 Against this backdrop, there is no question that the 2024 general election represents a stunning setback for the party. Although the BJP contested 441 seats, its highest number in decades, its candidates emerged victorious in just 240.
On the surface, this statistic alone suggests major cracks in the edifice of the fourth party system. But a closer look at the data suggests that, despite experiencing a setback, the BJP retains its dominant position at the helm of the fourth party system.
For starters, the BJP’s vote share in 2024 declined by less than one percentage point in 2024 relative to 2019 (36.6 versus 37.3 percent) (figure 1).13 This suggests that, on an all-India level, its popularity has not changed significantly. However, its seat tally dramatically dropped (from 303 in 2019 to 240 in 2024), indicating that what has shifted is the regional distribution of that support.
Whereas the BJP saw its vote share decline in its traditional bastion, the Hindi heartland (the clutch of predominantly Hindi-speaking states stretching from Rajasthan in the west to Bihar in the east), its vote share increased in eastern and southern states—areas where it has traditionally been much weaker given the dominance of regional parties (see figure 2 for a visual demonstration of the BJP’s changing geographic footprint).14
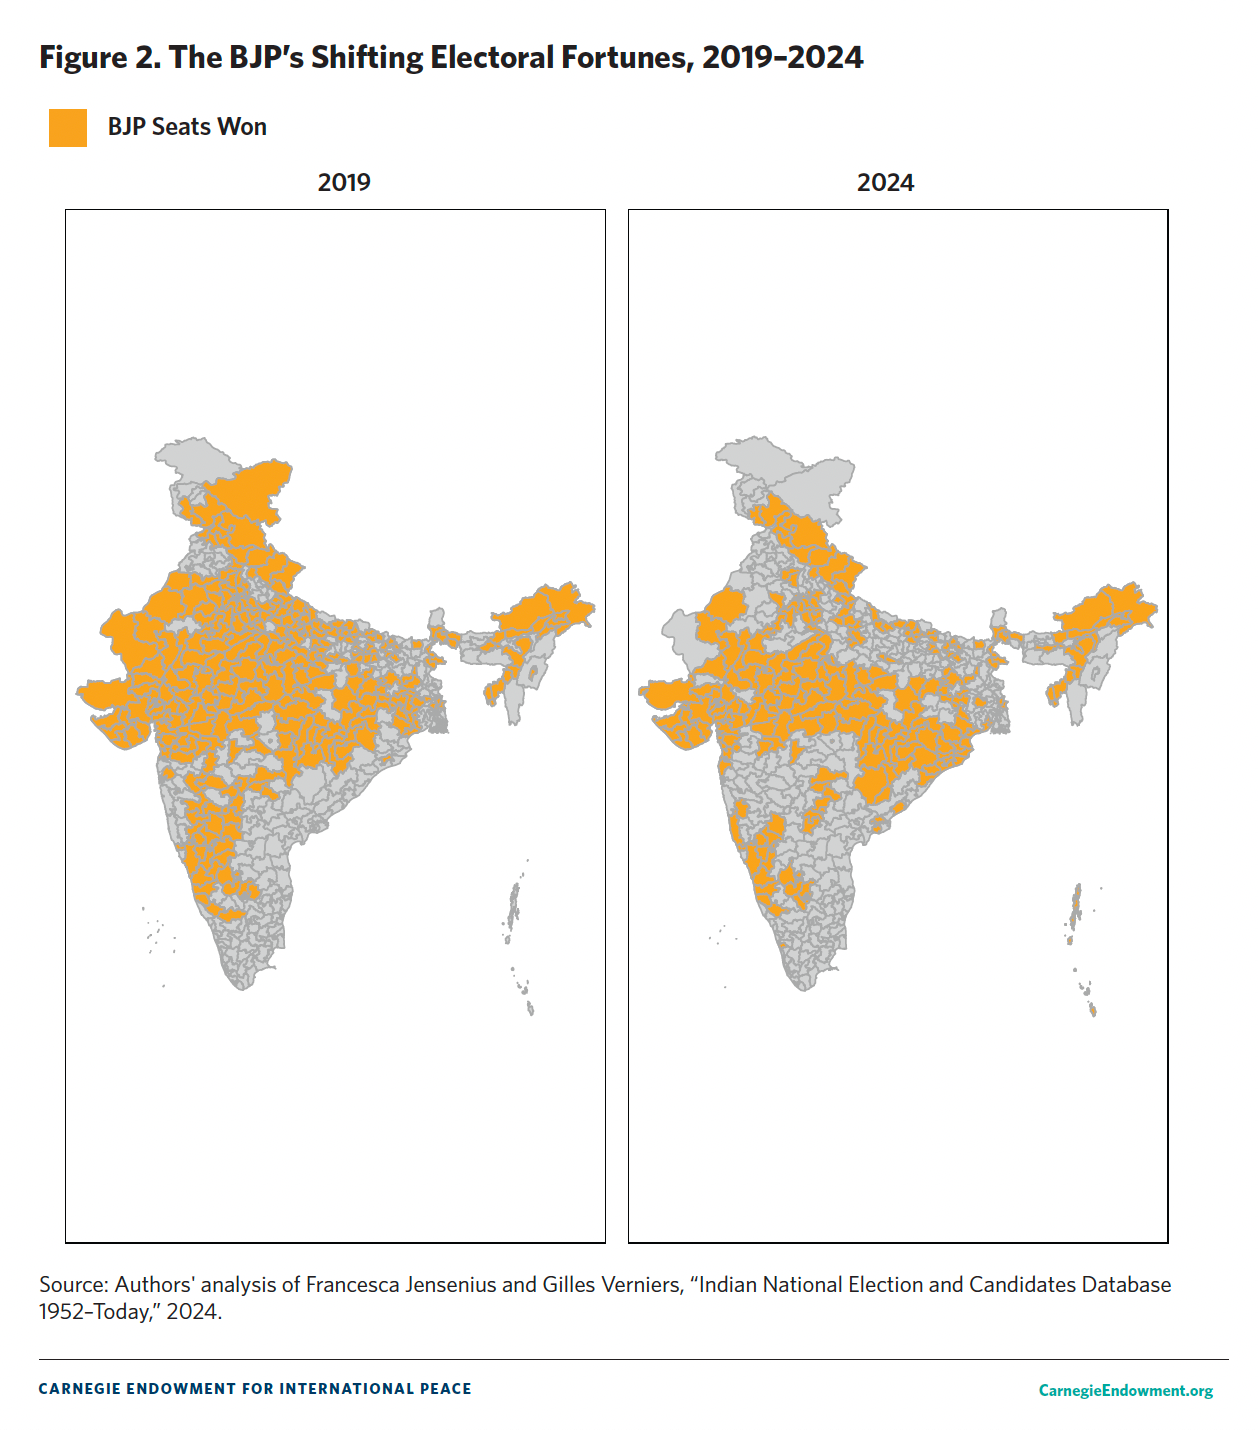
For instance, consider the BJP’s divergent performance in the five southern states and the seven largest Hindi belt states. In four of the five southern states, the BJP saw its vote share rise. In Kerala, the rise was modest (3.7 percentage points), but it was substantial in Andhra Pradesh (10.3 percentage points), Tamil Nadu (7.6 percentage points), and Telangana (15.4 percentage points). Karnataka, a state where the BJP has long had a presence, is the lone outlier where the BJP saw a decline in vote share in 2024.15
In contrast to its growth in the southern states, the BJP’s vote share tumbled in five of the seven largest Hindi belt states. In the other two, Chhattisgarh and Madhya Pradesh, the BJP’s vote grew by less than two percentage points. The BJP’s underperformance in Haryana, Rajasthan, and Uttar Pradesh specifically contributed to a significant loss of seats, ensuring a parliamentary majority would be out of reach. In 2019, the BJP won 96 seats in these three states; in 2024, its tally was reduced to 52. Had the BJP simply matched its 2019 performance five years later, it would have easily attained a parliamentary majority.
Another lens used to disaggregate the BJP vote—as political analysts Yogendra Yadav, Rahul Shastri, and Shreyas Sardesai have suggested—is to disaggregate states where the BJP is considered part of the “establishment” and states where it is perceived as the “challenger.” In establishment states, the BJP might not be the ruling party, but it is nevertheless a significant, if not dominant, player. Yadav, Shastri, and Sardesai have shown that in establishment states, the BJP lost 75 seats and saw its vote share plummet by 4.6 percentage points. In states where it is seen as a rising challenger, the party gained a dozen seats and grew its vote share by nearly six percentage points.16
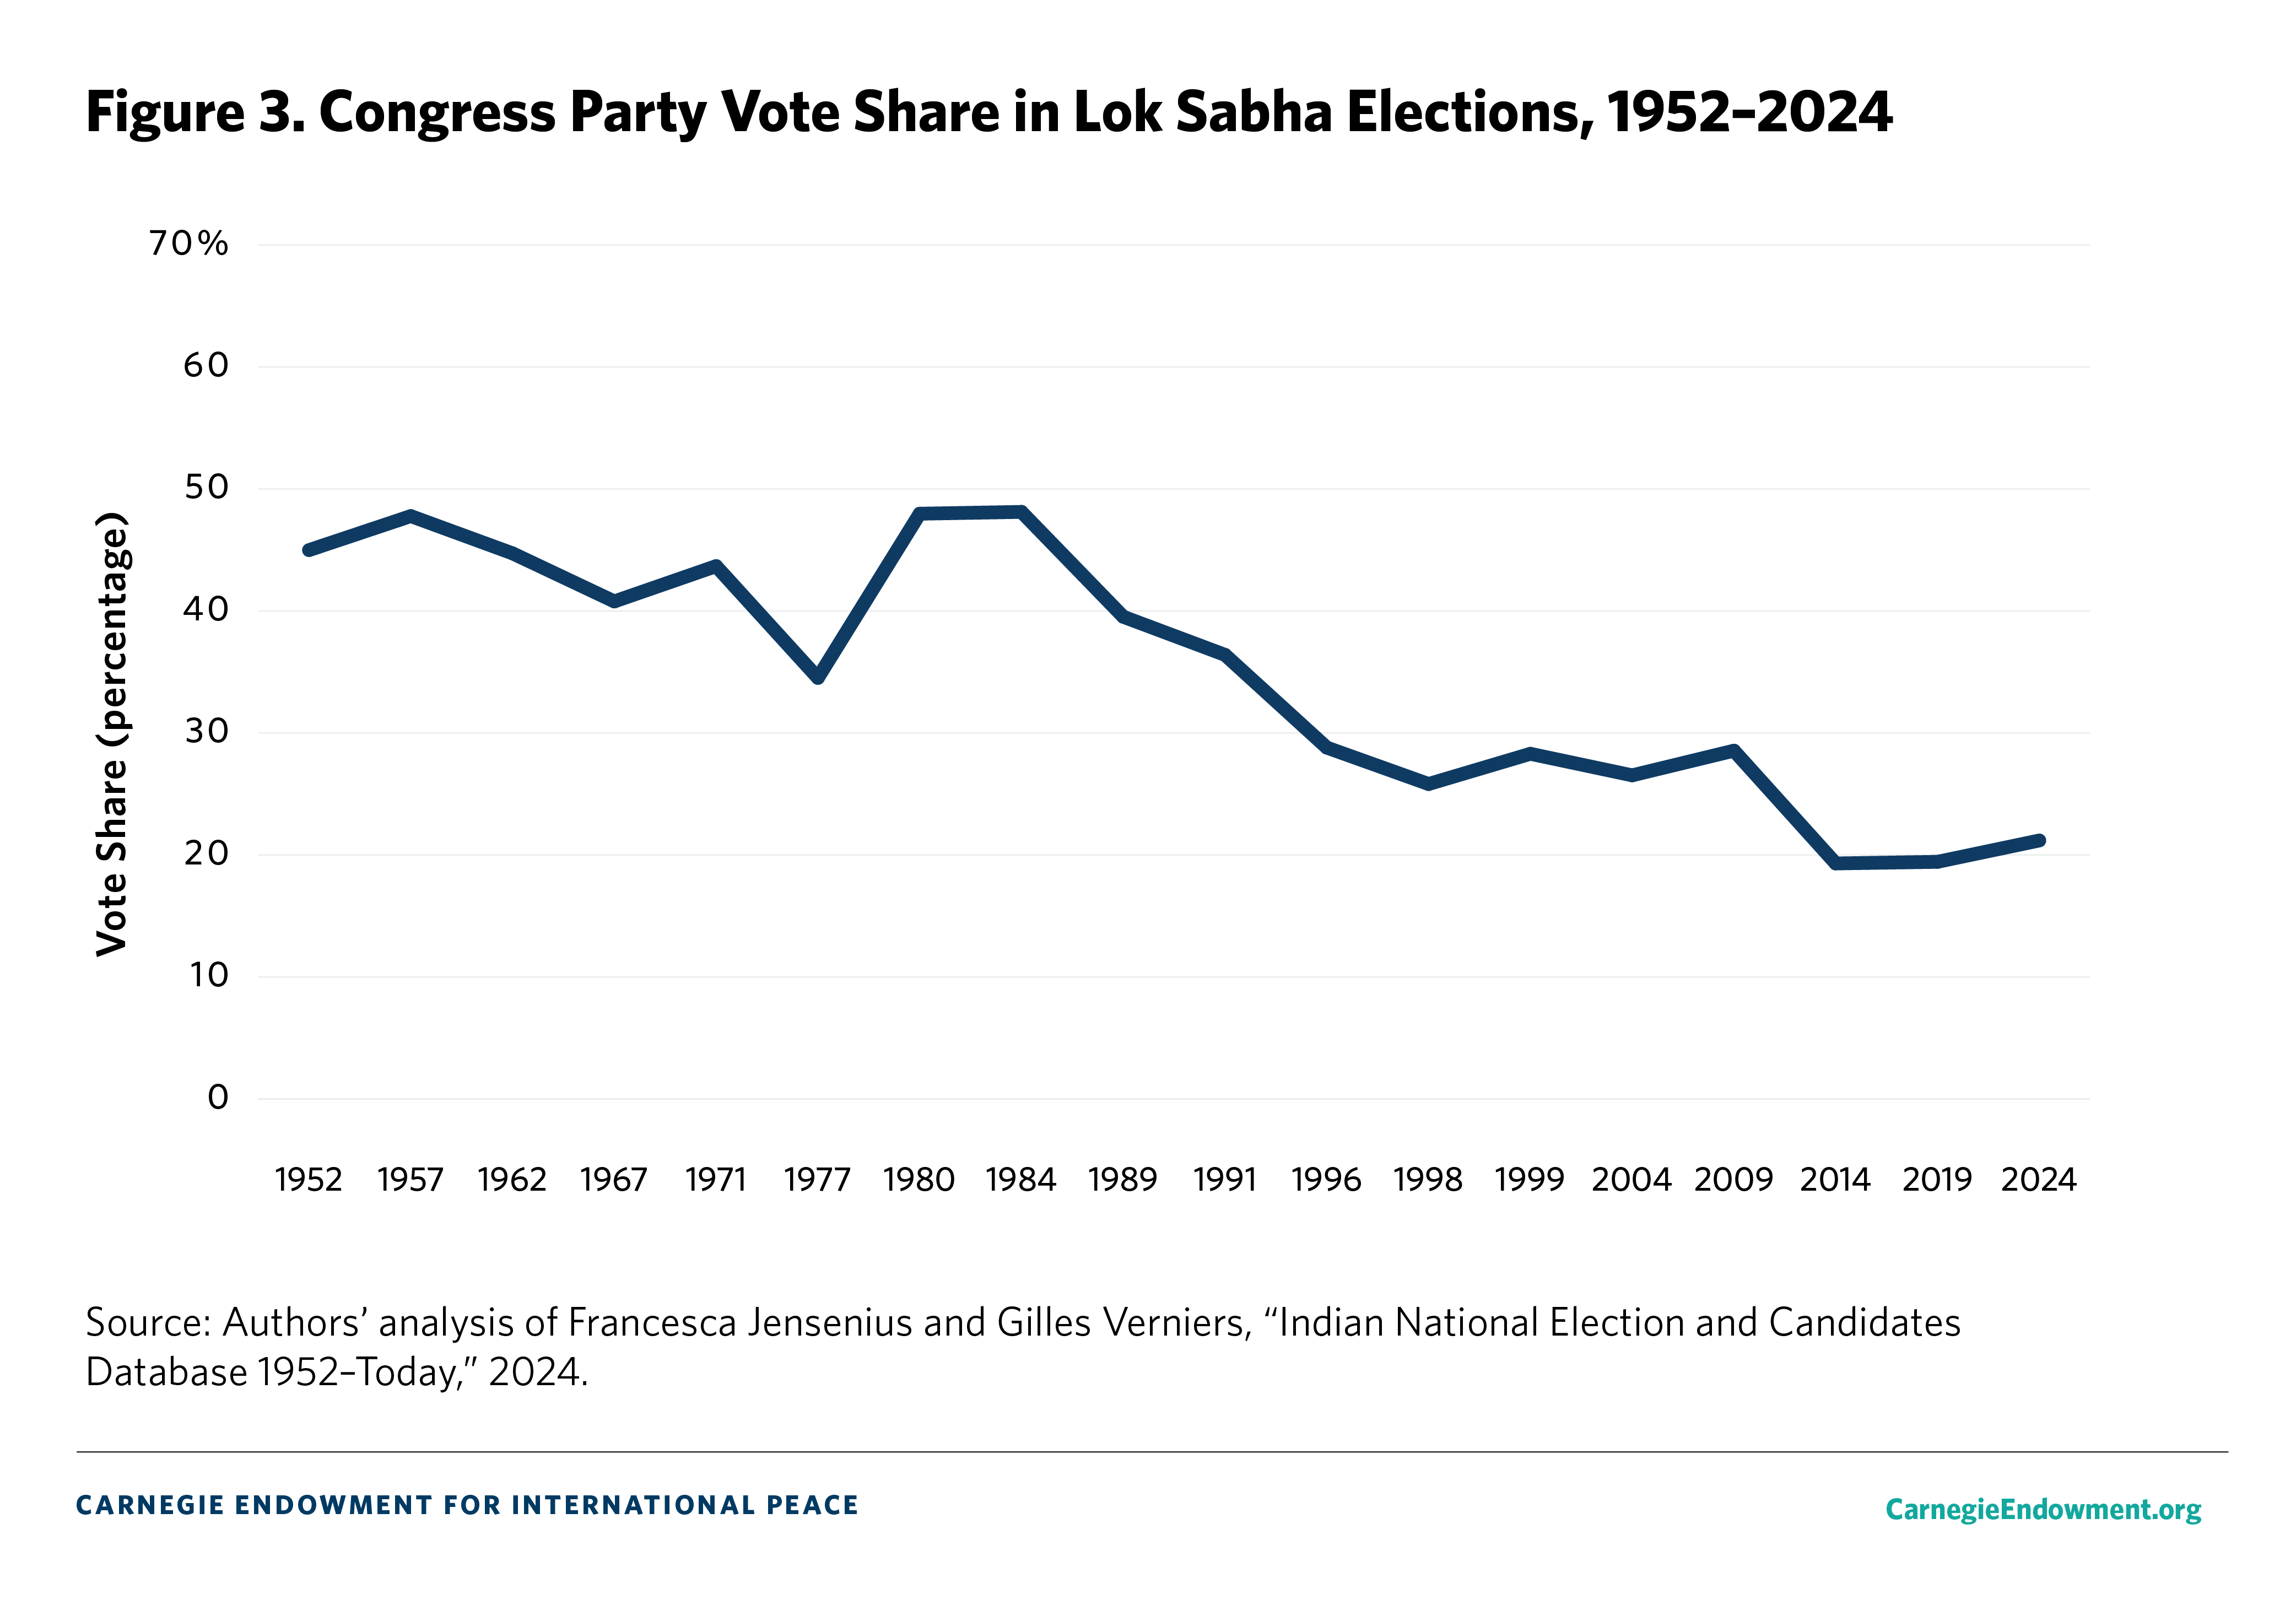
In terms of pan-Indian parties, the BJP continues to have only a single rival: the Congress Party (see figure 3). In 2024, the Congress Party’s vote share crept up to 21.2 percent, a modest upward swing from the 19.4 percent it enjoyed in 2019 (and 19.3 percent in 2014). However, the Congress Party’s vote share in 2024 looks impressive only in comparison with recent elections; placed into proper historical context, its 2024 share was its third worst performance ever. Even during the heyday of the coalition period, the lowest the party’s vote share dipped was 25.8 percent in 1998.17 Furthermore, in 2024, the vote share of the Congress Party itself was partly lifted by coalition arrangements in key states like Uttar Pradesh, where regional allies helped boost its fortunes.
Nevertheless, the Congress Party undoubtedly is exhibiting a new spring in its step. Although the Congress Party emerged as the single largest opposition party after the 2014 and 2019 elections, the head of its parliamentary delegation in the Lok Sabha was not awarded the official “leader of opposition” designation. This was due to a long-standing norm that the leading opposition party must occupy at least 10 percent of the seats in the house. Since the commencement of the 18th Lok Sabha (elected in May 2024), Congress Party leader Rahul Gandhi has occupied this role and, benefiting from the support of much stronger opposition ranks, has been a fierce critic of the present government.
However, the fact that more than two dozen opposition parties, including the Congress Party, joined hands to form the INDIA coalition for this election is a further testament to the BJP’s centrality. INDIA was expressly constructed to try and keep the BJP at bay and to deny Modi a third term.18 While the alliance is offering stronger pushback to the government, it still lacks common leadership, a programmatic agenda, and organizational structure. One of the tests associated with a system-defining party is the extent to which elections are fought in favor of, or in opposition to, the party with a preponderance of power. By all indications, the BJP retains that designation for now.
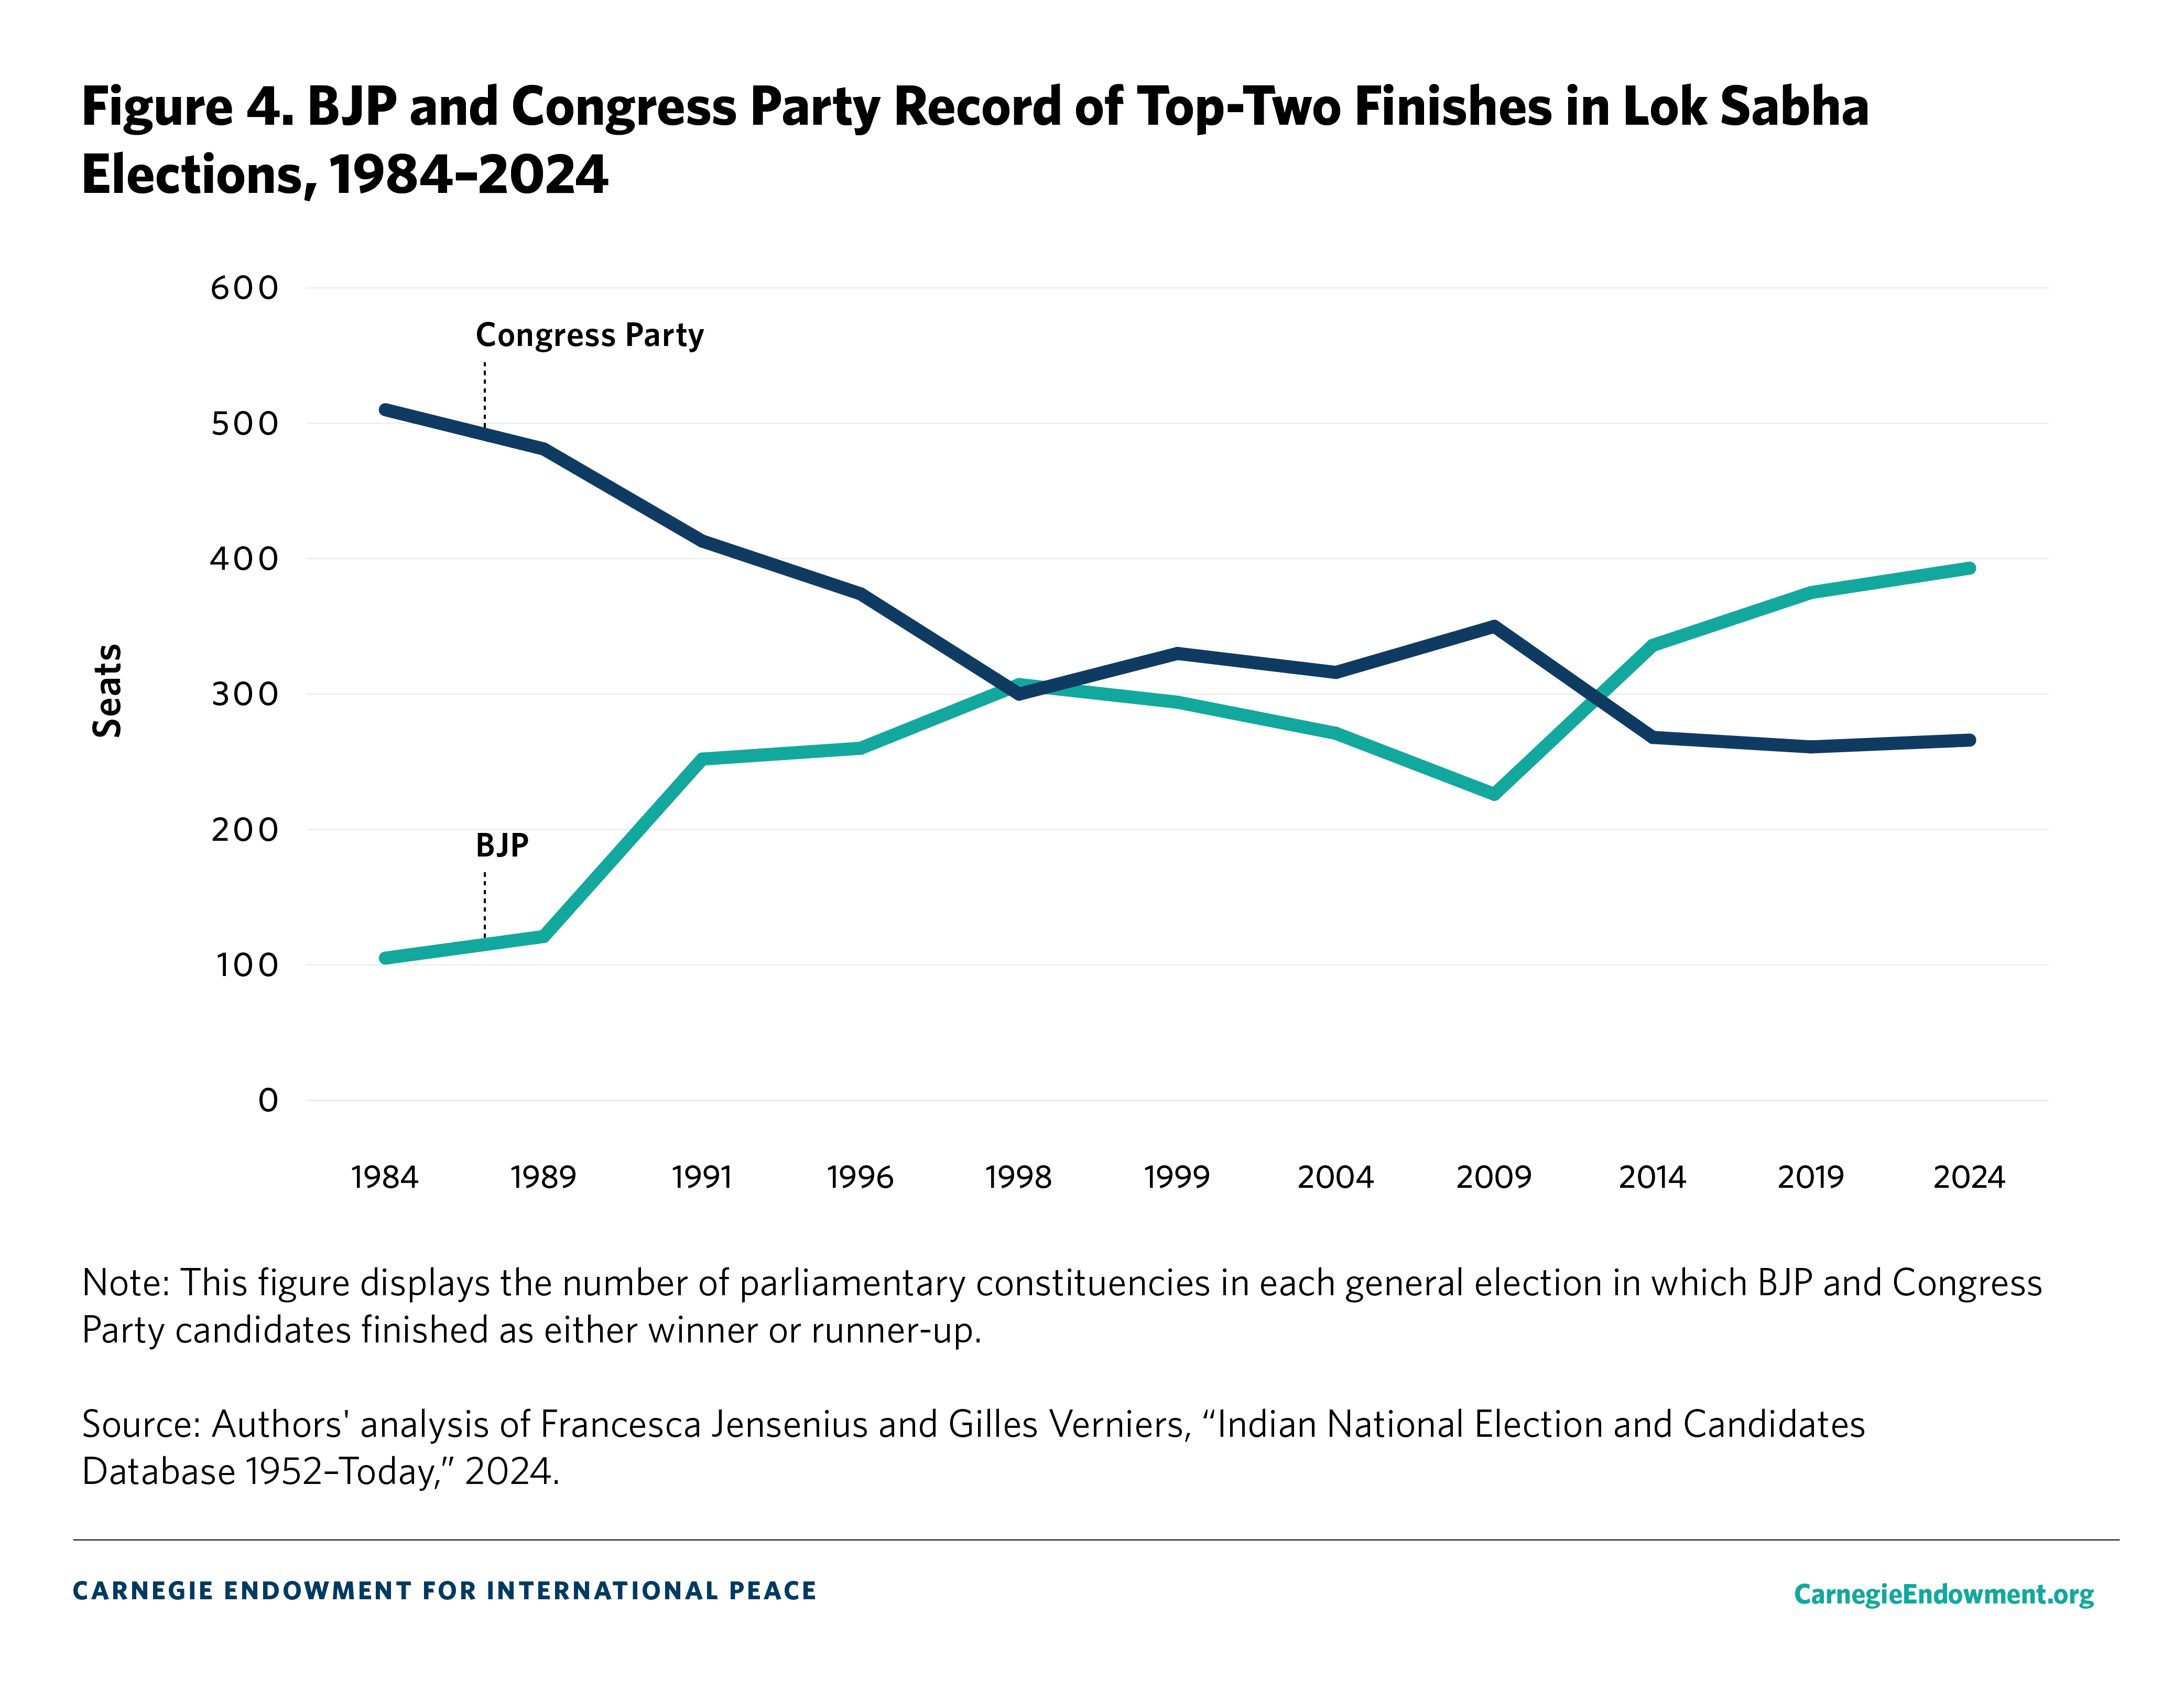
Although the BJP failed to meet both internal and external electoral expectations in 2024, it did emerge as a truly pan-Indian party for the first time in its history. In 2019, the BJP fielded candidates in 436 parliamentary constituencies, compared to 421 for the Congress Party. In 2024, the BJP fielded candidates in 441 constituencies, a new record. The Congress Party, in turn, contested 328 seats—the first time since independence that it fielded candidates in less than 400 seats and a clear sign that the party recognized it must cede greater space to regional partners. Of the 441 seats the BJP contested, it emerged as either the winner or runner-up in 393 instances—an all-time high for the party (see figure 4). The Congress Party was a top-two finisher in 266 seats, roughly on par with its performance in 2014 (268) and 2019 (261).
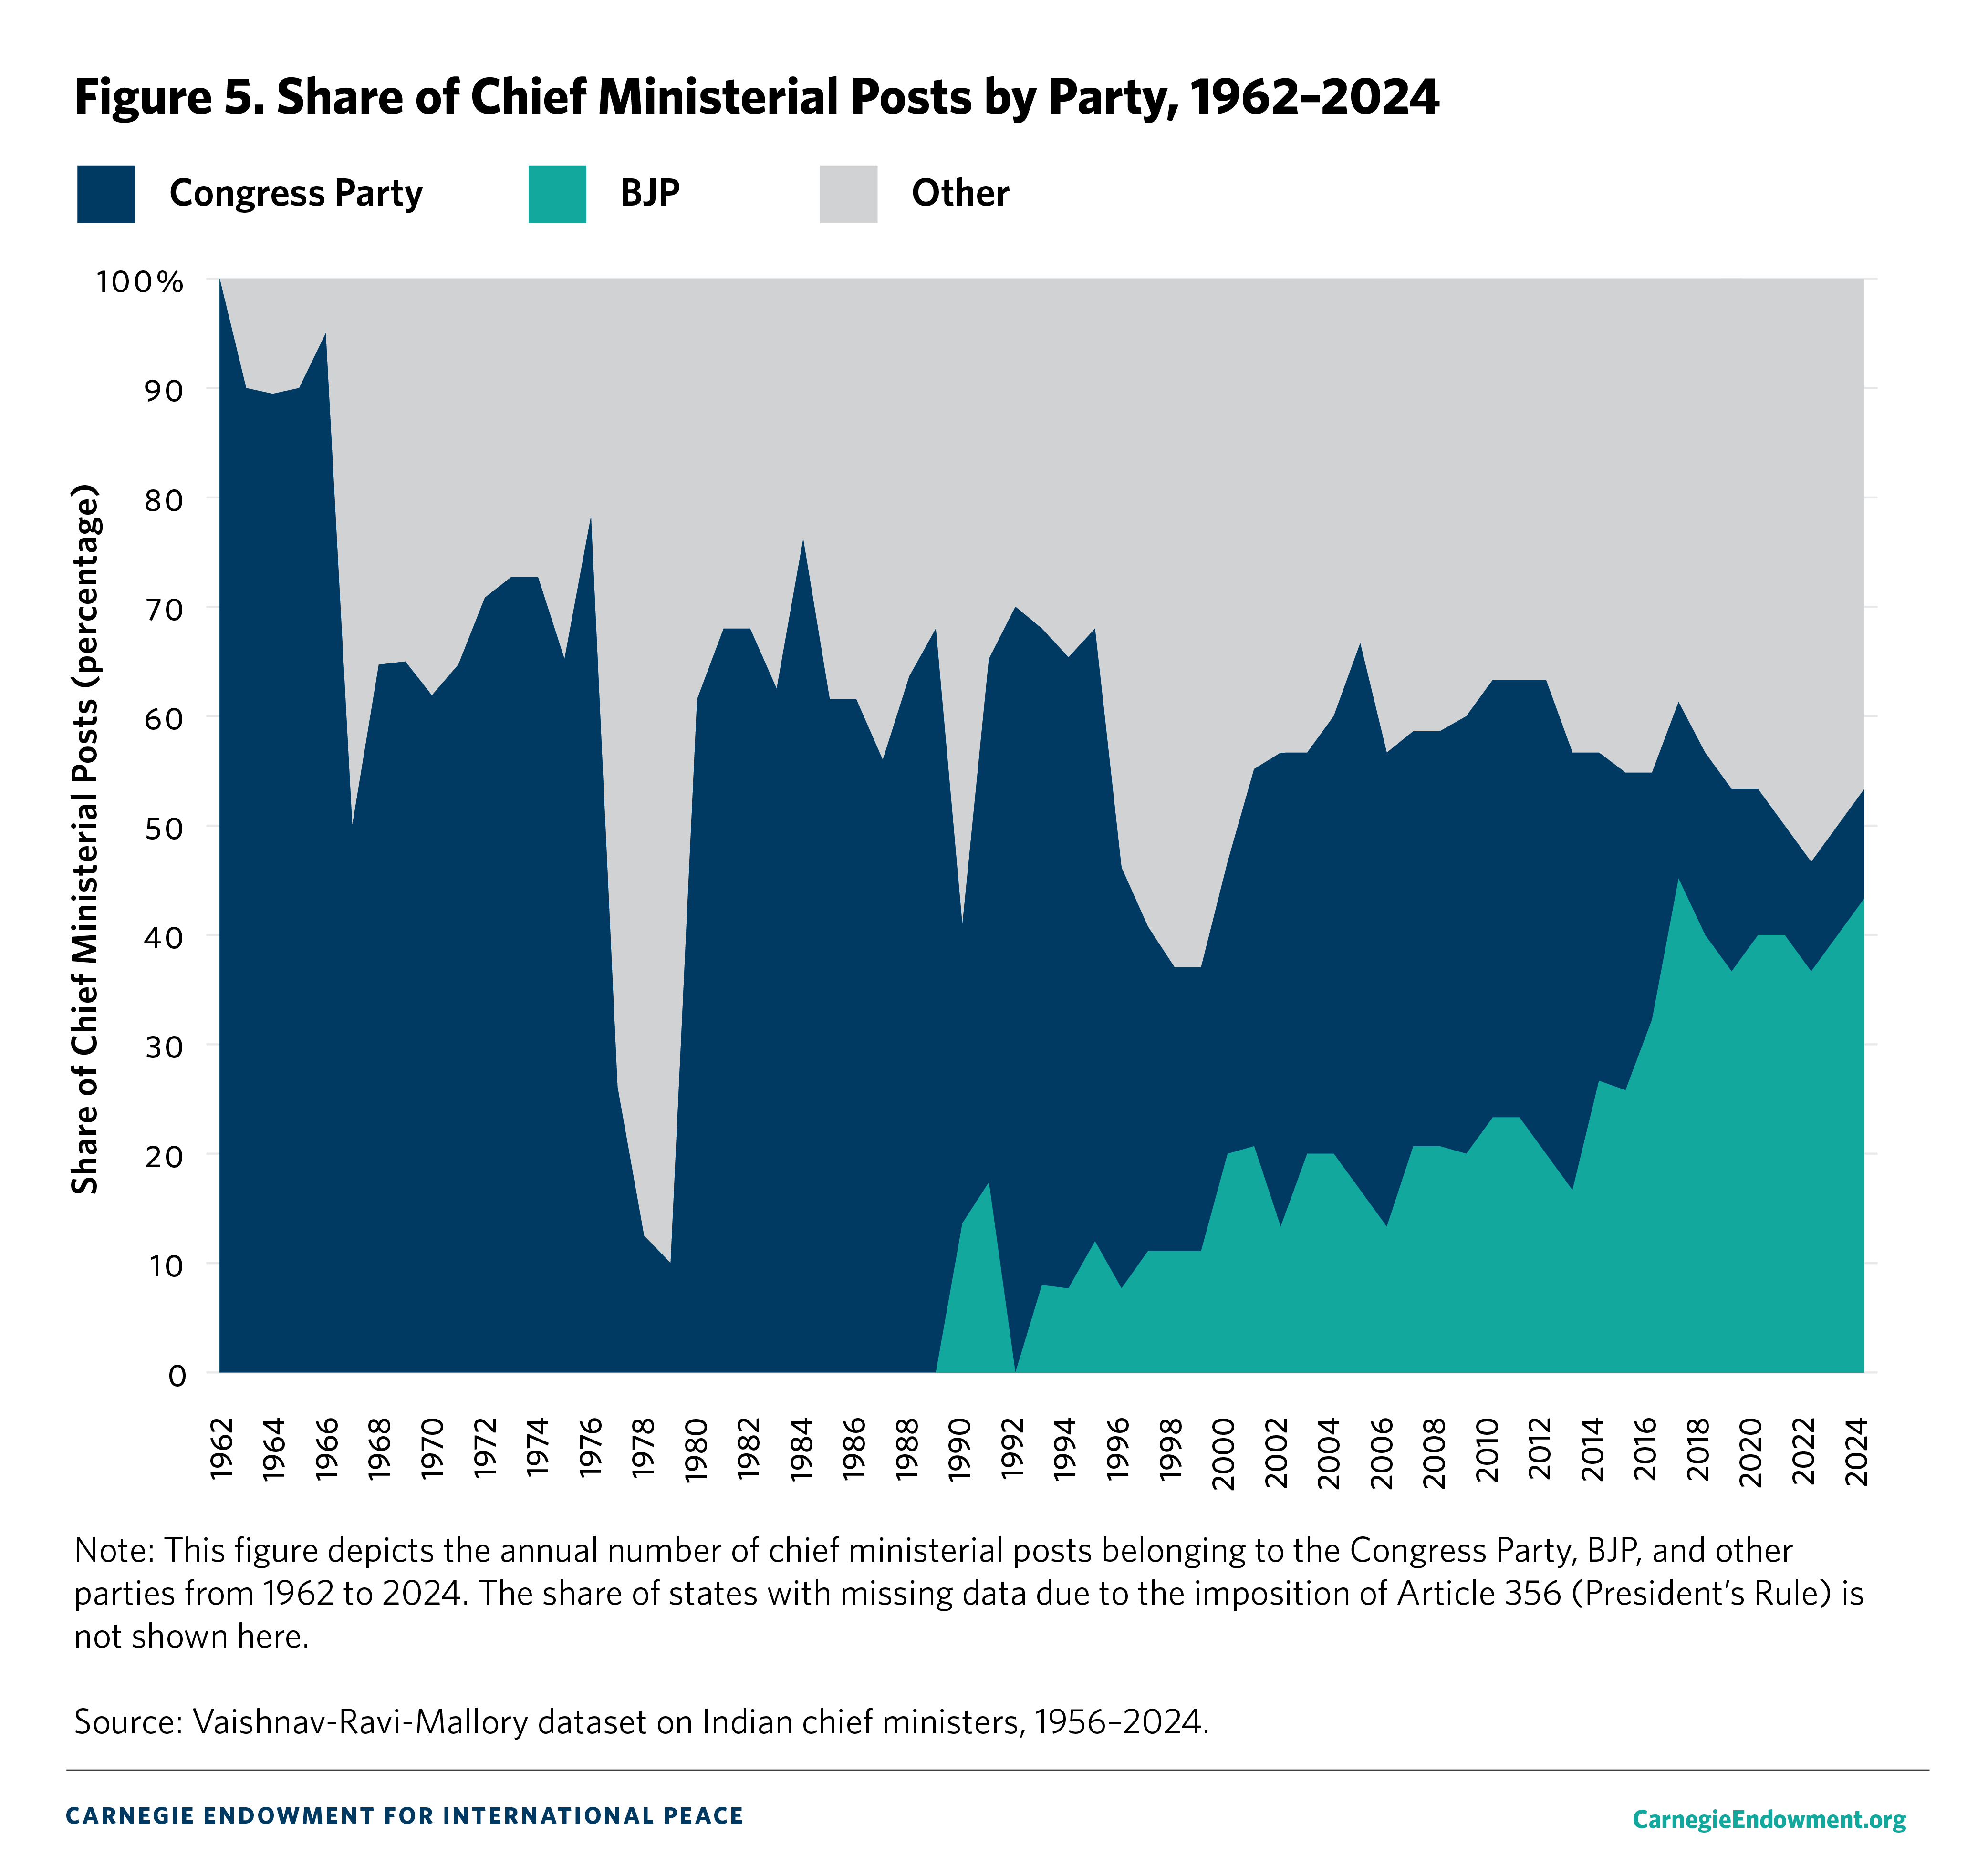
Another way of assessing the BJP’s centrality is to look beyond the national stage and focus instead on the party’s performance at the state level (see figure 5). In India’s federal setup, states—not the central government in New Delhi—have jurisdiction over the most crucial aspects of day-to-day governance that affect their constituents. At the time of writing (September 2024), BJP chief ministers are in office in thirteen states (about 43 percent of all chief ministerial positions). This share fluctuated between 37 and 43 percent over the past five years. At the end of 2013, the year before Modi first came to power, the BJP held only 17 percent of all chief ministerial positions. Since 2016, it has consistently held at least twice as many posts. The current BJP share was last matched by the Congress Party in 2012, when the latter controlled thirteen chief ministerial posts.
As of the time of writing, the Congress Party only boasts chief ministerial posts in Himachal Pradesh, Karnataka, and Telangana, or 10 percent of all such posts. The once-dominant party has not held chief ministerships in the double-digits since 2013. Since the uptick in the BJP’s state-level fortunes in the post-2014 era, the party’s tally of state chief executives has been roughly on par with that of all regional parties combined.
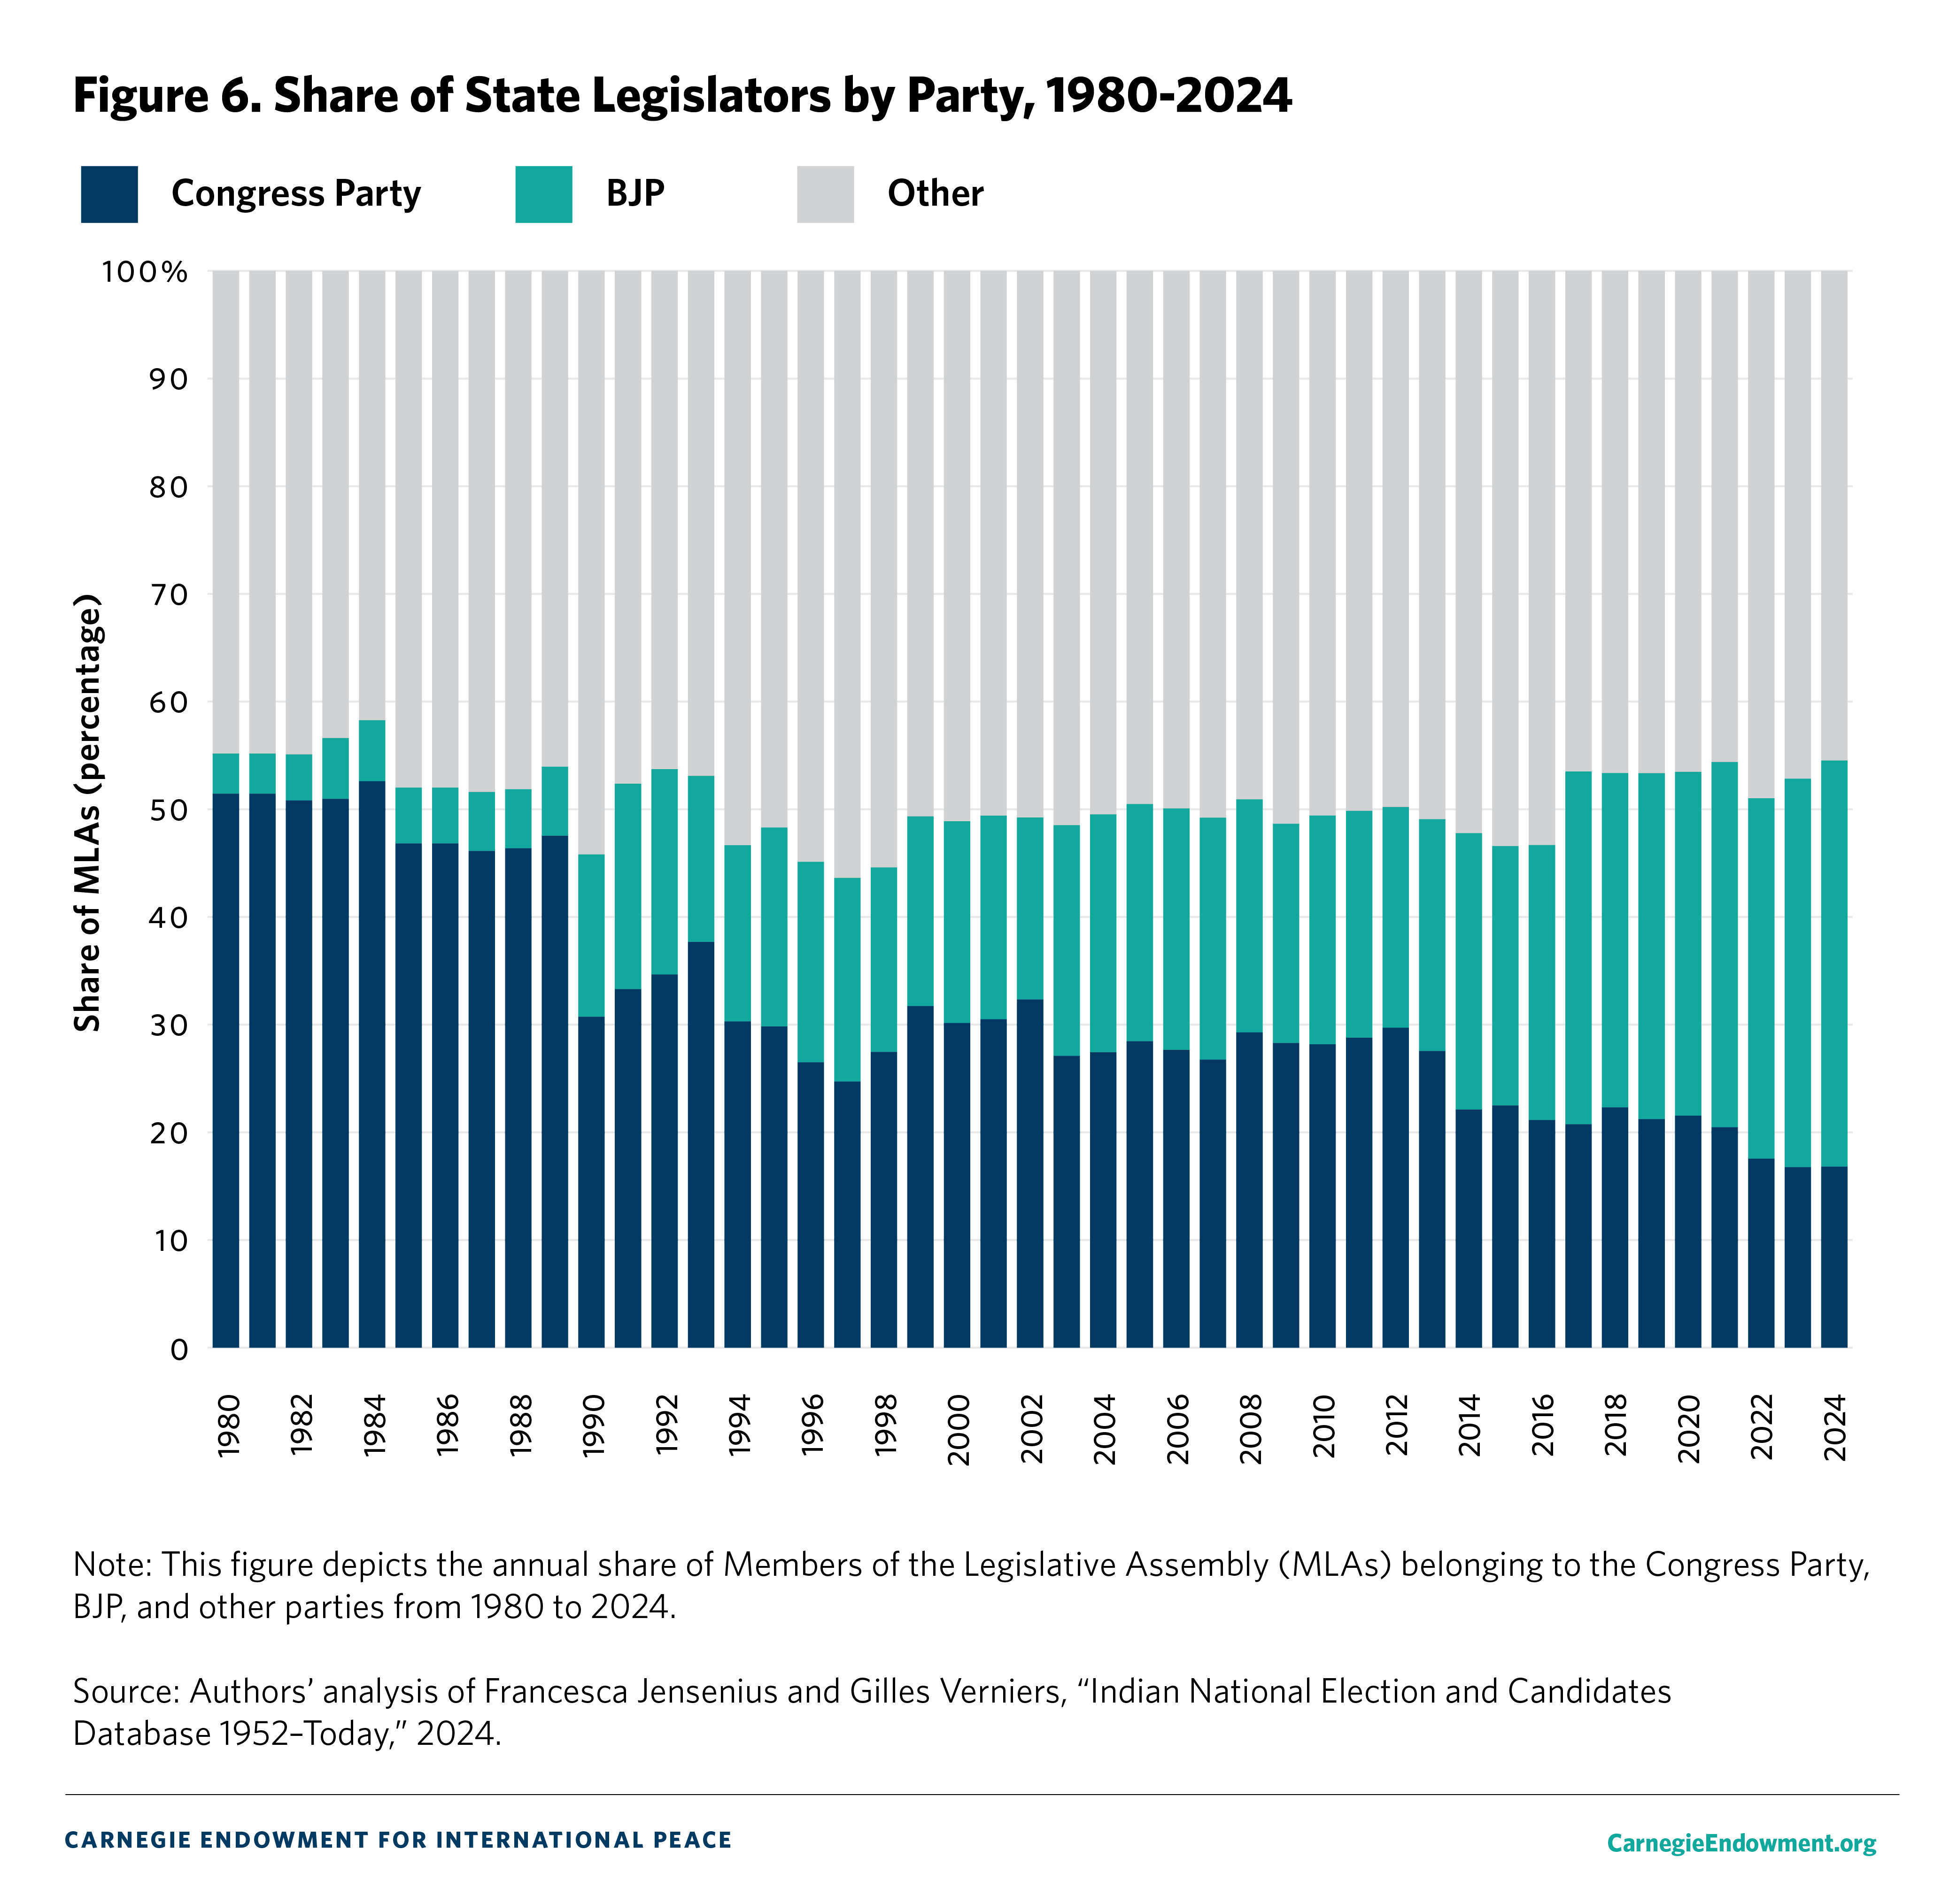
The BJP’s control of state governments has meant that its share of state legislators—or members of the legislative assemblies (MLAs)—has exhibited a corresponding increase (see figure 6). In 1980, just 4 percent of MLAs across India belonged to the BJP. That figure grew to 22 percent in 2004, during the final year of Vajpayee’s tenure.
After stagnating around this level for nearly a decade, the BJP’s share of state legislators rose to 26 percent in 2014 and accelerated to 32 percent in 2019. At the time of writing, the BJP’s share of MLAs stands at 38 percent—an all-time high for the party. The last time the Congress Party enjoyed such a significant share of state lawmakers was in 1993. Parties other than the BJP and the Congress Party, in turn, have possessed a plurality of MLAs since 1990. In 2024, these regional parties’ share of MLAs stands at 45 percent. This number has declined somewhat since the BJP’s resurgence in 2014, when the regional party share of MLAs was 52 percent. From 1994 to 2016, regional parties almost always accounted for a majority of India’s state lawmakers, with the Congress Party’s plurality in 2008 the lone exception.
As these statistics demonstrate, the BJP has significantly expanded its footprint at the state level, especially in the post-2014 era. Nevertheless, despite three consecutive BJP general election victories, the party has not achieved state-level dominance by any stretch. In the sixty-six state assembly elections held since the start of 2014, the BJP has formed the first postelection government in roughly half of all states. And in the thirty-four cases where it formed the government, it did so with a single-party majority in only half of all instances.
A final indicator of the BJP’s systemic import comes from data on membership from India’s upper house of parliament. The Rajya Sabha has a maximum of 245 members, 233 of which are indirectly elected by the state assemblies to serve staggered six-year terms. The other 12 members are appointed by the president based on their contributions to art, literature, science, and social service. These nominated members are allowed to affiliate with political parties within six months of their selection. Every two years, roughly one-third of Rajya Sabha terms expire and new members of Parliament (MPs) are selected. Because nearly all Rajya Sabha MPs are chosen by state legislatures, they are a proxy for a party’s subnational strength.
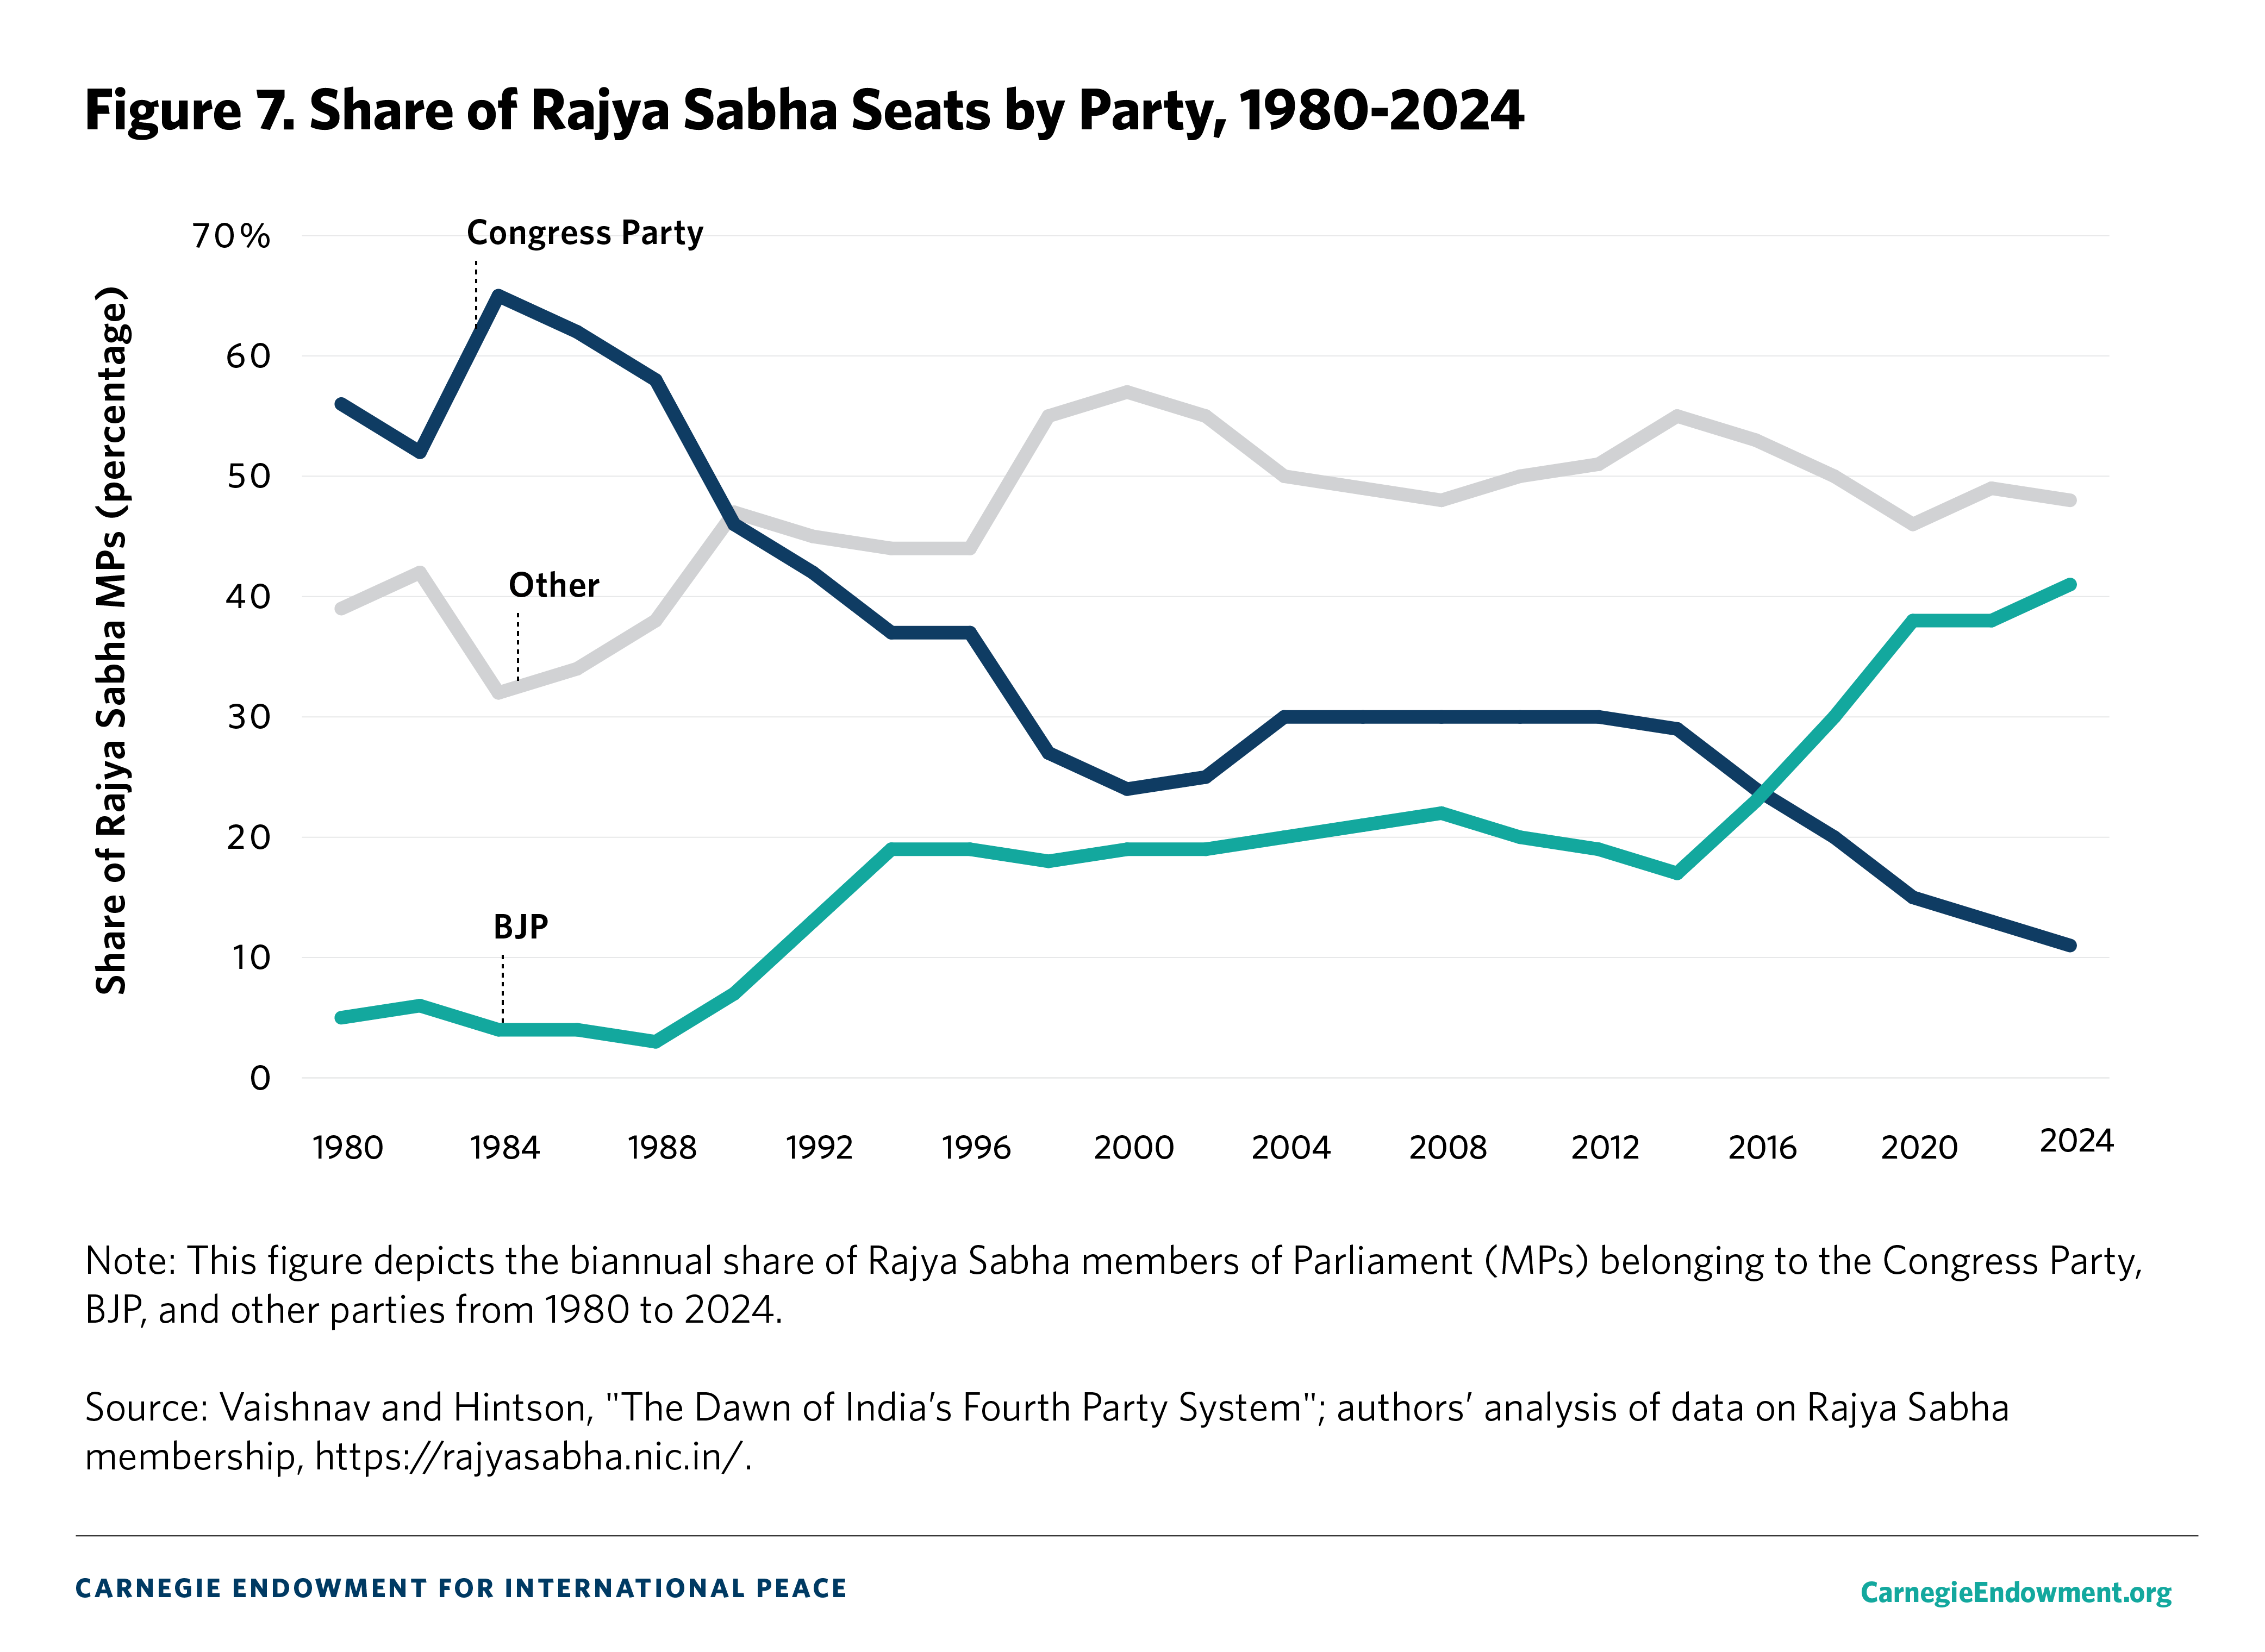
At the time of writing, 41 percent of Rajya Sabha MPs belong to the BJP—a figure that has remained roughly constant since 2020 (see figure 7). This is more than double the share of upper house MPs belonging to the BJP in 2012. As of September 2024, parties other than the BJP and the Congress Party account for 48 percent of upper house MPs, while the Congress Party held a 11 percent share—its lowest proportion on record. After Rajya Sabha elections in late August 2024, the BJP has 96 MPs in the upper house, and its alliance holds a bare majority.19
Overall, the latest data suggest the BJP retains a dominant political position. Nationally, its vote share has declined by a single percentage point, with losses in the Hindi heartland largely offset by gains in eastern and southern India. While the Congress Party has enjoyed a revival, its vote and seat share tally lag well behind the BJP’s. In general elections, the geographic zones in which the BJP exerts influence have multiplied, while they have shrunk for the Congress Party. This fact becomes more evident when examining state politics; BJP chief ministers hold power in more than forty percent of Indian states, and nearly four in ten state legislators belong to the BJP. The BJP’s growing presence in India’s states, in turn, has strengthened the party’s footing in India’s indirectly elected upper house, where its alliance holds a bare majority of seats.
A second key attribute of the third party system was rising levels of political fragmentation. This was driven by two factors. First, as the Congress Party’s grip on power weakened in the 1960s and 1970s, its authority was increasingly challenged by caste and regional-based interest groups. Many of these new parties were founded by dissident Congress Party members who grew frustrated with the party’s representational hypocrisy.20 While the party touted its status as a catchall party uniquely capable of representing a diverse mélange of caste, regional, and linguistic interests, the reality on the ground often fell far short of these boasts. As new political entrepreneurs struck out on their own, their successes—aided by their ability to play kingmakers in an era of coalitions—fueled further splintering.21
In 1952, 53 parties fielded parliamentary candidates in the country’s inaugural general election. That number declined to 35 by 1984 before exploding to 113 in 1989, the year coalition politics came to New Delhi.22 Since then, the number of parties contesting Indian general elections has grown steadily; in 2024, as many as 744 distinct parties had candidates in the fray, not to mention the 3,920 candidates contesting as independent candidates without a party label.23
However, many of these contesting parties had little chance of winning even a single parliamentary seat. Indeed, since 1962, an average of only 28.6 parties have been represented in each session of the Lok Sabha.24
For this reason, political scientists do not usually look at the absolute number of parties fielding candidates or even the subset of those with a presence in the legislature. Instead, they prefer to calculate the effective number of parties (ENP), a measure that weighs parties by the number of votes (or seats) they actually earned.25 In practice in India, this means the effective number of parties mechanically declines during eras of dominant party rule (see figure 8).
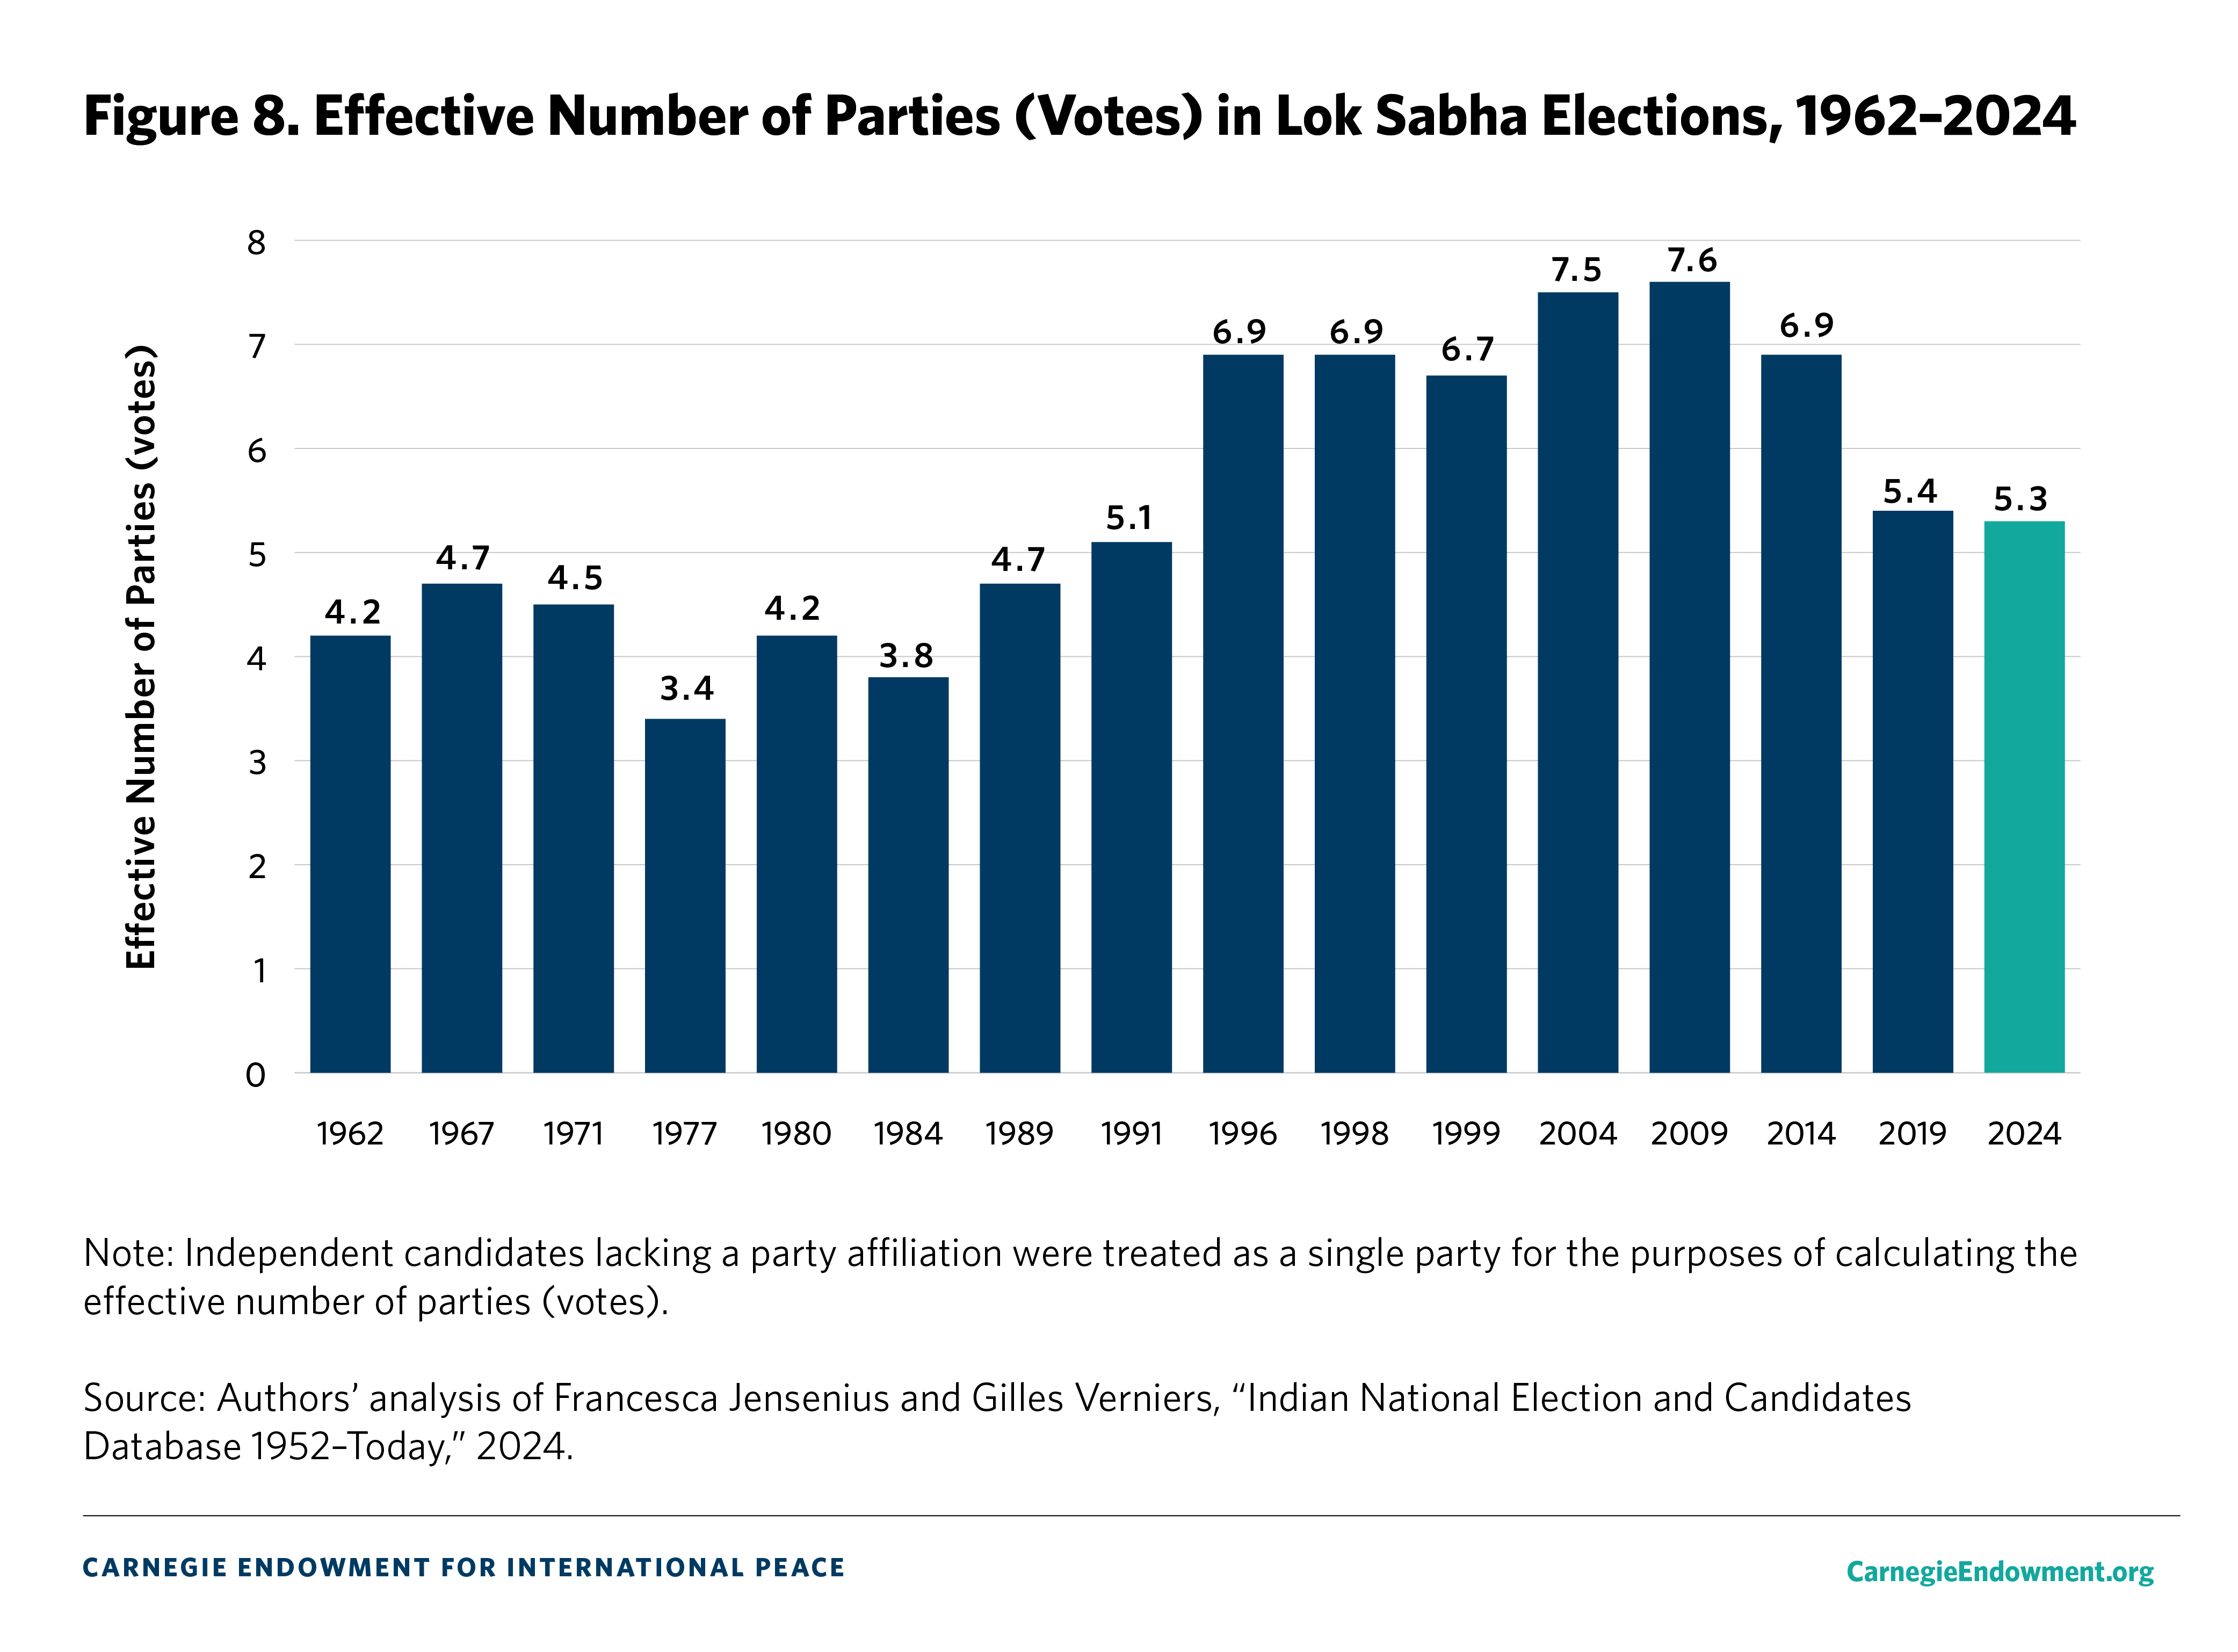
Between 1962 and 1989, the ENP for votes remained under 5, ranging from 3.4 in 1977 to 4.7 in 1967 and 1989. During the coalition era, these numbers grew significantly, peaking at 7.6 in 2009—the year the Congress Party–led UPA government was reelected for a second term. This period, in retrospect, reflected the high point for party fragmentation. Beginning in 2014, but more substantially five years later, the ENP for votes declined significantly—to 5.4 in 2019. In 2024, this metric hardly budged, exhibiting a value of 5.3.
With regard to ENP for seats, which weighs a party’s performance by the number of seats it secured in Parliament, a similar trend emerges (see figure 9). The ENP for seats after India’s 1962 general election stood at 1.9. This low figure demonstrates how dominant the Congress Party was during this early period. However, the ENP for seats surged in 1989 to 4.1 and reached its apex in 2004, after which it exhibited a steady decline. In 2014, the ENP for seats stood at 3.5, and it fell further to 3.0 in 2019.
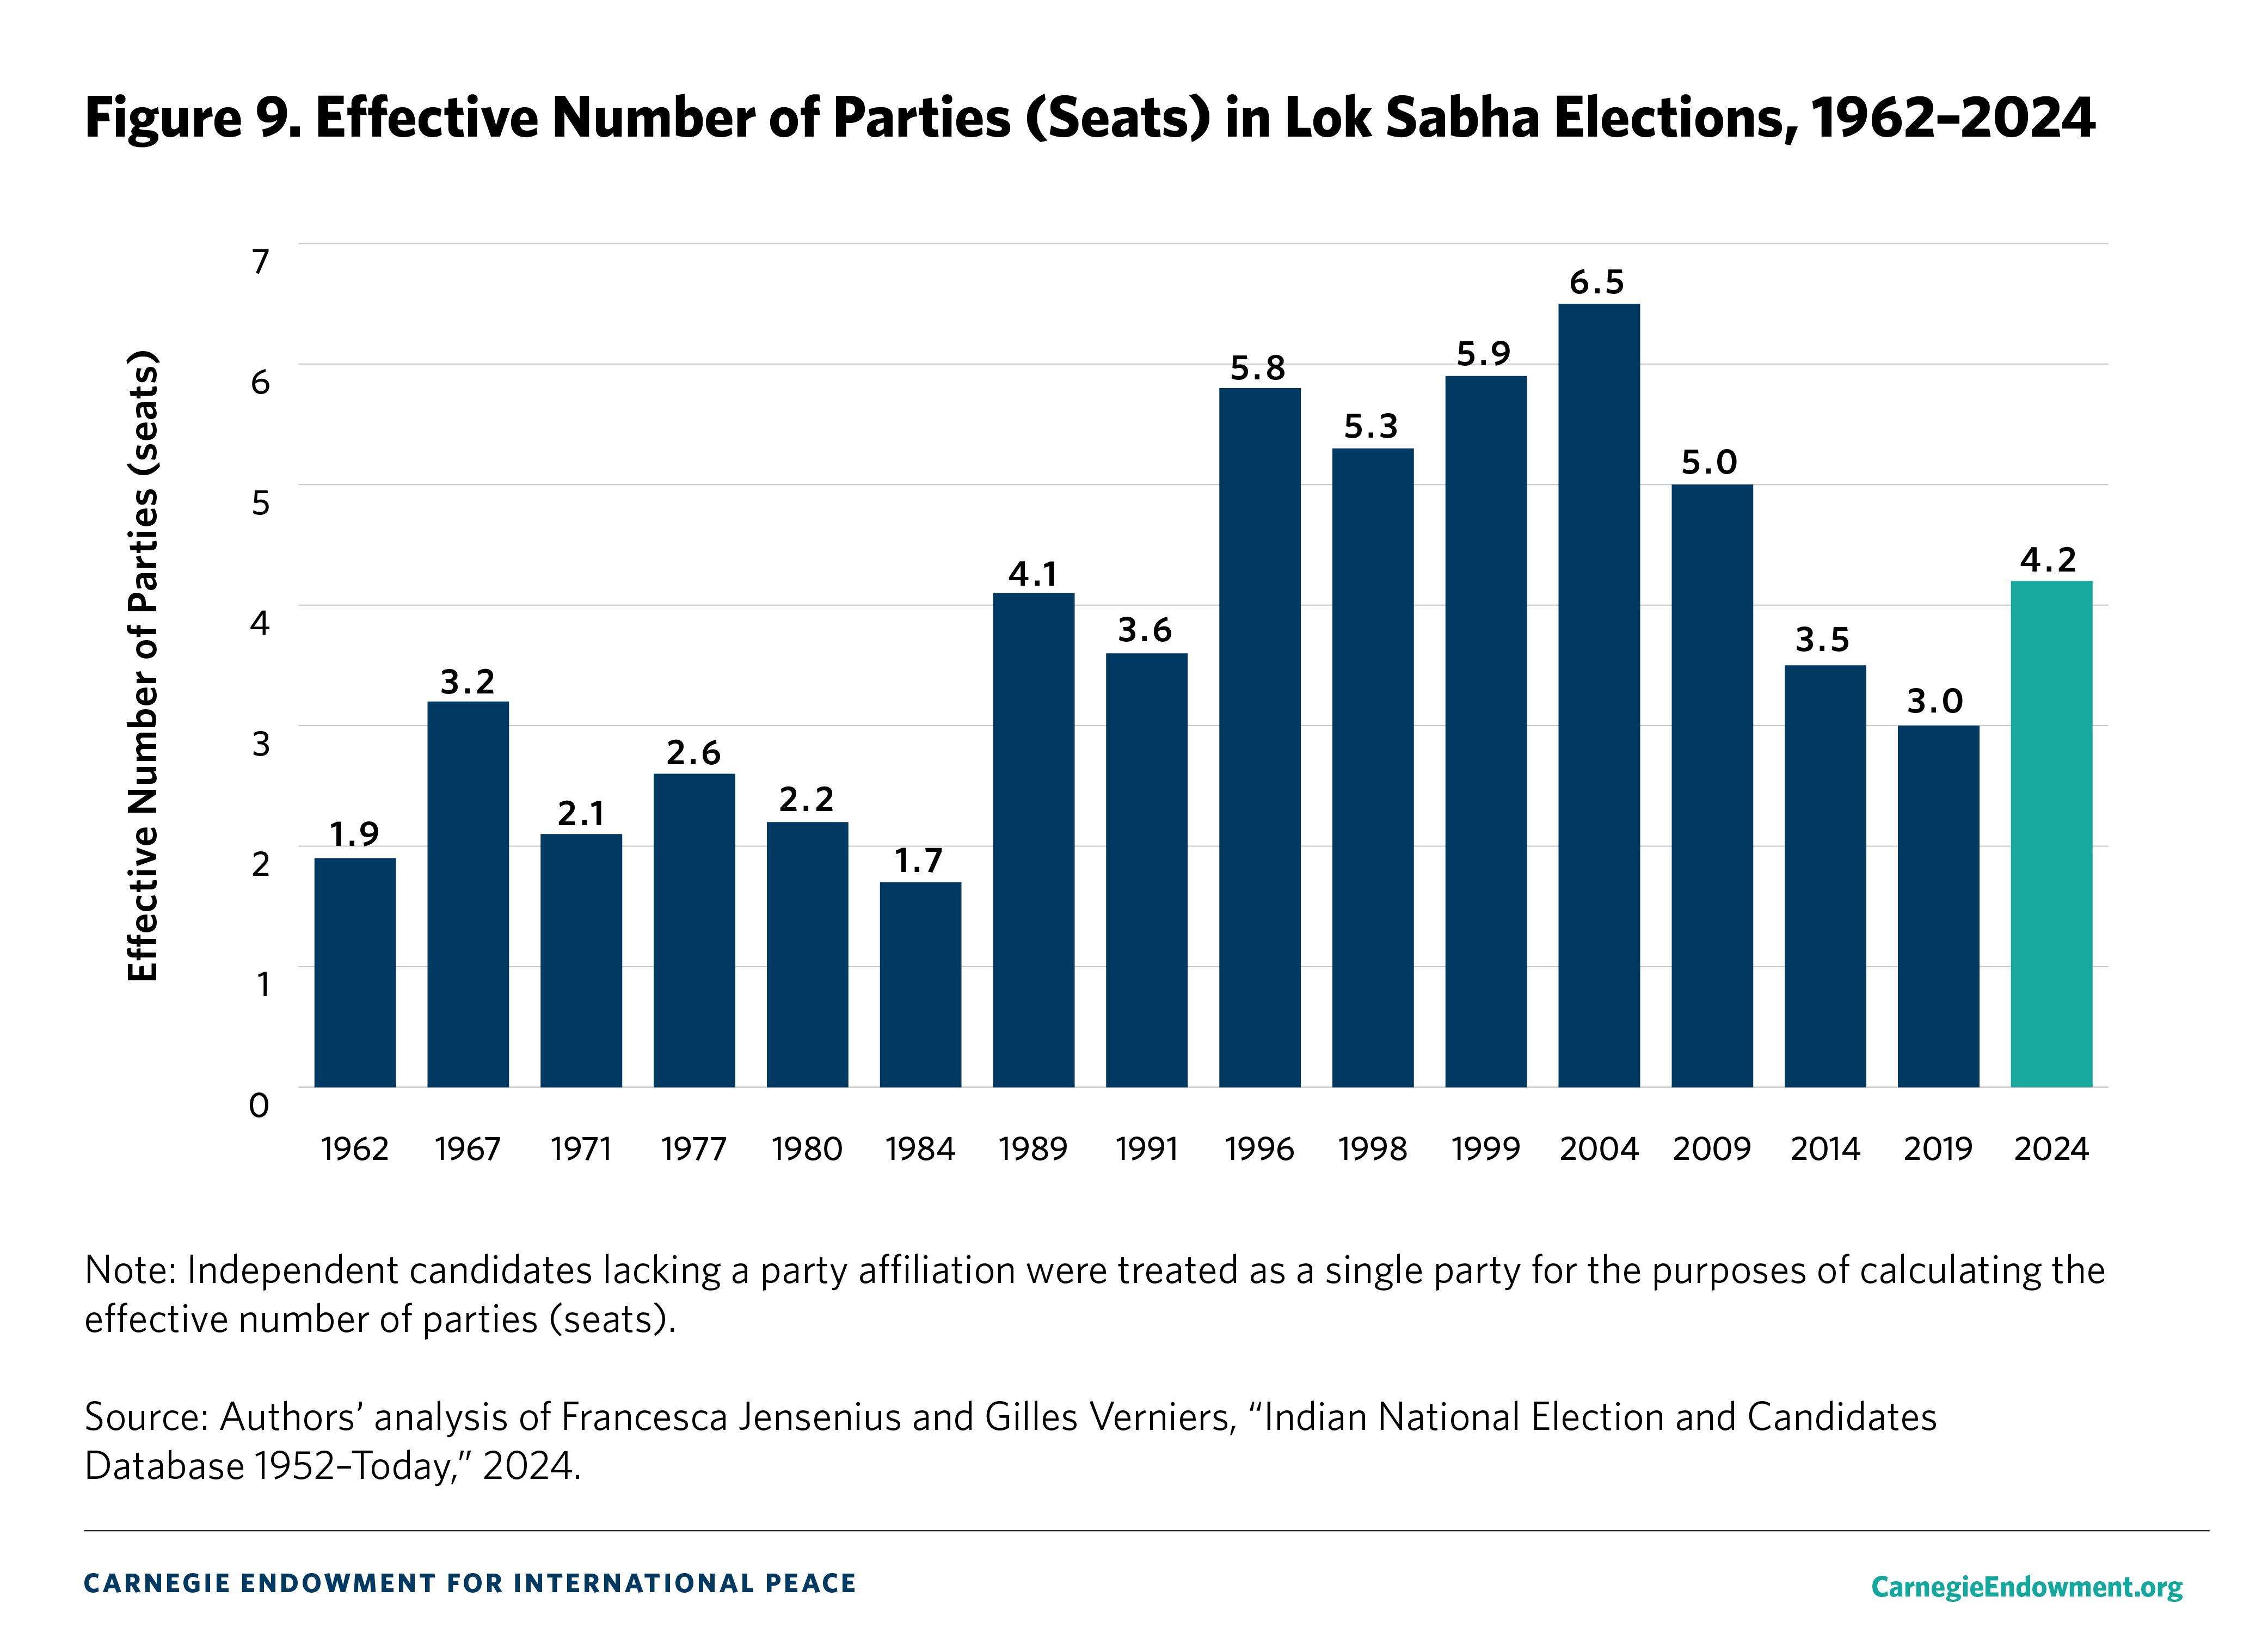
On the metric of ENP for seats, however, there has been some sign of reversal. The ENP for seats grew to 4.2 in 2024, a level comparable to the year 1989. This is a sharp rise from the ENP value of 3.0 five years prior. The divergence between the ENP for votes and seats indicates that vote fragmentation has not changed much in 2024 relative to 2019—a finding that aligns with the consistency in the BJP and Congress Party’s vote share—but fragmentation in terms of legislative seats has grown. This is likely an artifact of India’s first-past-the-post electoral system in which a small shift in votes can result in a disproportionate change in seats.26
Overall, vote fragmentation has not changed significantly in the past five years; the ENP for votes in 2024 is at roughly the same level as 2019. However, fragmentation in terms of seats has increased, though it is still lower than during the coalition period.
The third party system witnessed rising levels of political competition, a trend that was firmly reversed in the post-2014 era, when the BJP was able to exert dominance. The 2024 election results suggest a modest shift toward more competitive elections, relative to 2019, according to several different metrics.
The simplest way of measuring the degree of competition in any democratic political system is to calculate the average margin of victory—or the difference in the vote share of the winner and the immediate runner-up—across parliamentary constituencies in a national election (see figure 10). The average margin of victory in an Indian general election peaked at 26.1 percent in 1977—the year that the Congress Party was defeated after the lifting of emergency rule. Since then, it has exhibited a considerable decline, plummeting to 9.7 percent in 2009. What this statistic means is that the average winner in a Lok Sabha constituency in 2009 defeated the runner-up by slightly less than ten percentage points.
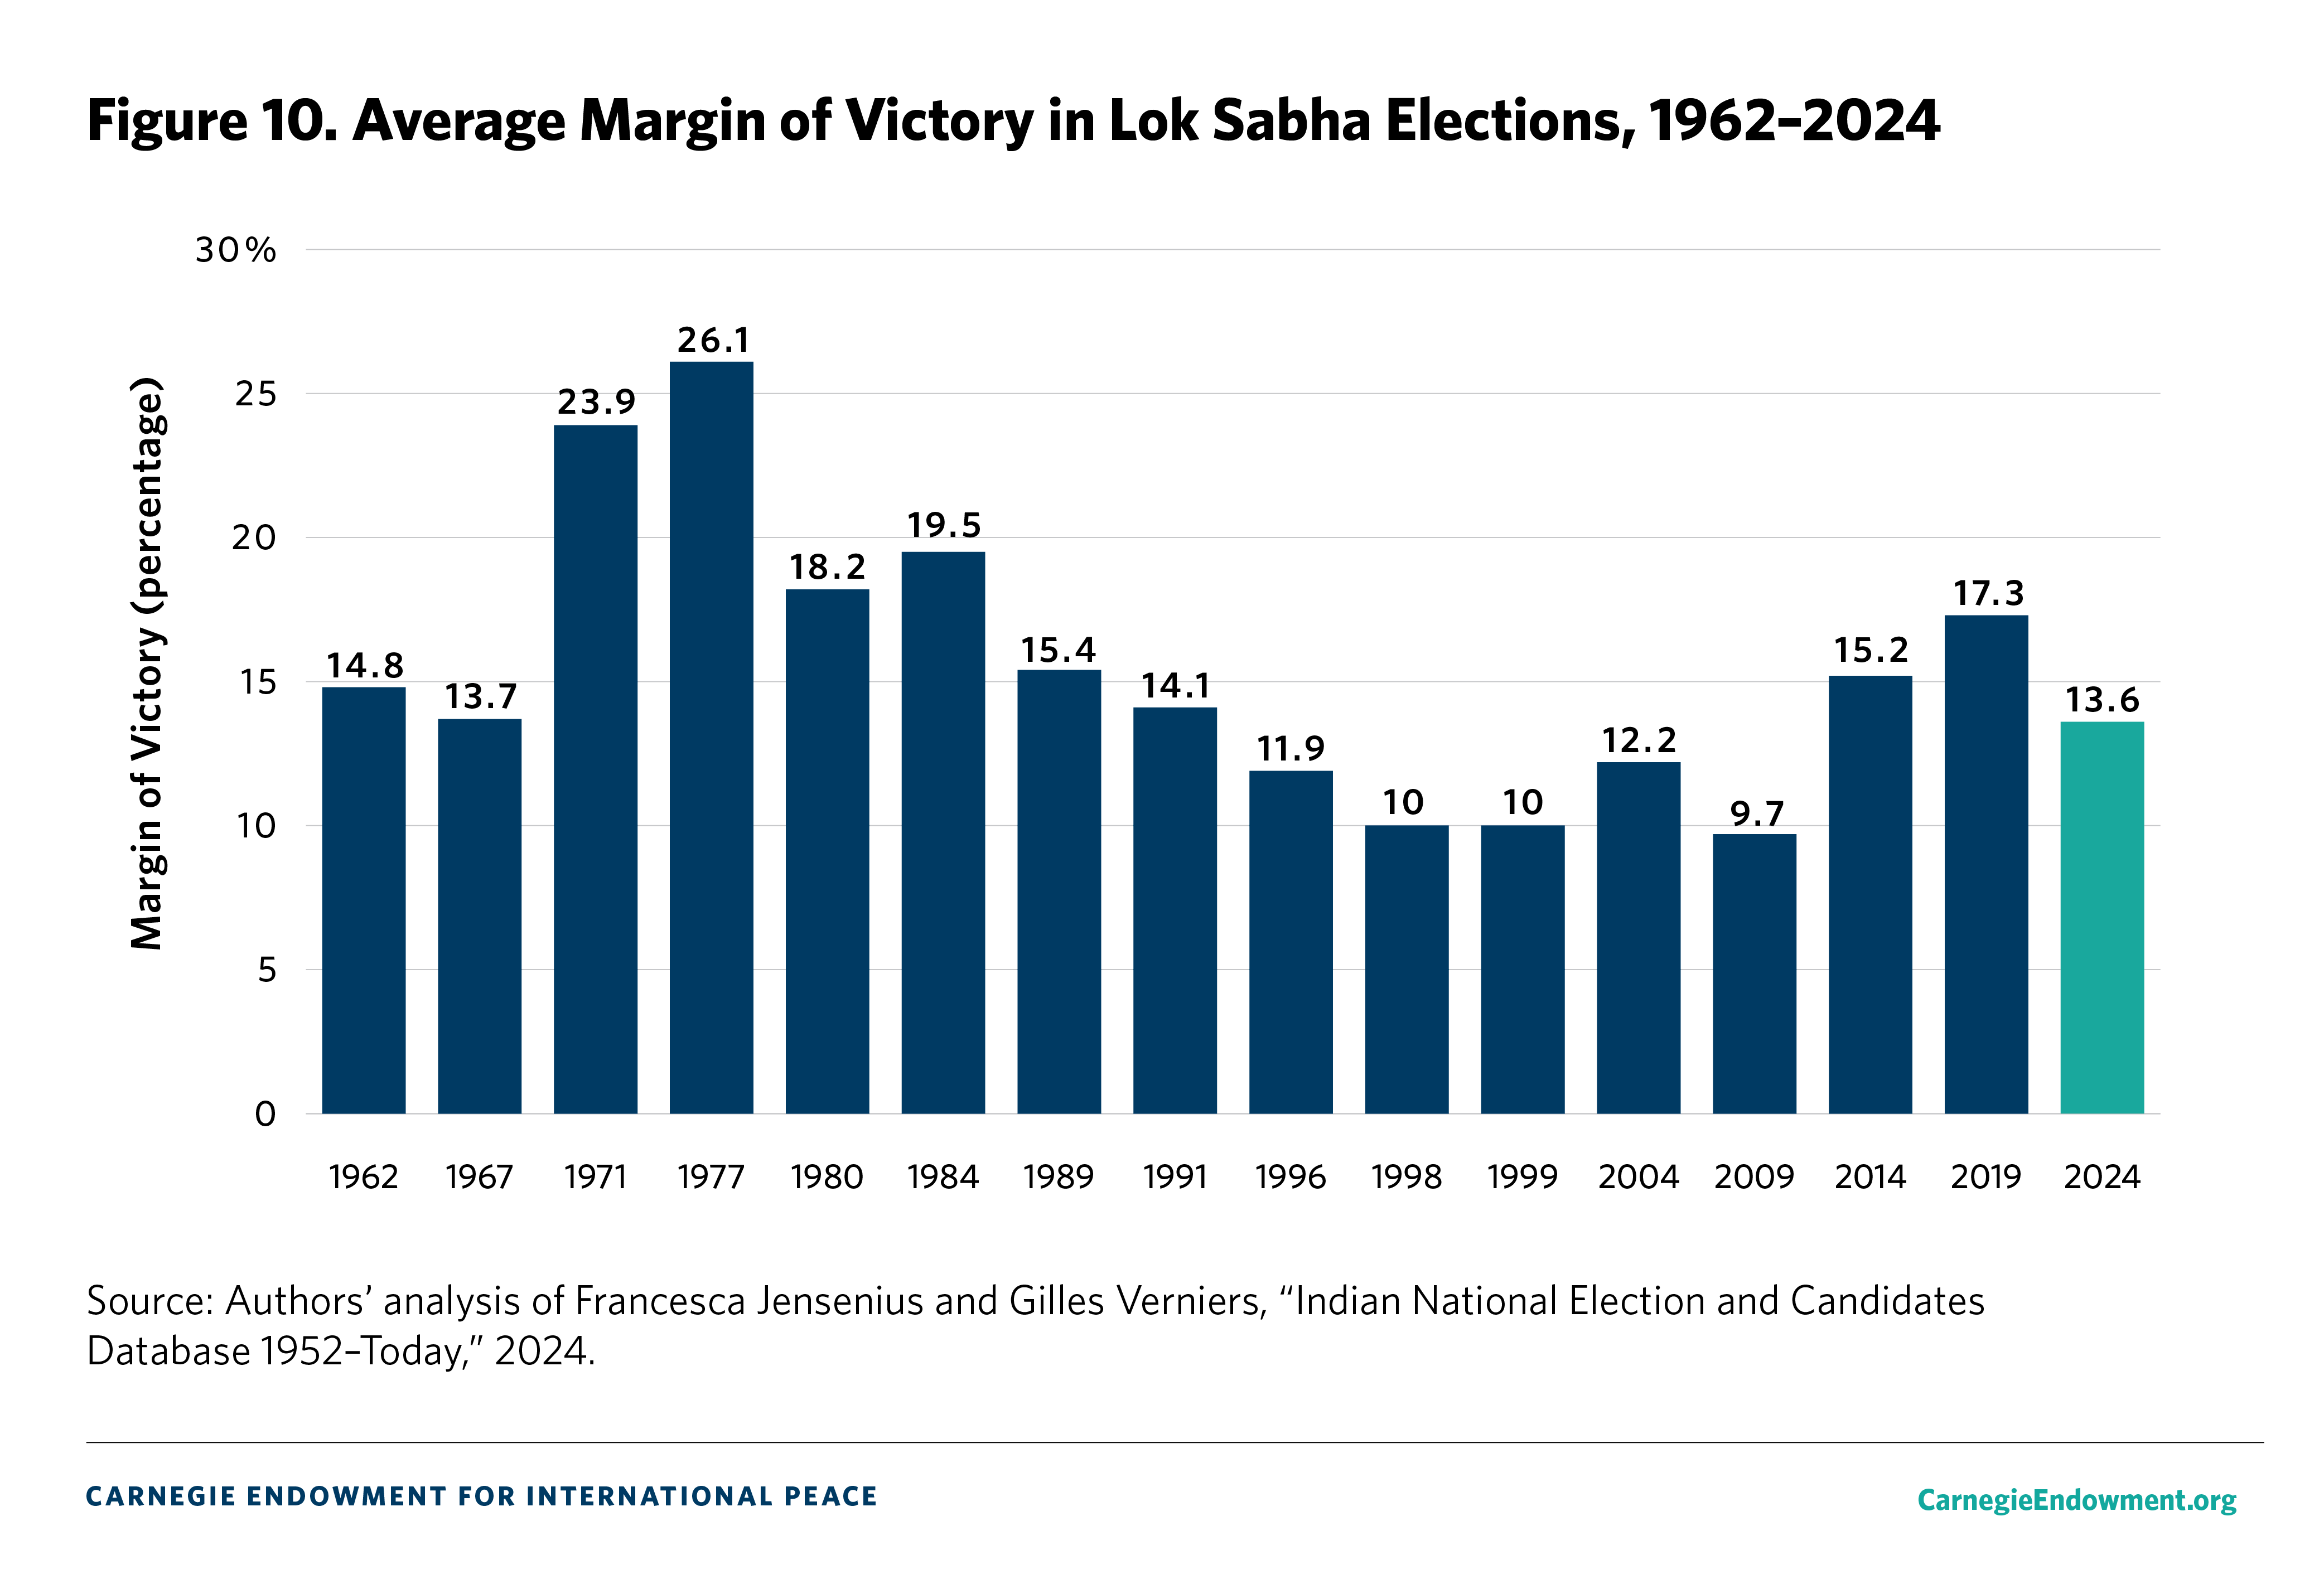
With the BJP’s rise to power in 2014, this trend sharply reversed, with the average margin touching 15.2 percent. By 2019, it had grown to 17.3 percent, signifying that constituency-level elections had become appreciably less competitive in the fourth party system. Based on this measure, 2024 marks another partial reversal as the average margin fell to 13.6 percent—higher than every election since 1991 but a twenty percent decline from 2019 levels.
Another way of measuring competition is to calculate the vote share of the winning candidate (see figure 11). In India’s first-past-the-post system, the candidate who earns the most votes in a constituency wins the seat, irrespective of whether they win a majority of votes. Indeed, given that there are typically more than two competitive candidates in a constituency, it is not uncommon for the winning candidate to secure far less than fifty percent of the total votes cast.
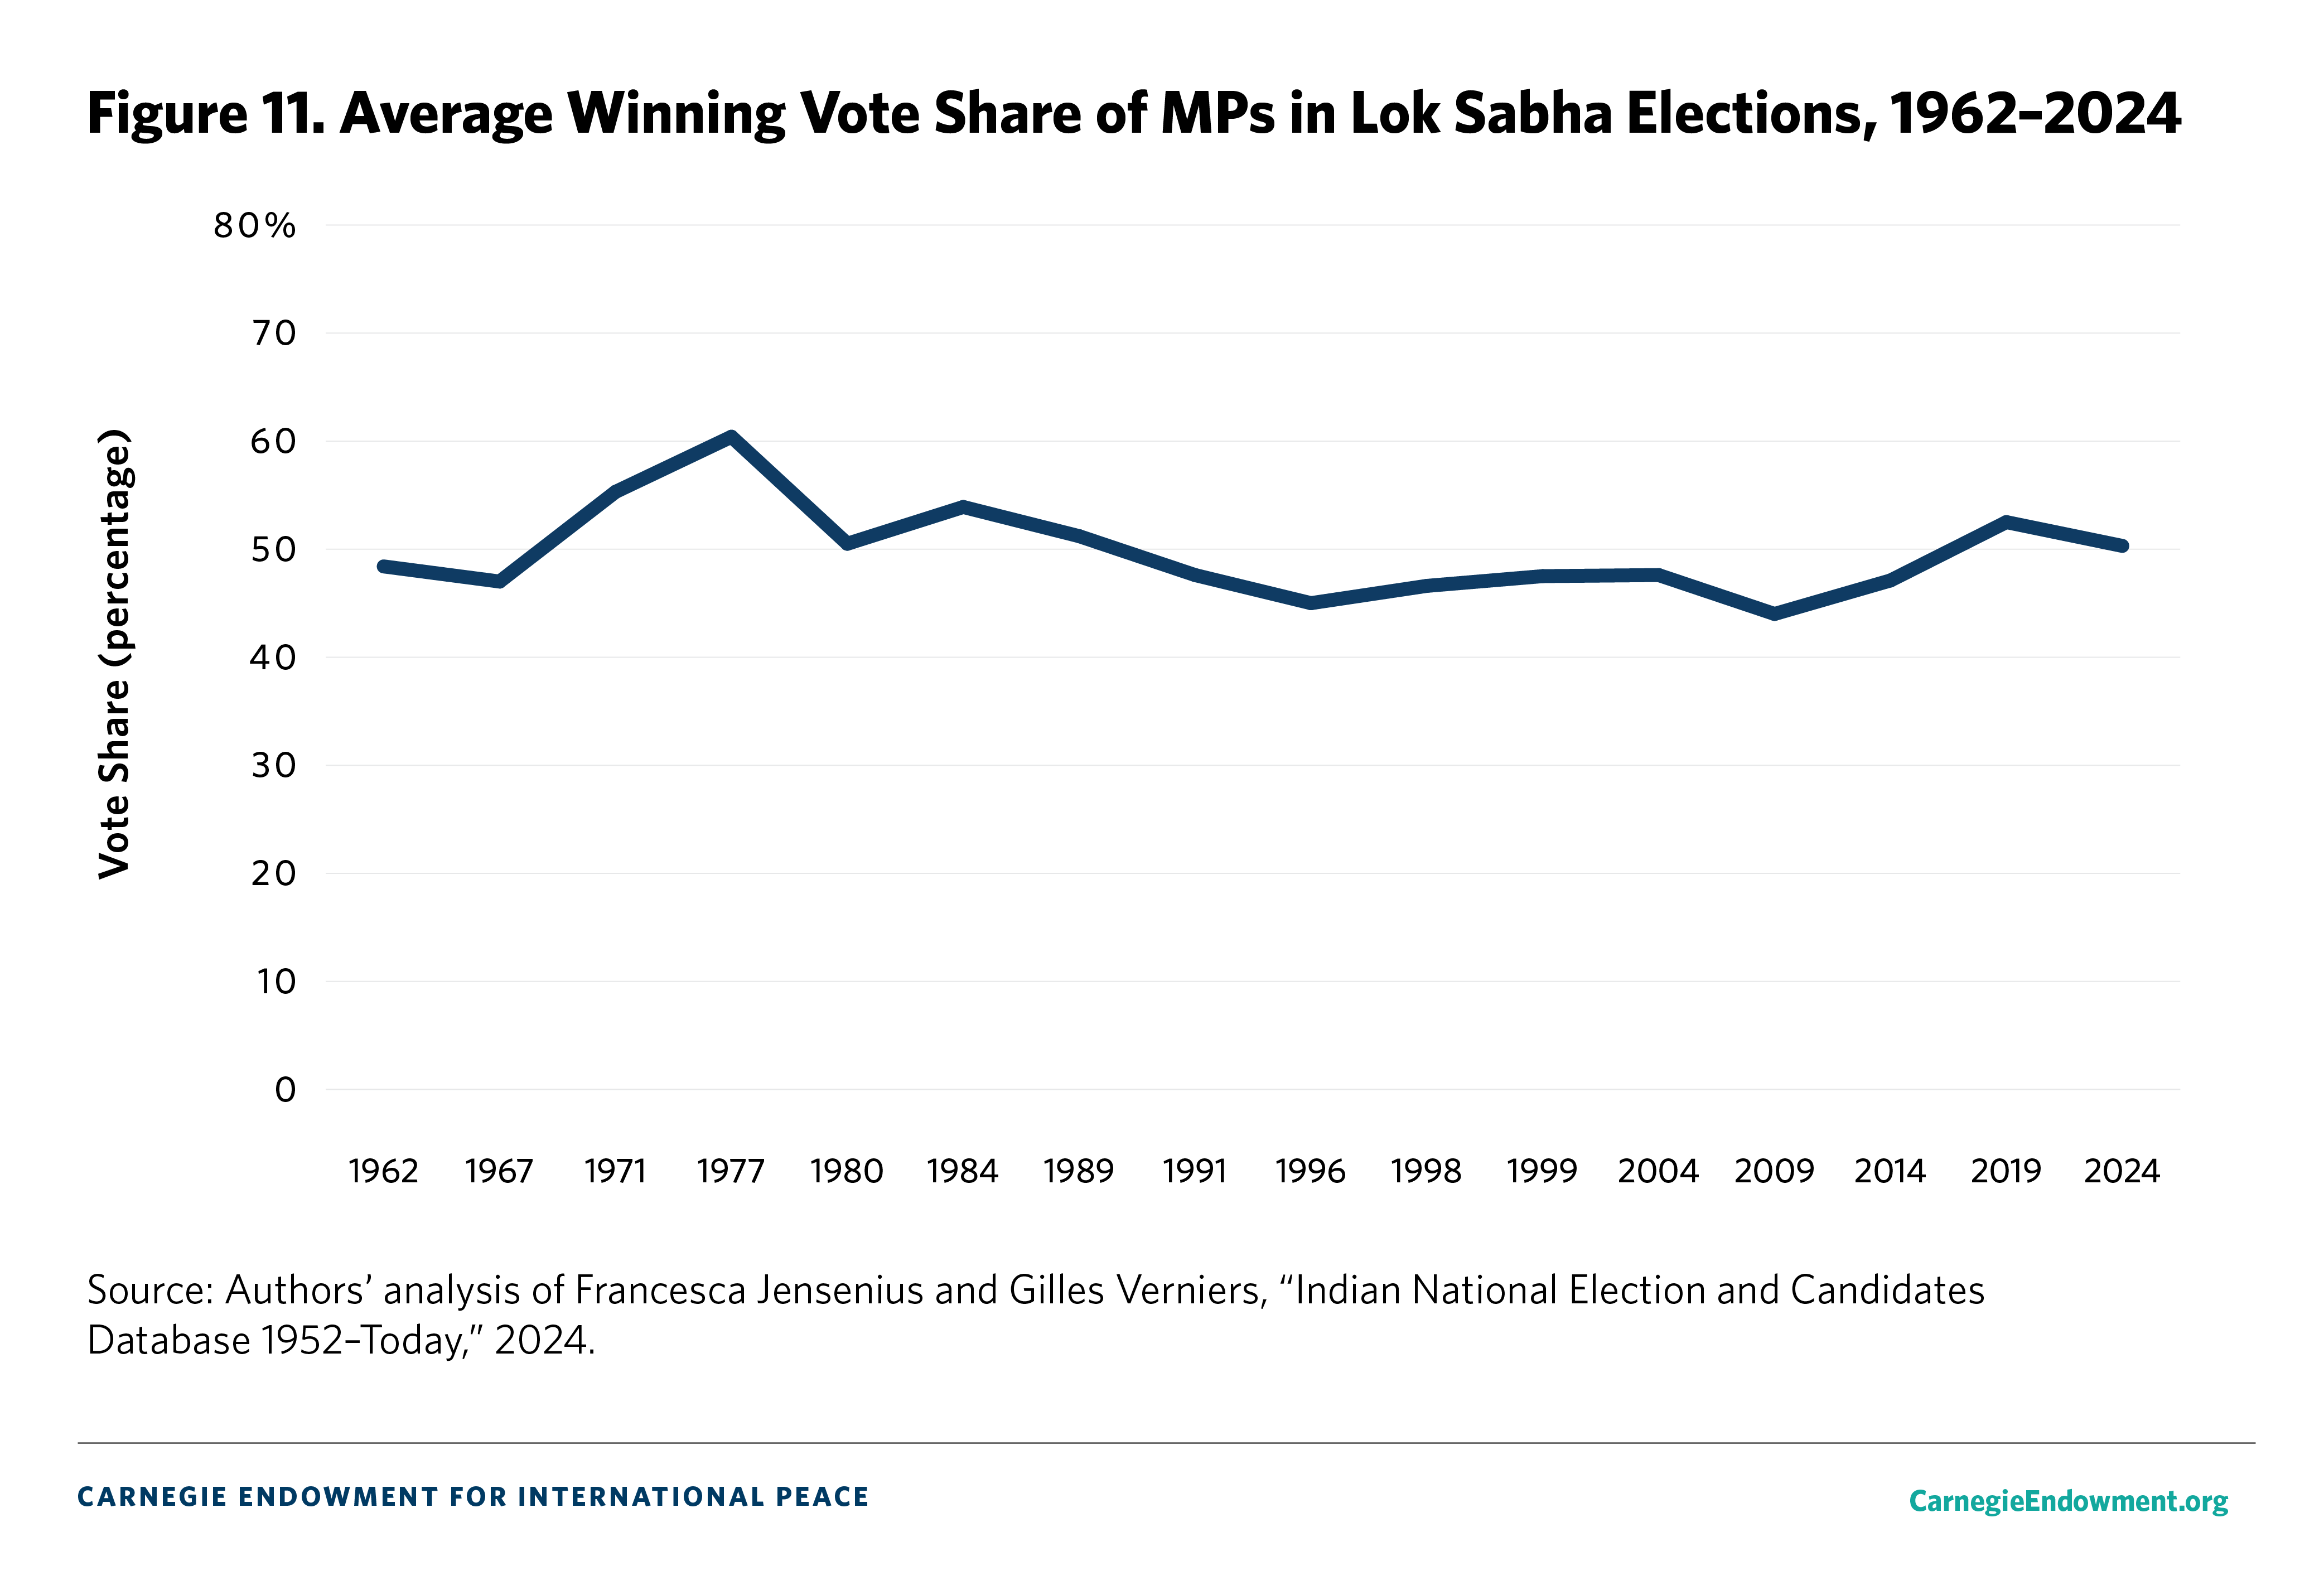
As the figure demonstrates, the average winning vote share in Lok Sabha elections steadily declined during the period of the third party system. In 1989, the average winning vote share stood at 51.2 percent, but by 2009, it had sunk to 44 percent. Things changed in 2014. That year, the average winning MP earned 47.1 percent of the constituency vote, a three percentage-point increase from 2009 levels. The average winning vote share climbed further to 52.5 percent in 2019, meaning that the average general election winner garnered a simple majority of votes in their constituency. The average winning vote share of a successful general election candidate dipped slightly to 50.3 percent in the 2024 polls, indicating a modest increase in the level of political contestation.
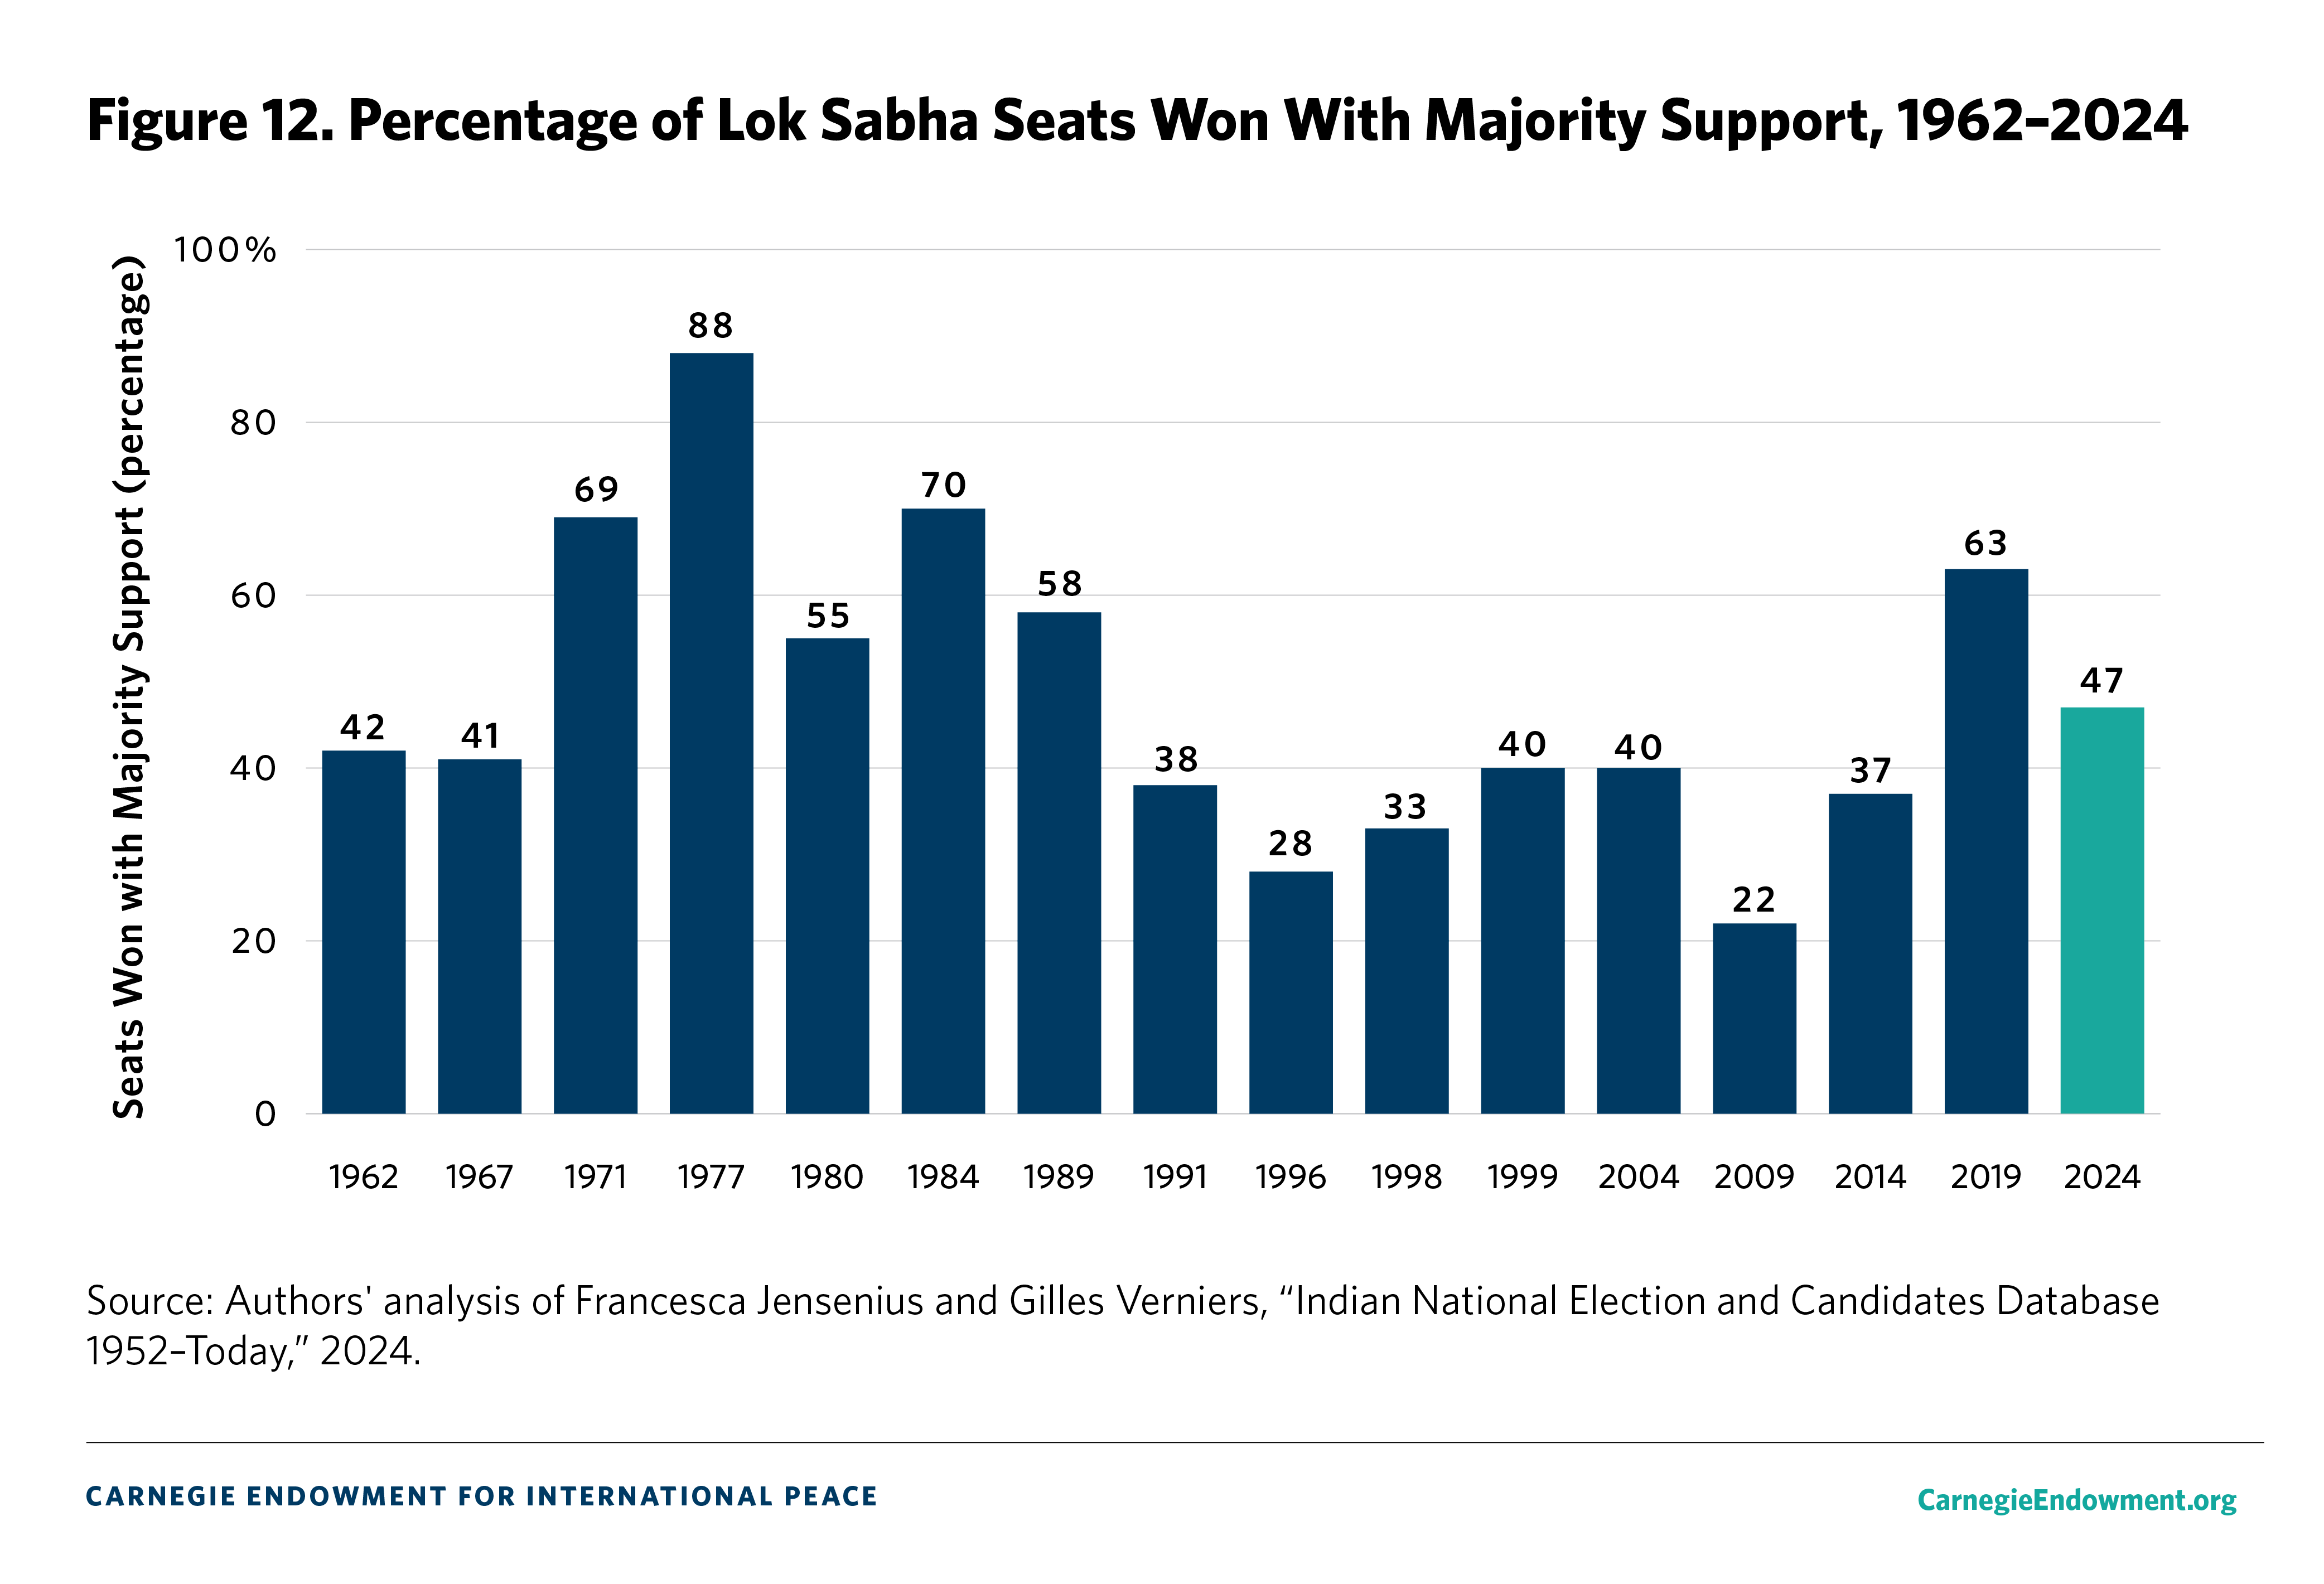
As one might expect, the share of Lok Sabha seats won with majority support exhibits a similar trend (see figure 12). Only 22 percent of MPs won their seats with more than 50 percent of the vote in 2009—a precipitous decline from 40 percent in 2004. This share rose to 37 percent in 2014 and a stunning 63 percent in 2019. In line with the data on average winning vote share, this figure fell to 47 percent in 2024—a decline but still the second-highest proportion since 1989.
During the third party system, as scholars Yogendra Yadav and Suhas Palshikar have noted, national elections often resembled an aggregation of state-level verdicts.27 In earlier eras, national elections often played out as waves against, or in favor of, the ruling party at the center. Because the Congress Party was the dominant player, general elections acted as an occasional referendum on the party and its policies. In contrast, the coalition era brought states front and center as the principal venues for political contestation, a development bolstered by the growing centrality of regional parties themselves. Because regional parties in India tend to operate in a single state (or a handful of states, at most), this placed the spotlight on state issues even when voters cast the ballots in national elections. To paraphrase Yadav, during periods of political hegemony, Indians voted in state elections as if they were electing the prime minister. In the coalition era, in contrast, Indians voted in general elections as if they were selecting a state government.28
The 2014 election was a watershed in this regard.29 A groundswell of support in favor of Modi—and, by extension, the BJP—was felt in diverse pockets of the country. The BJP successfully framed the contest as a choice between the dynastic Congress Party, which was beset by allegations of cronyism and policy paralysis, and the reformist, Modi-led BJP, which promised to usher in “acche din” (good days) for the Indian economy. The result was the first single-party parliamentary majority in thirty years. The 2019 election operated with a similar template in that the BJP, especially in the wake of terrorist attacks that occurred a few months before voting began, successfully whipped up a nationalist fervor in favor of a strong, muscular incumbent.30
The dynamics of the 2024 general elections surprised many observers because they reverted to the kind of state-by-state contest India experienced before 2014.31 The BJP, perhaps lulled into complacency by favorable preelection polls and a popular consensus that it would handily win a third mandate, campaigned without a narrative-defining issue. Rather, it went to the polls on the back of Modi’s unique popularity.
A preelection survey conducted by the Lokniti Programme of the Centre for the Study of Developing Societies (CSDS) found that 48 percent of respondents favored Modi as their next prime minister. In comparison, just 27 percent preferred Rahul Gandhi, the most visible leader of the Congress Party.32 The opposition, in turn, banded together to form a preelection alliance that was considerably stronger—in terms of its seat-sharing arrangements—and more broad-based than in 2019. The BJP’s inability to craft a defining election narrative, in conjunction with significant opposition consolidation, helped create the conditions for a more federalized contest. Unlike the prior two elections, there was no discernible national wave in support of one party or leader.
Despite this clear reversion to the pre-2014 era, a few elements of the fourth party system remain unchanged. First, during the coalition era, national elections were regularly (and predictably) influenced by state-level political calendars. The received wisdom held that if a national election were held early on in a state government’s tenure, the ruling party in that state would perform well in national elections. Conversely, if a national election were held late in a state government’s term, that state ruling party would struggle in the national polls. These “honeymoon” and “anti-incumbency” effects were statistically robust.33 However, this correlation appeared to break down after 2014.
For instance, in late 2023 and just months before the 2024 elections, three Hindi heartland states—Chhattisgarh, Madhya Pradesh, and Rajasthan—simultaneously held state assembly elections. The Congress Party entered those elections with sitting governments in Chhattisgarh and Rajasthan, while the BJP was the incumbent in Madhya Pradesh. The November 2023 results saw the BJP come to power in all three states.
In the assembly polls, the BJP won 46 percent of the vote and 60 percent of seats in Chhattisgarh, 49 percent of the vote and 71 percent of the seats in Madhya Pradesh, and 42 percent of the vote and 58 percent of the seats in Rajasthan.34 In the Lok Sabha elections the following year, the BJP executed a clean sweep of Madhya Pradesh’s 29 parliamentary seats, but its performance in the other two states diverged. In Chhattisgarh, the BJP earned 53 percent of the vote and won 10 of 11 seats on offer. In Rajasthan, on the other hand, the party won 49 percent of the vote but just 14 of 25 parliamentary seats.
Another aspect of the weakening federal character of elections is the changing balance of power between national and regional parties. One way of gauging this is to examine the distribution of votes won by the two truly national parties (the BJP and the Congress Party) as compared to all other parties (see figure 13).
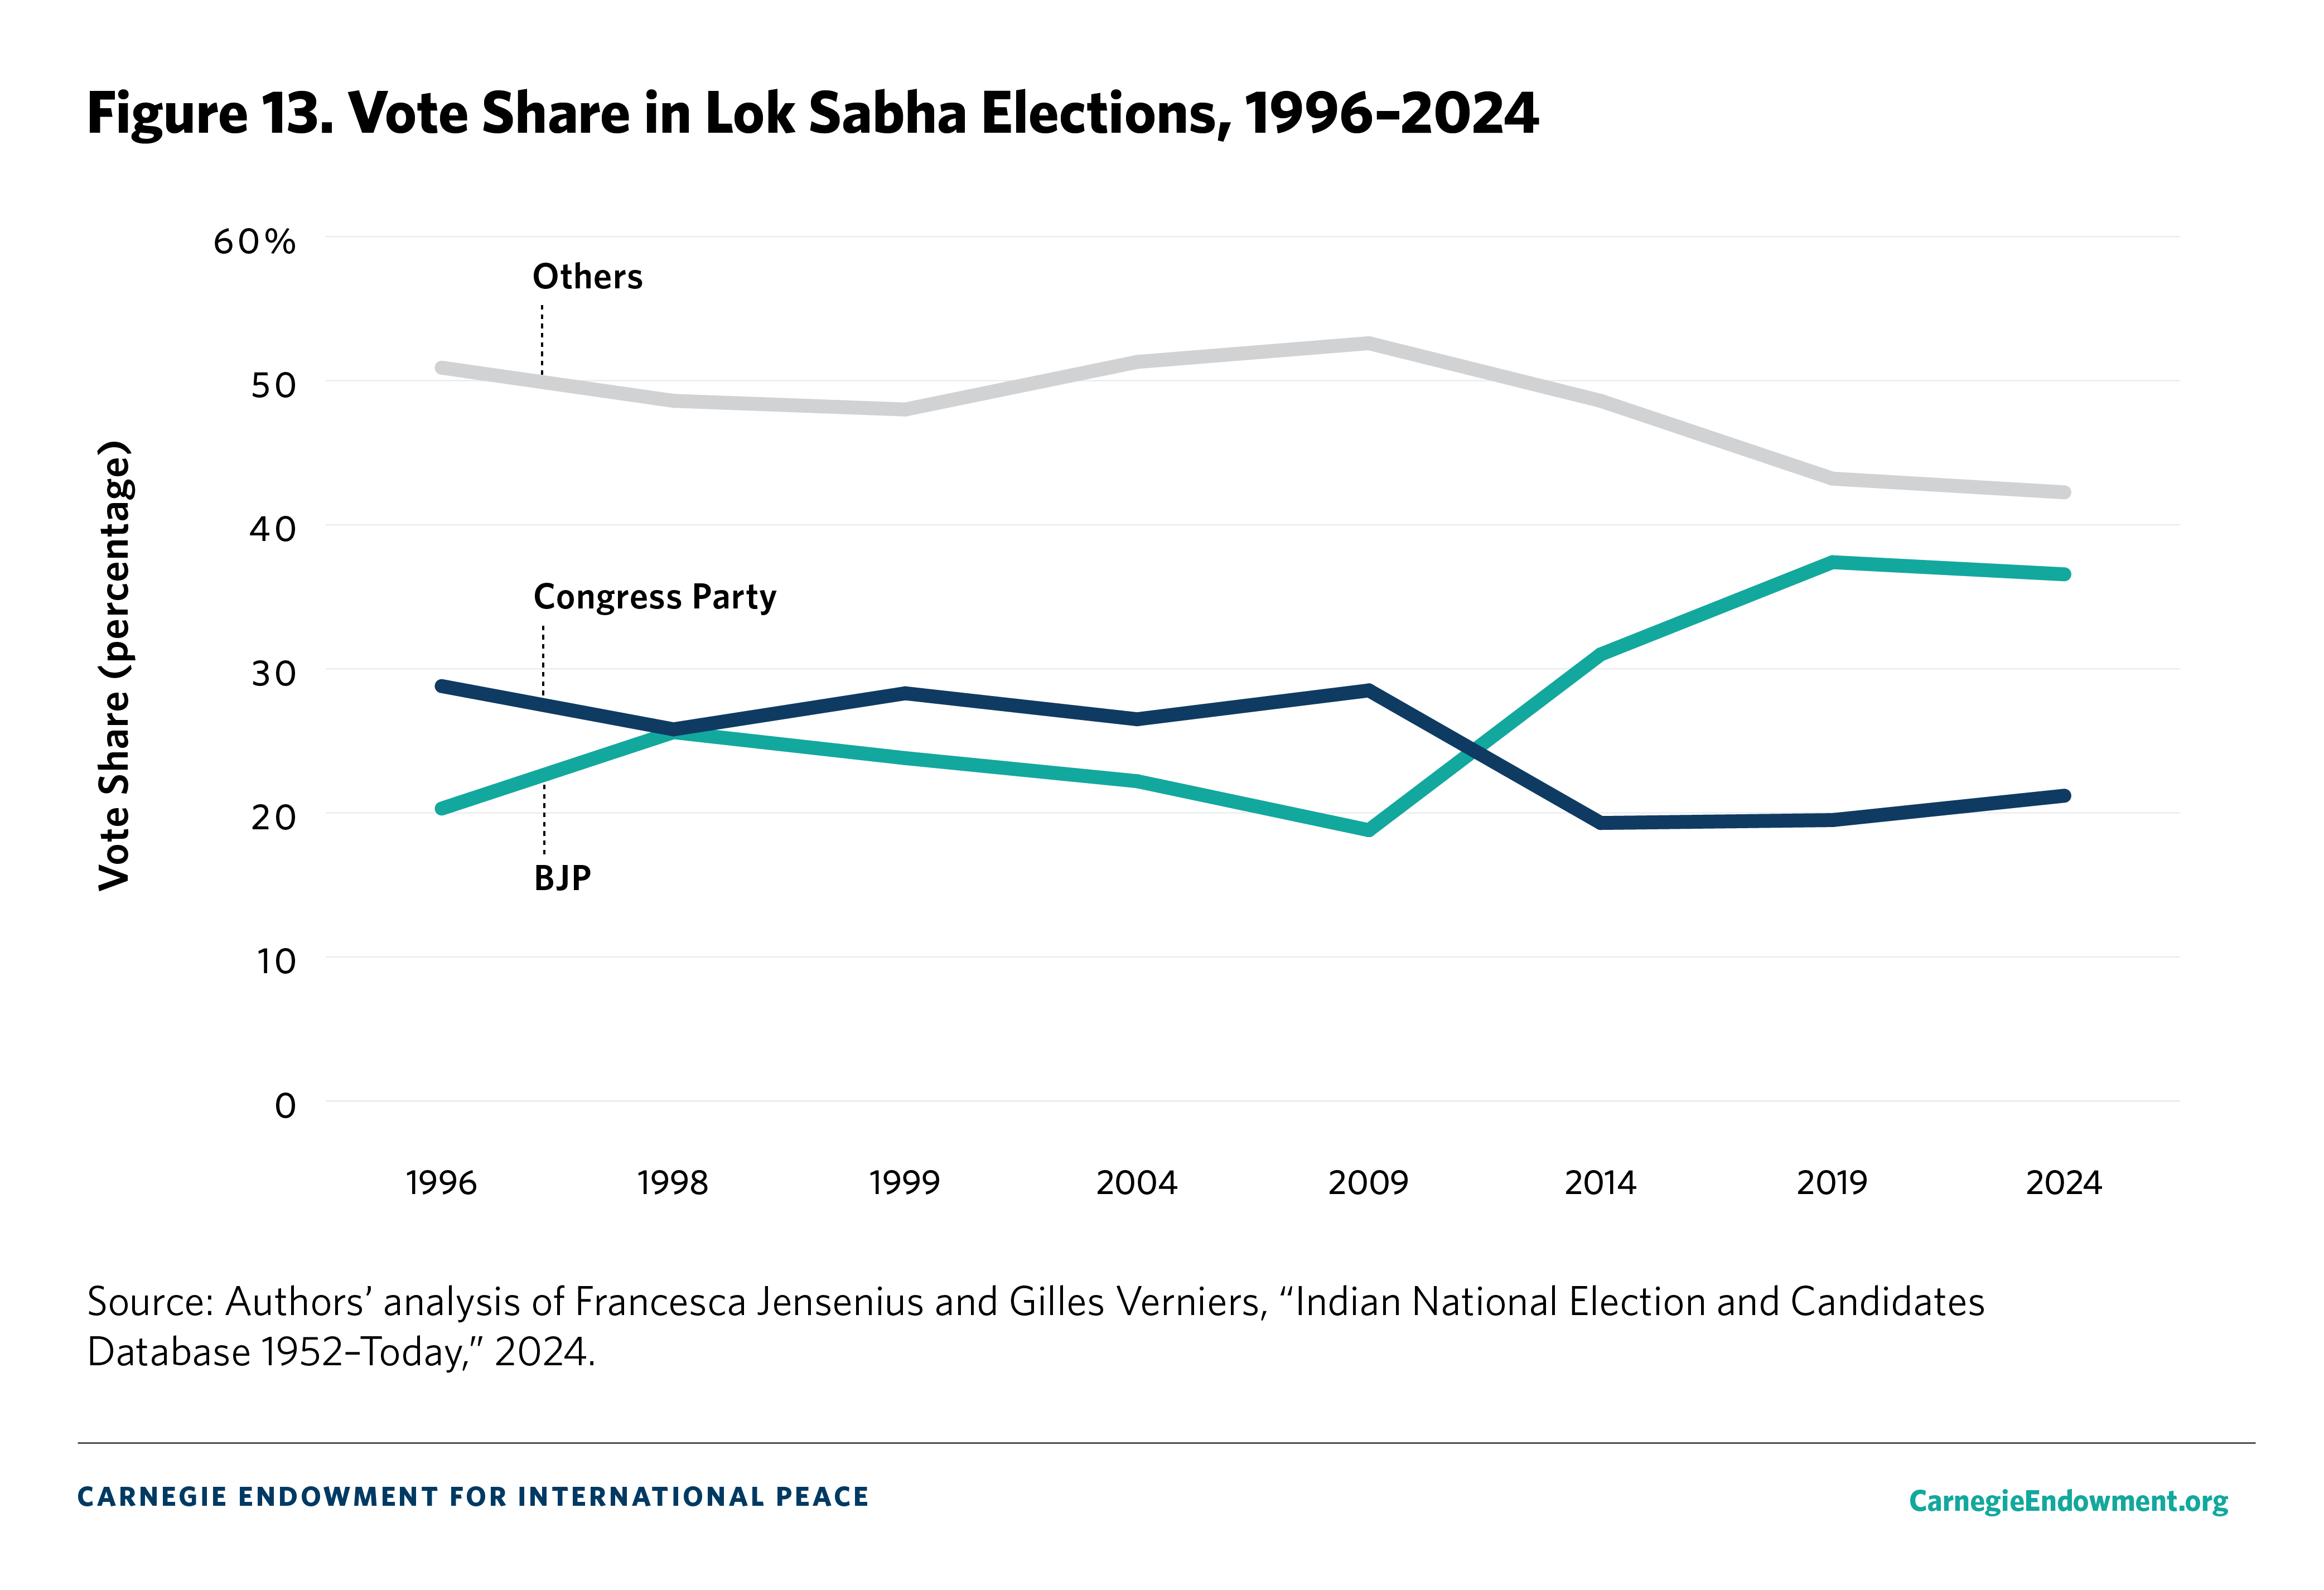
Between 1996 and 2014, there was roughly an equal distribution of votes shared by national and regional parties. Barring minor fluctuations, the BJP and Congress Party collectively earned around 50 percent of the vote, meaning that one in two votes in a general election accrued to a regional party. In 2019, and again in 2024, that roughly equal distribution was disrupted when the BJP won markedly larger vote shares. In 2019, the BJP and Congress Party collectively won 56.8 percent of the vote compared to 43.2 percent for all others. In 2024, this vote share divergence grew by an additional percentage point.
These data points merit an important caveat. In 2024, preelection coalitions were vitally important. After all, although the BJP emerged as the single largest party in Parliament, it fell short of an outright majority. Prior to the elections, the BJP expended significant political capital on resuscitating the NDA, including by recruiting two erstwhile allies who previously exited the coalition—the Telugu Desam Party (TDP) led by Chandrababu Naidu and the Nitish Kumar–led Janata Dal (United), or JD(U). Together, the TDP and JD(U) won 28 seats in the 2024 elections. When combined with the BJP’s 240 seats, the alliance needed just 4 additional seats to secure a parliamentary majority.
As for the opposition, the Congress Party contested the fewest seats in a general election in its history, a calculated decision taken in deference to a slew of coalition partners.35 In a state like Uttar Pradesh, where the Congress Party has long witnessed a decline in its popular appeal, the party’s seat-sharing arrangement with the Samajwadi Party (SP) undoubtedly lifted its own numbers. In 2019, the Congress Party contested the state on its own, winning 6.4 percent of the vote and capturing just 1 of the state’s 80 parliamentary seats. In 2024, fighting alongside the SP, the Congress Party notched 9.5 percent of the vote and won six seats.36 Although observers cannot fully separate the national parties’ popular appeal from that of regional parties (and vice versa), it is clear that the roughly equitable breakdown in vote share between national and regional parties has tilted in favor of the former.
Of course, not all regional parties are the same. This broad-brush category includes two distinct types of parties. The first category consists of parties whose base of support is geographically restricted to one or a handful of states (or sometimes even just one part of a single state). Most of these parties cater to specific caste or ethnic communities. The second category comprises “regionalist” parties, whose area of operation is also geographically limited but whose political mobilization rests on emotive appeals to their state’s regional pride, culture, language, or customs.37
In 2014, the BJP did exceptionally well in direct contests with the Congress Party or regional parties (see figure 14). It won 88 percent of direct, head-to-head contests with the Congress Party and 91 percent of such battles with regional parties. It fared much less well against regionalist parties, against whom it won only 28 percent of direct contests. Regionalist parties tend to populate India’s eastern seaboard, starting from West Bengal in the north, continuing through Odisha, and further south to Andhra Pradesh, Telangana, and Tamil Nadu. This corridor has traditionally been one of the weakest regions for the BJP, which has long struggled to shed its image of a north Indian, Hindi-speaking party.
In 2019, the BJP won a striking 92 percent of elections against the Congress Party and 83 percent of all races against regional parties, but it also vastly improved its performance against regionalist parties—winning half of all such races. Much of this improvement was due to the BJP’s favorable performance in the eastern states of West Bengal and Odisha, where it emerged as a major player.
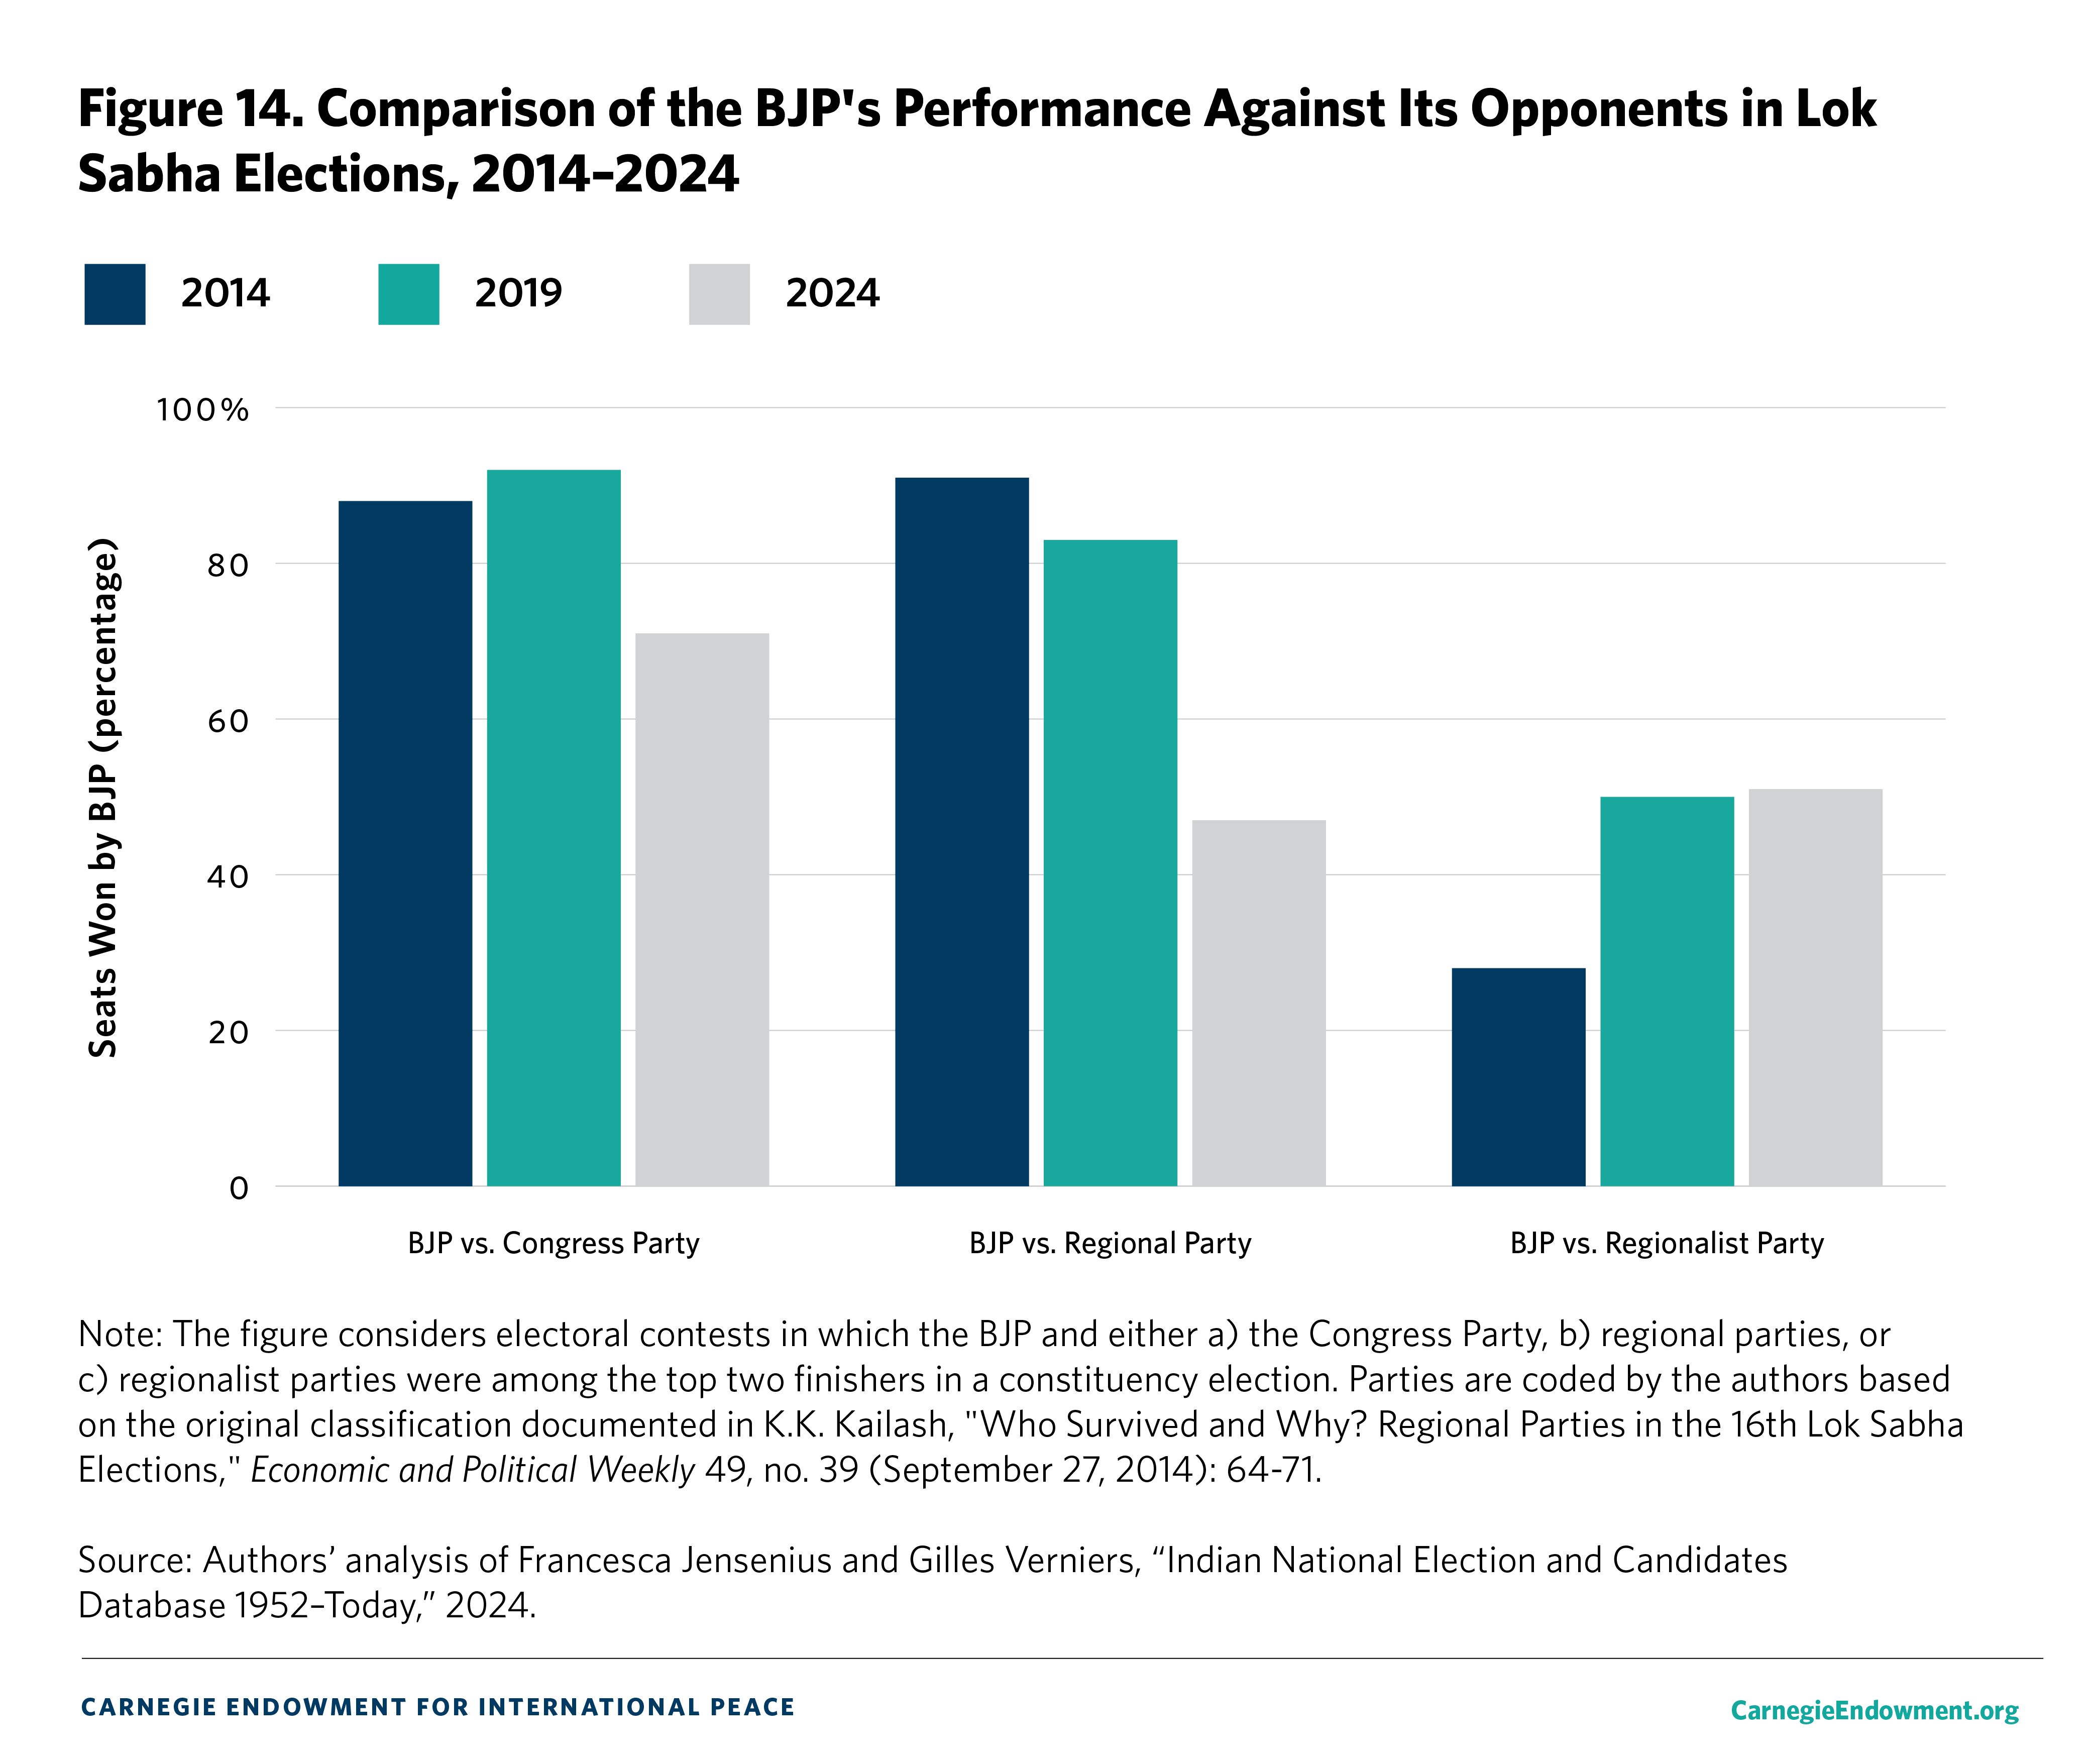
The trends in 2024 deviated from the established pattern of the last decade. The BJP continued to match up relatively well with the Congress Party, though, with a 71 percent strike rate, it performed much less well than in 2014 or 2019. The BJP’s performance against regional parties vastly underperformed its prior showings, with the ruling party winning in fewer than half (47 percent) of all direct contests. But the BJP held its own vis-à-vis regionalist parties, clinching 51 percent of all head-to-head fights. Taken together, these facts are in line with the overall shift in geographic support for the BJP in the recent general election.
Overall, the 2024 verdict departed from the previous decade in that it resembled an aggregation of state-level verdicts rather than a national-level wave. However, the interaction between state and national elections remains less predictable than during the coalition era, perhaps suggesting that voters are better able to distinguish between the stakes at various levels of government. Furthermore, national parties have continued a trend of growing their share of the national vote, consistent with 2014 and 2019. In 2024, however, the BJP’s relative performance against both the Congress Party and regional parties worsened while it evenly split contests with regionalist parties against whom it has traditionally struggled.
Another defining characteristic of the third party system pertains to patterns in voter turnout. Between 1989 and 2014, voter turnout surged at the state level but remained relatively subdued in general elections. This is arguably a natural corollary to the rise of states as the principal venues for political contestation in the eyes of the voters and the characterization of national elections as an amalgamation of state-specific verdicts.
Voter turnout in the first party system averaged 60.1 percent (1952–1962), dipping slightly to 59.6 percent in the second party system (1967–1984). That level remained roughly unchanged in the third party system. In the fourth party system, however, state turnout remains elevated, and national turnout has also risen considerably (see figure 15). In 2014, India saw record-breaking turnout in a general election, at 66.4 percent. This was a significant increase from the 2004 and 2009 elections, when turnout hovered in the vicinity of 58 percent.
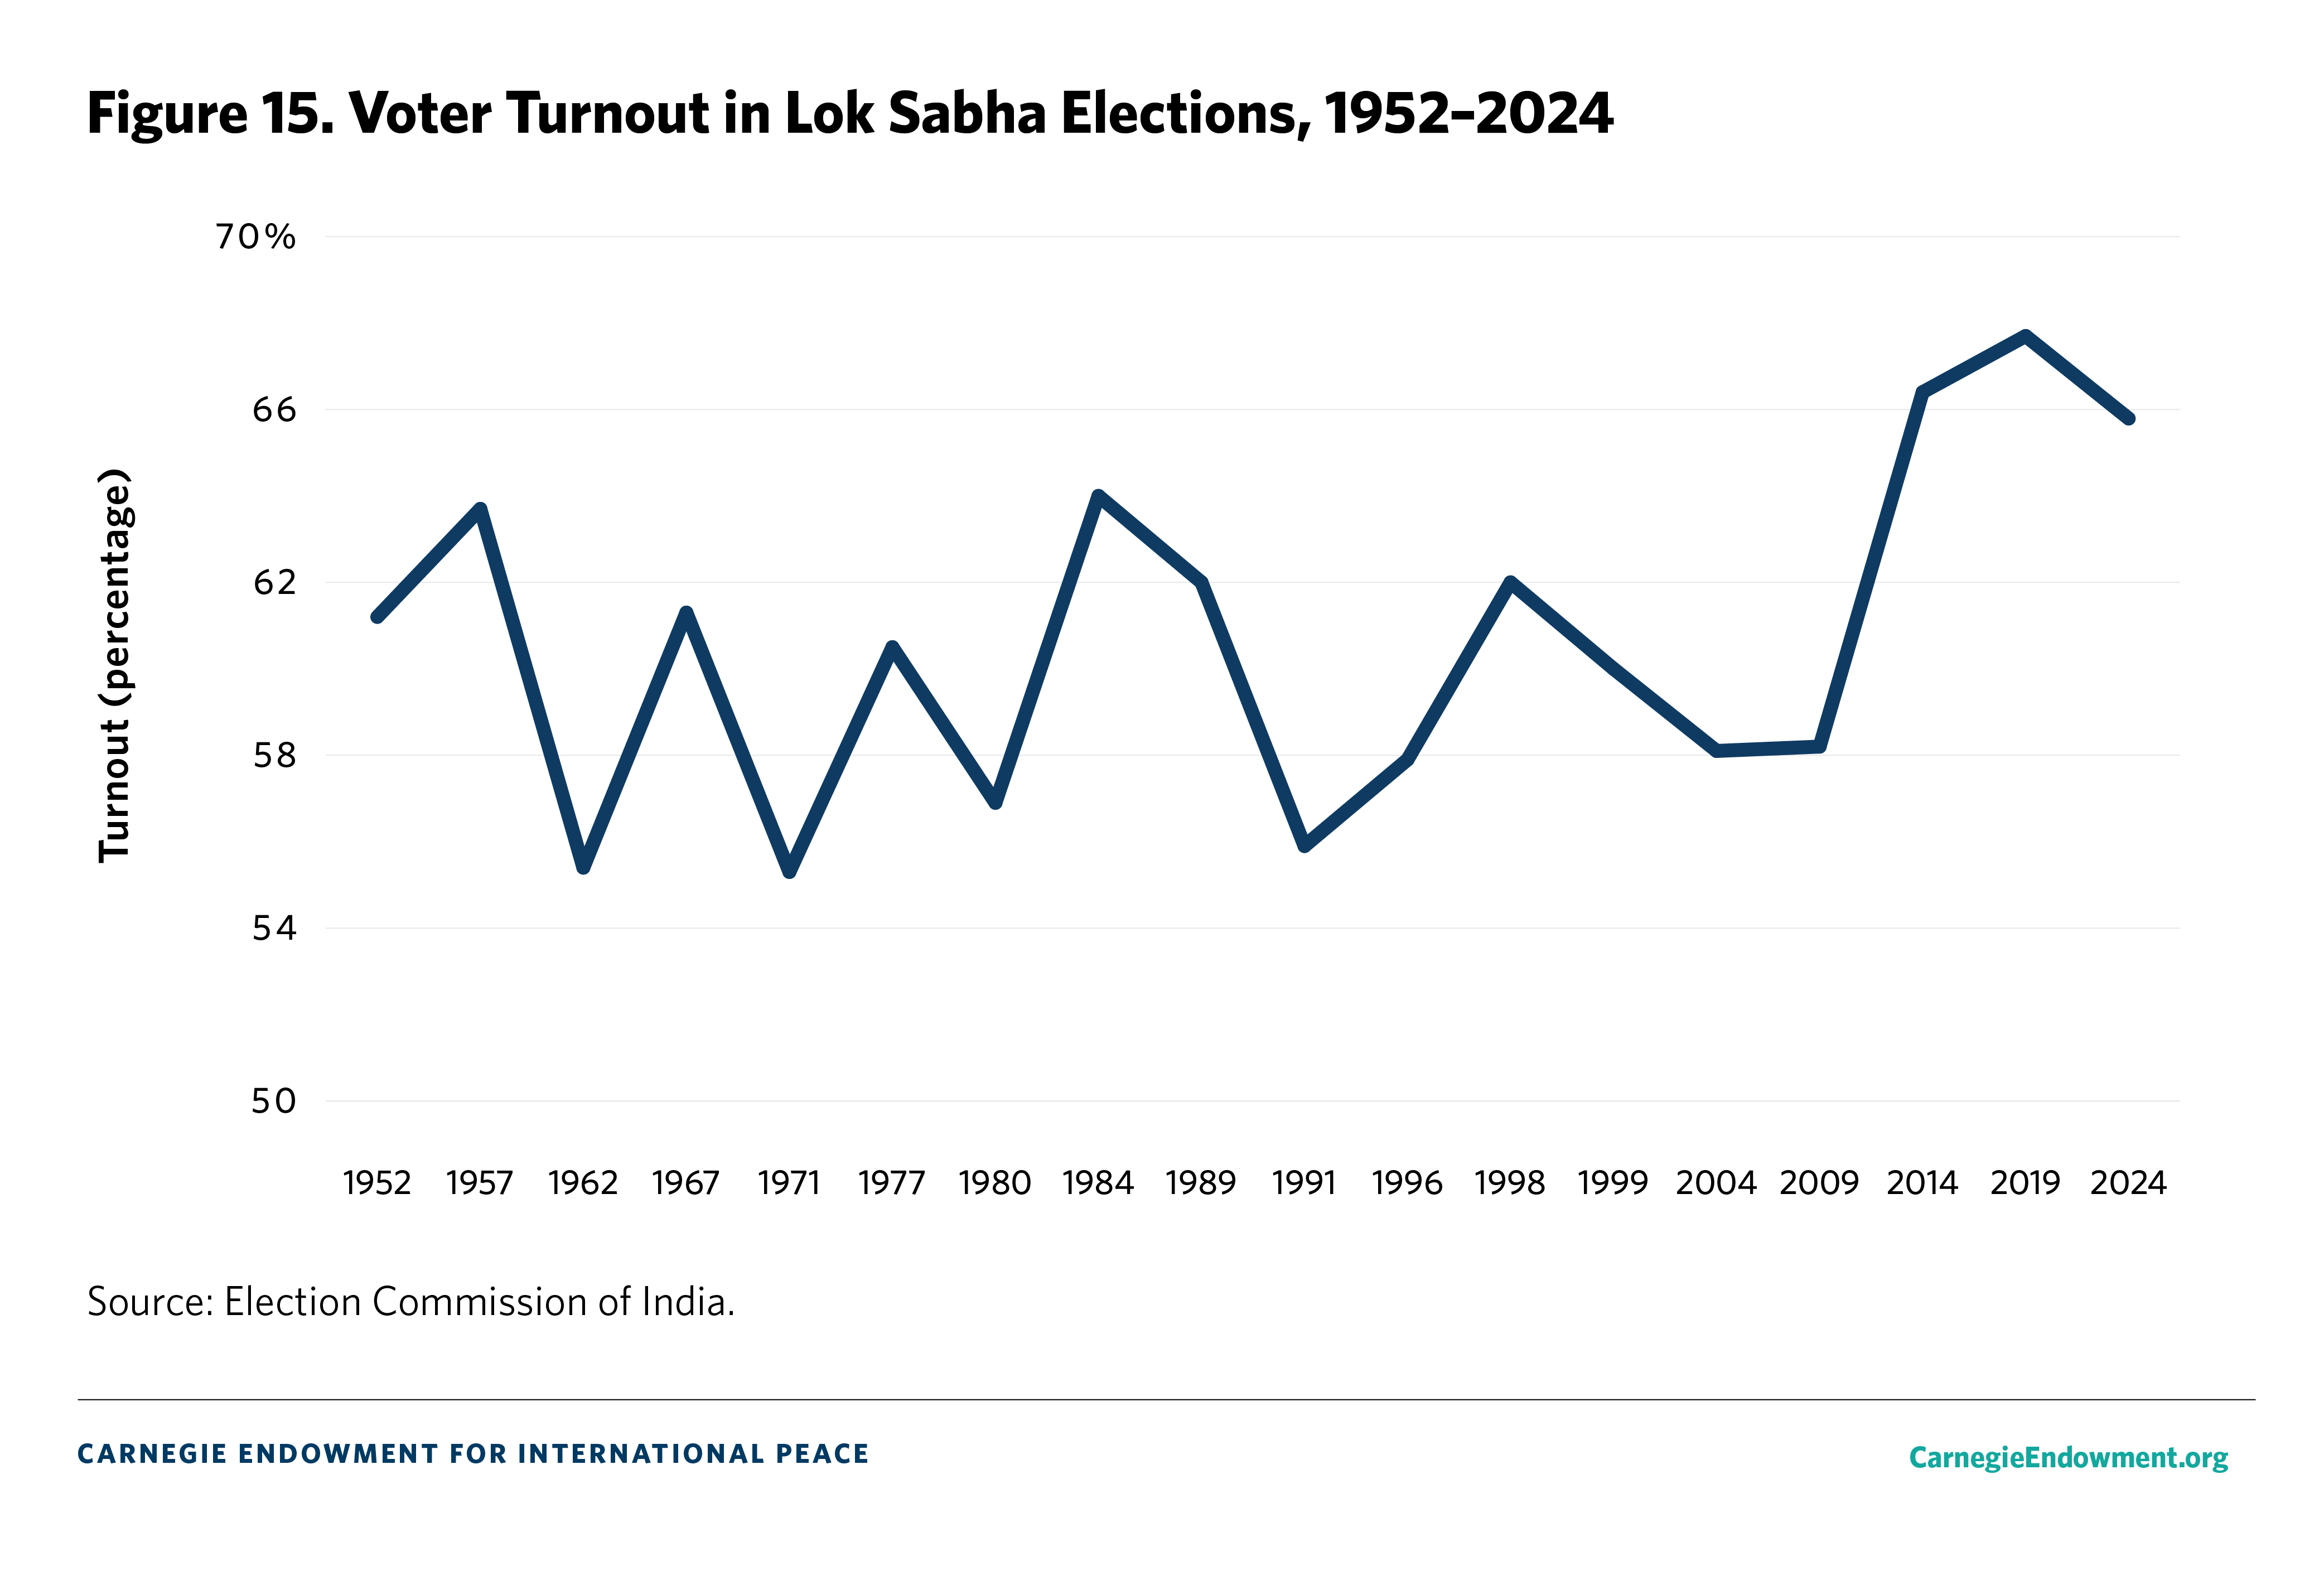
In 2019, turnout rose even higher, clocking in at 67.7 percent. The excitement around Modi and the popular disquiet at the end of the second term of the UPA government together help contextualize the 2014 turnout figures. Similarly, the nationalist rallying that took place after the Pulwama terrorist attacks on the eve of the 2019 general elections help explain that year’s record turnout.38
Much of the commentary ahead of the 2024 elections featured a narrative of sagging voter turnout.39 While turnout did indeed drop in the aggregate, the decline was modest: overall turnout stood at 65.8 percent in 2024, a little over half a percentage point smaller than the corresponding 2014 figure. Given two successive elections with record-breaking turnout and an election that lacked a defining issue, some mean reversion should not come as a surprise. By historical standards, general election turnout in India remains elevated. Averaging across the 2014, 2019, and 2024 elections, turnout was 66.6 percent—seven and a half percentage points higher than during the third party system (1989–2009).
A second dynamic that came into view during the end of the third party system and the advent of the fourth party system does not pertain to overall turnout levels but to the composition of who comes out to vote.40 In the first several decades after independence, female turnout consistently lagged male turnout by 8 to 12 percentage points (see figure 16). In 2004, the male-female turnout gap stood at 8.4 percent. Five years later, that gap nearly halved to 4.4 percent. In 2014, the gap shrunk further to 1.8 percent, and by 2019, it virtually disappeared (to a miniscule 0.1 percent). In 2024, the gender gap in turnout was virtually wiped out, at just 0.02 percent.
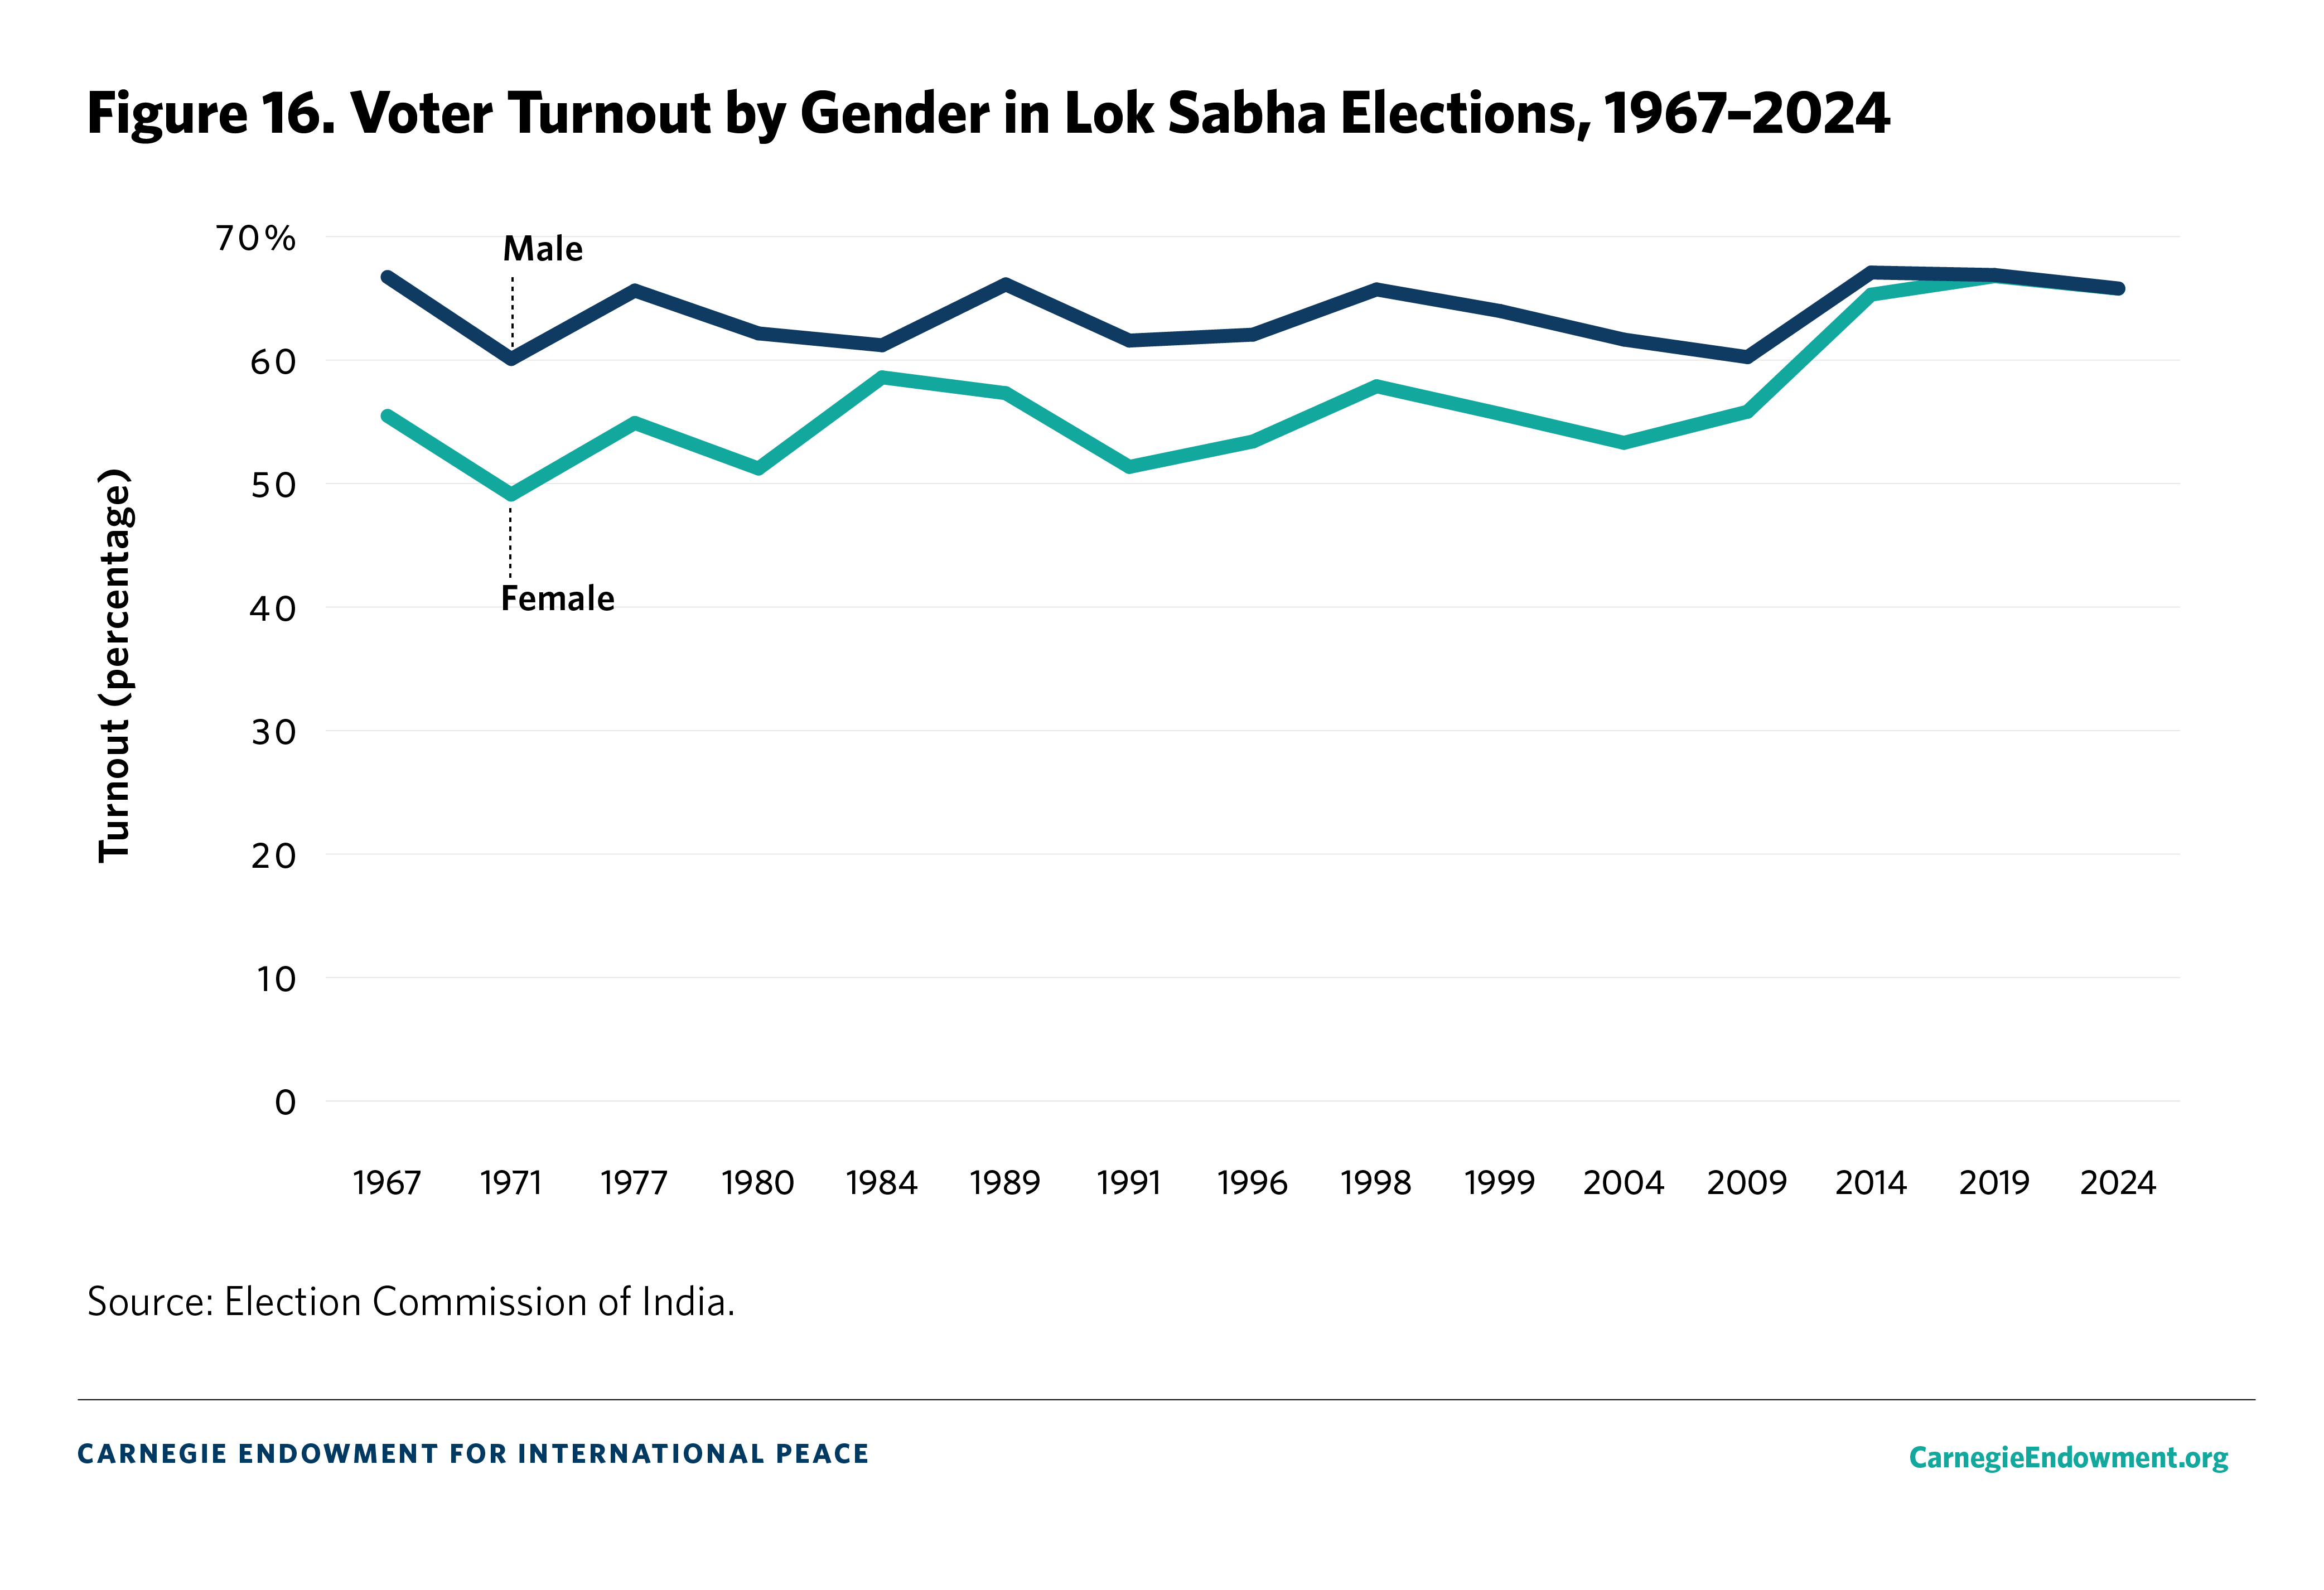
The trend of a diminishing gender gap in voter turnout is also evident in the data from state elections.41 In state elections held between 1961 and 1965, the male voter turnout advantage was 9.1 percentage points. This gap has dramatically narrowed over time, especially in the second half of the 2000s. From 2001–2005, the gender turnout gap was 4 percentage points. Astonishingly, in the next five-year period, the gap shrunk to a mere 0.3 percent. Since 2010, average female turnout has consistently outpaced male turnout in state assembly elections.
As India’s party system has evolved, the way in which caste has been expressed and deployed for political mobilization has shifted. In the heyday of the third party system, political mobilization took place around the core umbrella caste/community groupings: Upper Castes, Other Backward Classes (OBC), Scheduled Castes (SC) or Dalits, and Scheduled Tribes (ST) or Adivasis.42 Each of these larger groupings consists of countless jatis (discrete caste groups). This framing of caste around larger, big-tent categories was driven by multiple factors: the debate over the Mandal Commission and the recommendation of affirmative action for OBCs; new Scheduled Caste assertion, especially in the form of expressly pro-Dalit political parties like the Bahujan Samaj Party (BSP); and increased political outreach to tribal citizens, both through established parties like the BJP as well as through political movements championing the creation of new, Adivasi-dominated states.
In the fourth party system, these larger umbrella groupings consisting of multiple jatis became less salient. In a way, politics returned to the construction of jati-level alliances, which was the prevailing norm in the second party system. During this prior era, political parties focused on creating state-wide alliances of individual jatis in order to construct a winning coalition. In the post-2014 era, the focus on creating jati-level coalitions played out slightly differently.
One of the BJP’s major successes in the Modi era has been its ability to skillfully exploit a wedge that has opened between so-called dominant jatis and subordinate groupings.43 Within the larger OBC and SC categories, in particular, there is significant internal heterogeneity with populous, economically powerful jatis capturing many of the gains from increased representation, affirmative action, and various government schemes. The BJP’s innovation was to create additional separation between dominant and nondominant jatis by harping on these inequalities, building a base of the most socioeconomically disadvantaged groups within the OBC and Dalit categories.
In the most electorally pivotal Hindi heartland states like Bihar and Uttar Pradesh, Yadavs and Jatavs are widely considered the most powerful OBC and SC jatis, respectively. They also make up the core voter base of powerful regional parties opposed to the BJP. The BJP’s play was to build a coalition of nondominant OBC and SC jatis that could act as a counterforce.44
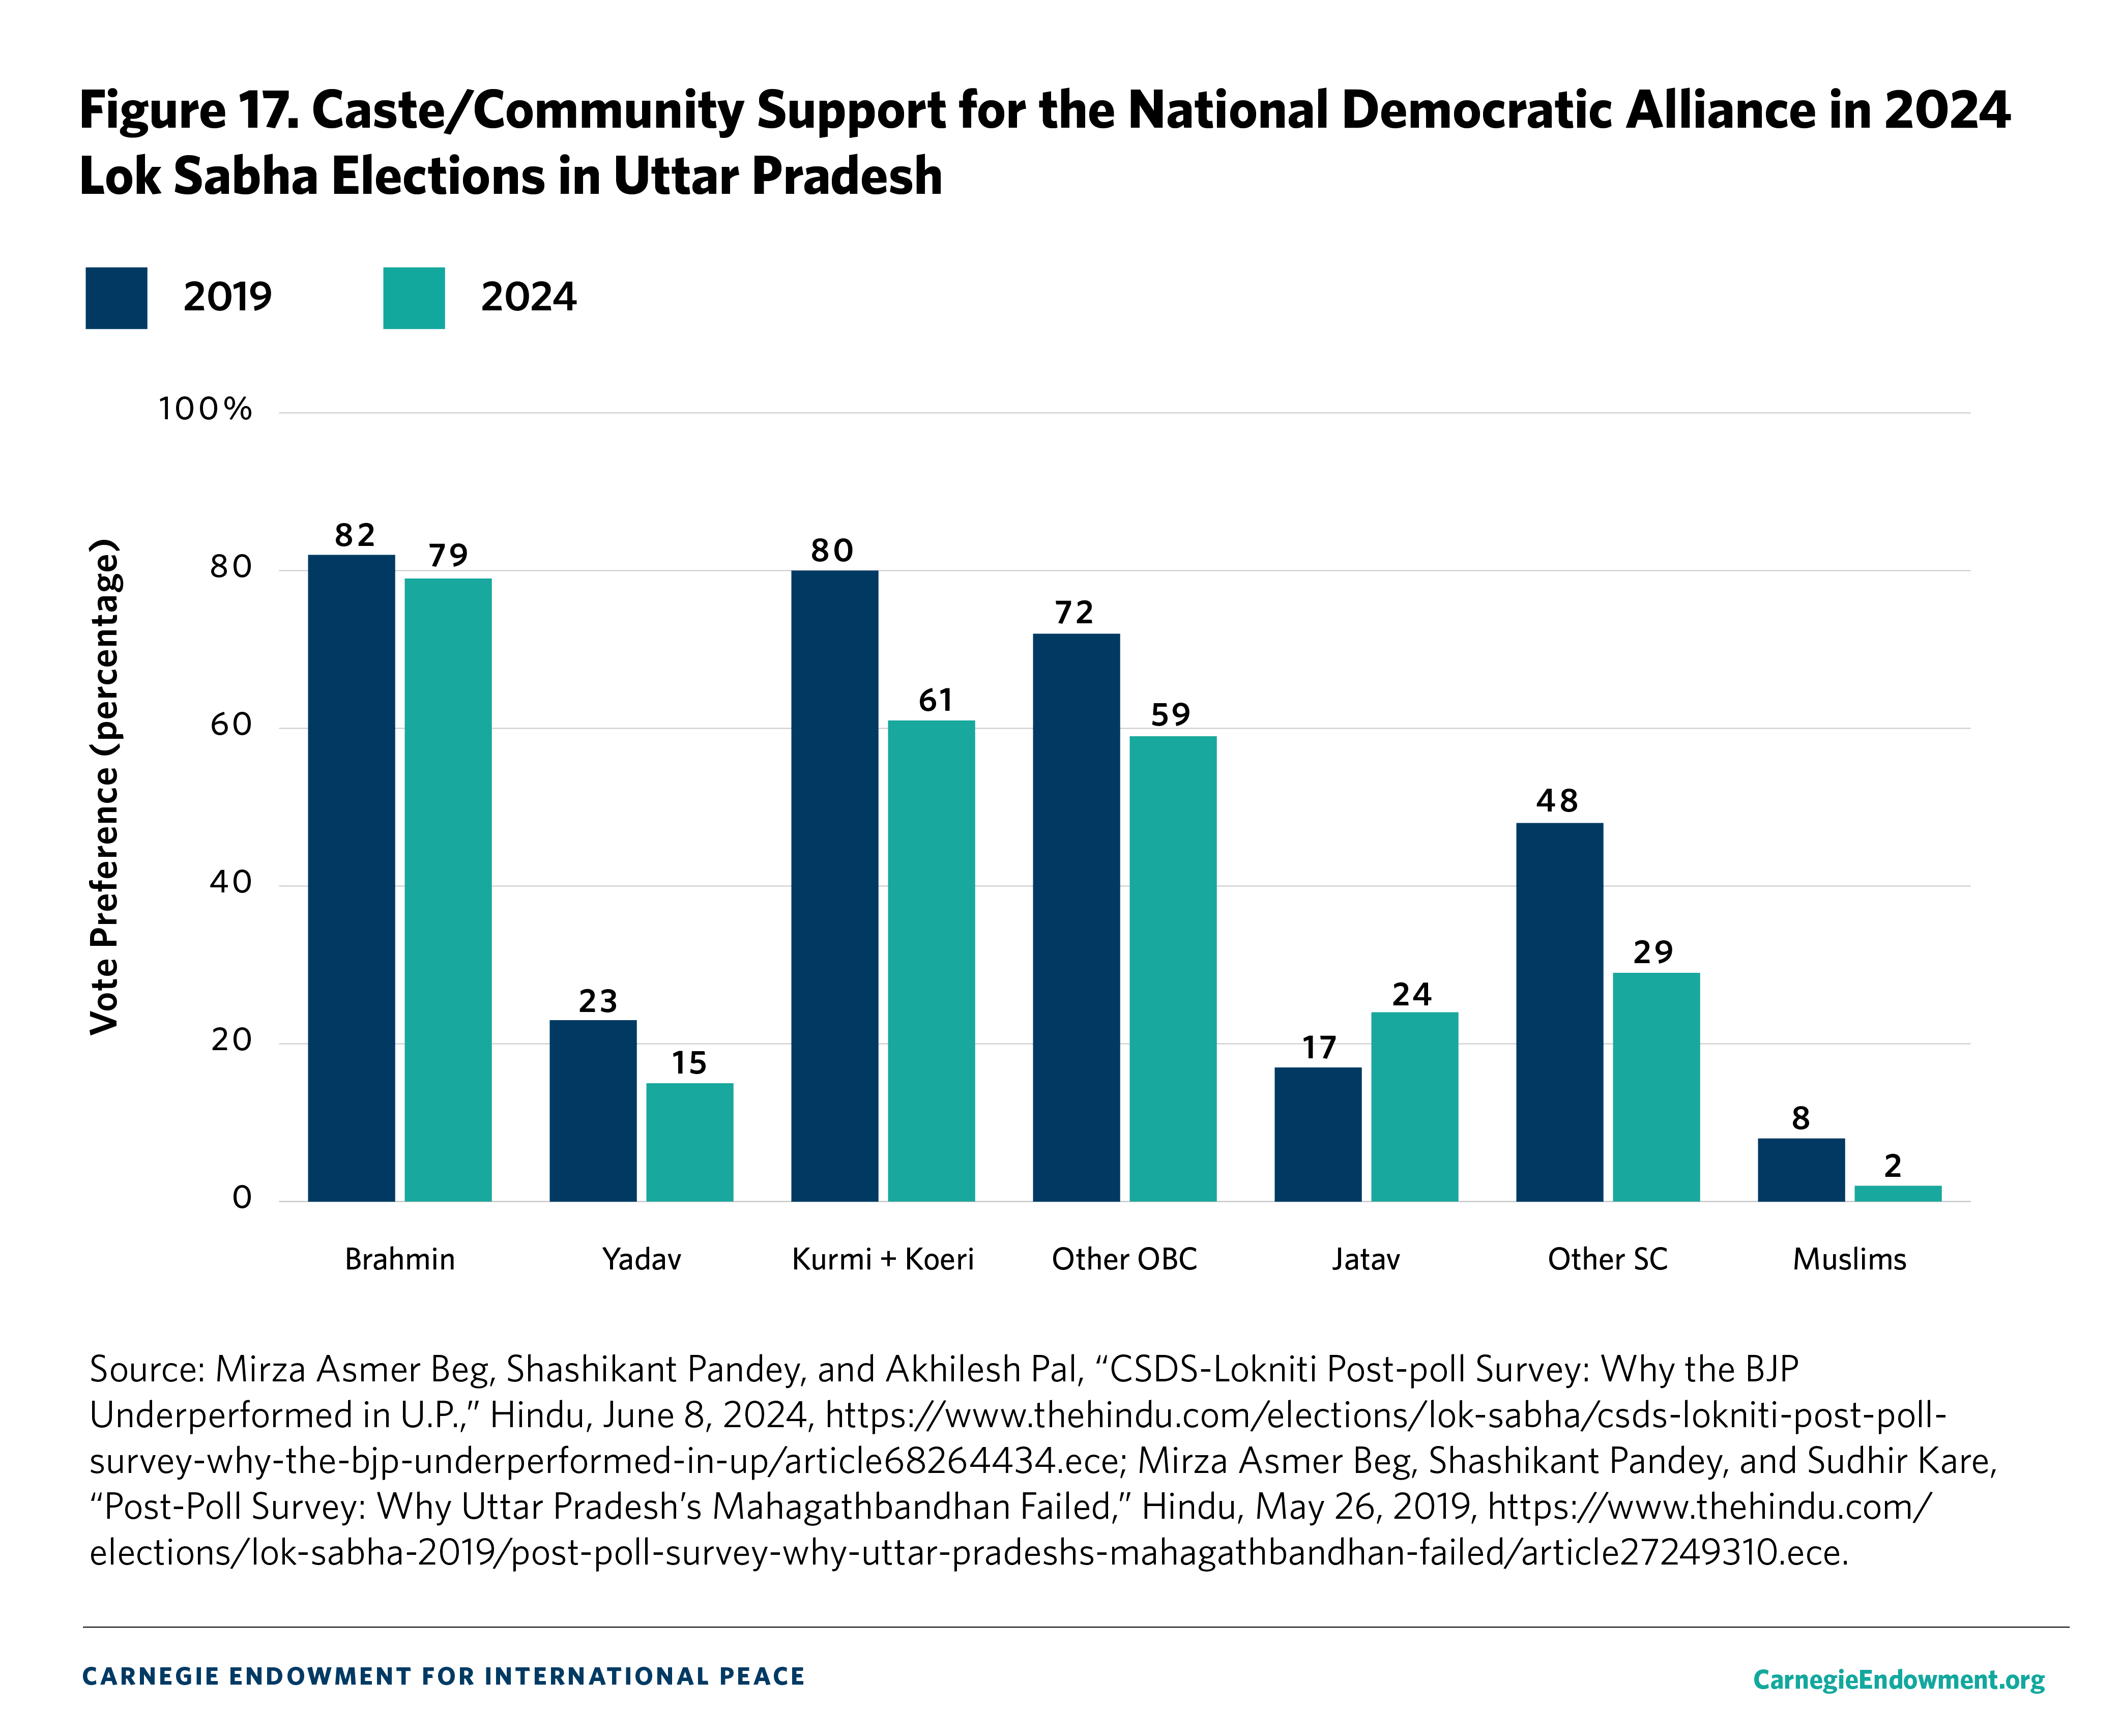
In 2024, this remained the BJP’s strategy in northern India, but it proved far less effective. Consider the caste- and community-level data on voting patterns in Uttar Pradesh that emerged from the National Election Study carried out by Lokniti-CSDS (see figure 17).45 The BJP lost ground among non-Yadav OBCs and non-Jatav Dalits (with large numbers of these voters moving to the opposition INDIA alliance). Interestingly, the BJP made up some ground with Jatavs, though this is likely explained by the electoral collapse of the BSP, whose base has long consisted of Jatav voters. Indeed, even in 2024—a historically abysmal election year for the BSP—44 percent of Jatav voters in Uttar Pradesh continued to back the party.46
A final trend worth mentioning is the further consolidation of Muslim voters behind the INDIA alliance. As one analysis of historical Lokniti-CSDS data has shown, the extent of Muslim support for the principal anti-BJP political coalition has waxed and waned over the years.47 For instance, in 2004, 51 percent of Muslims voted for the Congress Party–led UPA while just 11 percent backed the BJP-led NDA. In 2014 and 2019, 45 percent of Muslims backed the UPA while 9 percent supported the NDA. In 2024, however, nearly two-thirds of Muslim voters (65 percent) lent their support to the INDIA alliance, against 10 percent for the NDA.
Data from individual states further bear this out. For instance, the Muslim vote in Uttar Pradesh in the 2019 elections was split between the BSP-SP alliance and the Congress Party, which contested the elections on its own. In 2024, the coming together of the SP and the Congress Party led to near-universal Muslim support (92 percent) in that electorally pivotal state.48 Across states, however, Muslim voters did not uniformly coalesce behind a single party; rather, Muslims tended to back whichever party was perceived to be the strongest challenger to the BJP.
Finally, the fourth party system coincided with a shift on a second dimension of social identity—the social composition of India’s elected representatives.49 In 1989, the year the coalition era began, 47 percent of MPs from the Hindi belt belonged to the upper or intermediate castes, compared to 20 percent from the OBC category. Over the next several elections, the former dipped to 42 percent in 1999 while the latter grew to 25 percent. This was the first year in which the combined share of OBC and SC legislators exceeded that of upper caste and intermediate castes, and the gap widened further in 2004 (see figure 18). By 2014, the upper/intermediate castes regained the upper hand, once more approaching fifty percent of the total. These dominant communities maintained their representational advantage over lower castes through 2019, albeit with shrinking margins.
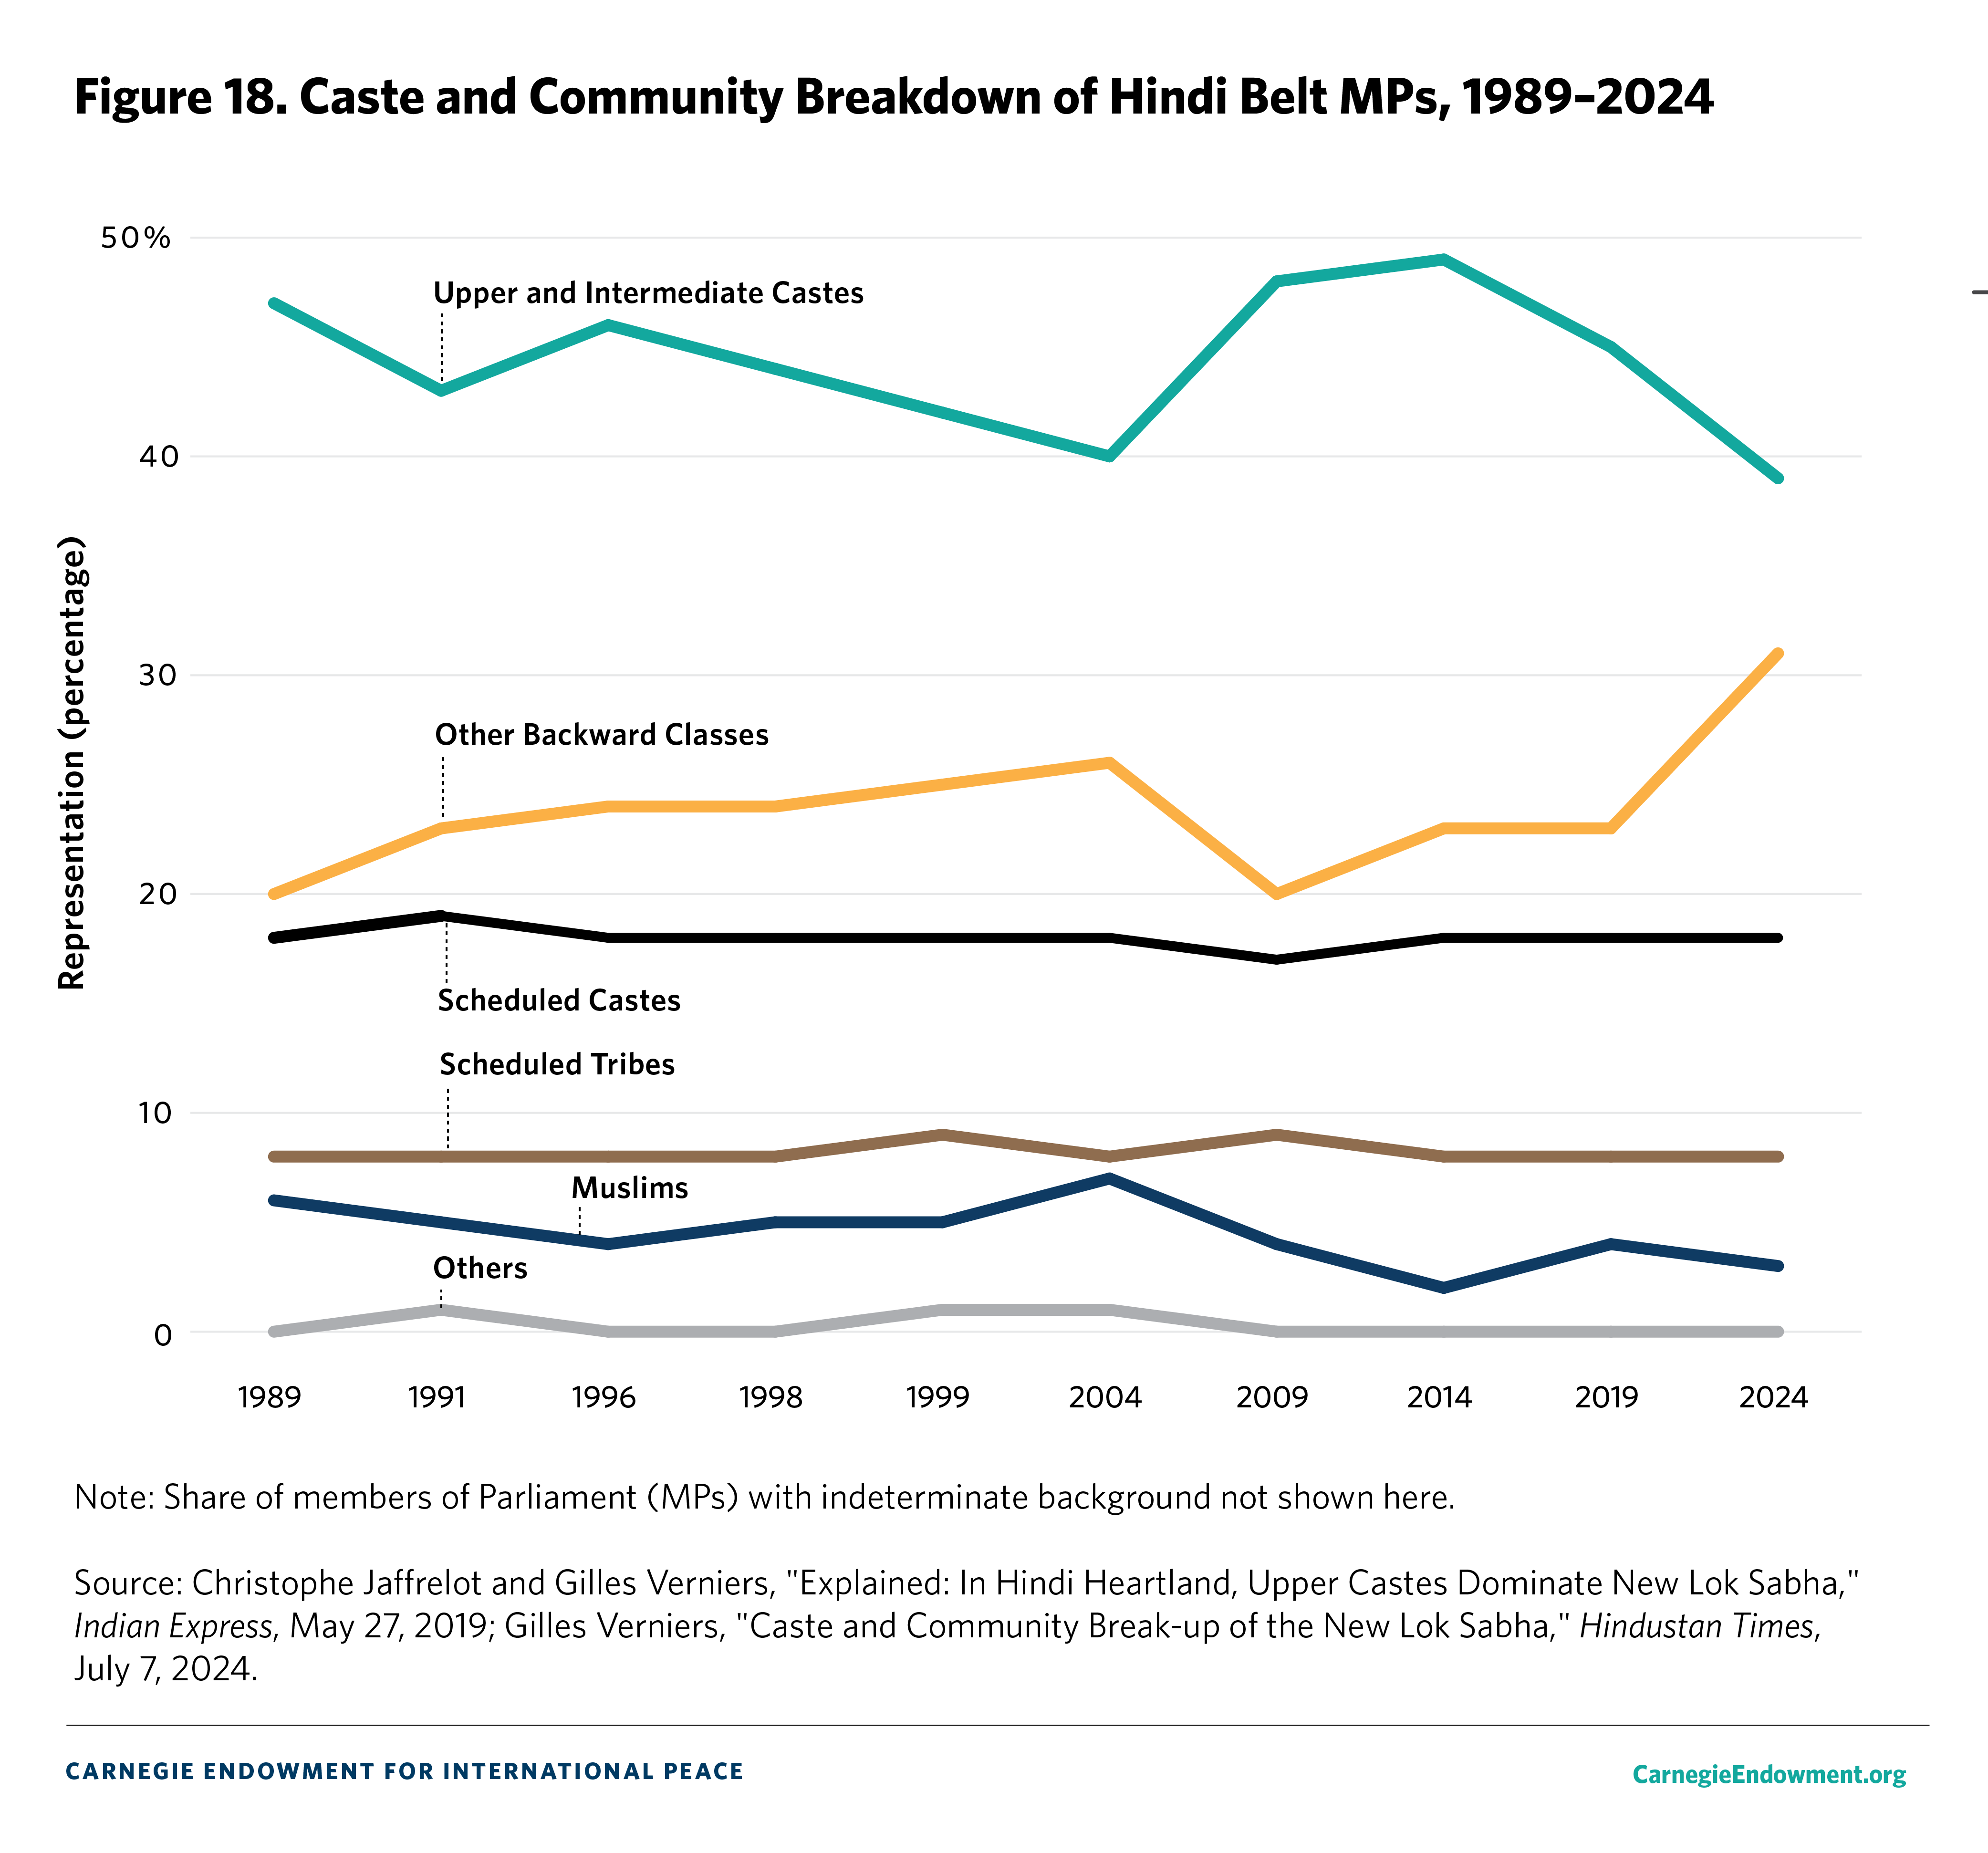
The year 2024 witnessed an unprecedented surge in OBC representation, with nearly one in three (31 percent) Hindi belt MPs hailing from this heterogeneous group—a record.50 In contrast, at 39 percent, the share of upper/intermediate caste MPs from this region was at its lowest level in history. Since 1989, the SC and ST share of Hindi belt MPs has remained constant; SC and ST candidates rarely win outside of legislative constituencies constitutionally reserved for their communities. OBCs, on the other hand, have gained considerable ground. In 2024, Muslim representation stands at 3 percent, half the share seen in 1989 (and well below the group’s share of the population).
It is always difficult to determine the point at which one party system has given way to another. In 2014, for instance, few observers were willing to argue that India had ushered in a new era of political competition, based on the results of a single general election—an argument that became much easier to make five years later in 2019. Similarly, the 2024 general election result could be a harbinger of a return to an era of coalition politics. As the preceding pages demonstrate, however, it would be premature to pass such a judgment based on the latest general election alone.
While coalition governance has returned to New Delhi, the BJP retains a position of national strength. It not only has the largest clutch of Lok Sabha seats but also controls a near majority of the Rajya Sabha (with its allies), has gained ground in southern and eastern Indian states, and remains the central gravitational force of Indian politics. While political competition has intensified and fragmentation—at least according to some measures—has grown, the current format of political contestation does not (yet) resemble the pattern of contestation that prevailed during the third party system. Notably, however, the 2024 general elections did resemble an aggregation of state verdicts rather than a national referendum, which represents a clear break with the two previous elections. At the same time, the national political arena cannot simply be reduced to the sum of state contests; Indian voters have demonstrated an ability to distinguish between state and national polls.
Looking ahead, the future trajectory of India’s party system will depend on multiple factors. Above all, three questions loom large.51
First, to what extent has Modi’s popularity peaked? According to political scientist Devesh Kapur, “increasing centralization, declining intraparty democracy, and the cutting-to-size of regional leaders who were not subserviently loyal” to Modi all contributed to a hollowing out of the BJP’s traditional strength—its robust, cadre-based party apparatus.52 According to this view, Modi’s power may have peaked in 2019 and now—as result of shifting political dynamics and the BJP’s own goals—is in decline.
Modi’s personal standing is important because public opinion surveys have shown that the prime minister consistently outperforms his party’s brand. According to Lokniti-CSDS, 36 percent of Indians polled in 2014 favored Modi as prime minister, a share that grew to 47 percent in 2019 but declined to 41 percent in 2024.53 In contrast, the share that preferred Rahul Gandhi for the top job nearly doubled from 14 percent in 2014 to 27 percent in 2024.
While it is widely expected that Modi will likely complete fifteen consecutive years as prime minister, the 2029 elections might bring additional changes. At present, there is no clarity as to the succession planning within the BJP. Home Minister Amit Shah and Uttar Pradesh Chief Minister Yogi Adityanath are both widely rumored to be possible successors if Modi were to step aside. Of course, the BJP’s internal deliberations on succession will hinge, at least in part, on the views of other Hindu nationalist groups, including the Rashtriya Swayamsevak Sangh (RSS)—which serves as the ideological guiding force for the Hindu nationalist movement—and other affiliated groups.
Second, how sustainable is INDIA, the opposition alliance? The seeds of the alliance date back to June 2023, when sixteen opposition parties first convened to discuss the prospects of constructing a grand opposition alliance that would seek to displace the BJP. In July of that year, more than two dozen parties formally announced a preelection alliance, although the precise seat-sharing arrangements for the 2024 election remained the subject of heated back-and-forth discussions for many months. Some of those arrangements were never consummated, and some alliance partners contested elections against one another in certain states (such as West Bengal and Punjab) while others, like the JD(U) of Nitish Kumar, defected to the BJP-led NDA ahead of the campaign. The ability of the opposition alliance to hang together will significantly impact both the format of political competition in key states and the BJP’s ability to exploit a divided opposition for electoral gain, something it skillfully accomplished in both 2014 and 2019. The degree of opposition unity was significantly higher in 2024 than in the prior two elections.
Finally, to what extent have the views of the median voter in India shifted in a more conservative direction that provides a sustained electoral advantage to the BJP? According to journalist Ravi Agrawal, the conventional wisdom is that by dint of his charisma, Hindu nationalist bona fides, and decisive leadership style, Modi was able to move the median voter in a more conservative direction.54 But in a perceptive essay published before the 2024 election, Agrawal raises a second possibility: Modi can best be understood not as a supply-side phenomenon but as a demand-side one. Put differently, Modi could be a lagging, rather than leading, indicator of changing political and social attitudes. According to this view, the Indian electorate’s preferences shifted pre-2014, and Modi is merely meeting the median voter where they have settled. If this is correct, it means that the BJP’s political dominance could have greater staying power, irrespective of Modi’s standing or political presence.
For now, in the immediate aftermath of the 2024 election result, it is clear that several aspects of the fourth party system have been called into question. But in large measure, its foundations remain intact.
The authors are grateful to Haley Clasen for editorial assistance and to Amy Mellon for design assistance. They also would like to thank Alana Brase, Aislinn Familetti, Annabel Richter, and Jocelyn Soly for additional help.

Director and Senior Fellow, South Asia Program
Milan Vaishnav is a senior fellow and director of the South Asia Program and the host of the Grand Tamasha podcast at the Carnegie Endowment for International Peace. His primary research focus is the political economy of India, and he examines issues such as corruption and governance, state capacity, federalism, and electoral behavior. He also conducts research on the Indian diaspora.
Caroline Mallory
Former Communications Assistant
Caroline Mallory is a former communications assistant at the Carnegie Endowment for International Peace. She is a former James C. Gaither Junior Fellow in the Carnegie South Asia Program.
Carnegie does not take institutional positions on public policy issues; the views represented herein are those of the author(s) and do not necessarily reflect the views of Carnegie, its staff, or its trustees.

Reading the purported correspondence of celebrity Ksenia Sobchak sheds light on her role within the system, and how journalism and politics function in Putin’s Russia.

Vladislav Gorin
Even if the terms of a ceasefire or peace settlement are satisfactory to most Ukrainians, the country’s democracy will face its fair share of challenges.
Petro Burkovskyi, Olexiy Haran
President Tshisekedi is implicating Washington in his pursuit of a third term. Staying silent may prove detrimental to the United States in the long run.

Christian-Géraud Neema
Direct democracy is the political wildcard in the state’s midterm election.


Mark Baldassare, Ian Klaus
Two divergent trends—Putin’s hardline vision of how to prosecute the war in Ukraine, and a growing desire for change in Russia—could tear the regime apart.

Tatiana Stanovaya