Indian Americans in a Time of Turbulence: 2026 Survey Results
A new Carnegie survey of Indian Americans examines shifting vote preferences, growing political ambivalence, and rising concerns about discrimination amid U.S. policy changes and geopolitical uncertainty.
Link Copied
By Milan Vaishnav, Sumitra Badrinathan, Devesh Kapur, Andy Robaina
Published on Feb 19, 2026
Summary
There are more than 5.2 million people of Indian origin residing in the United States today. Over the past few decades, much has been written about their elevated socioeconomic status, growing political profile, and engagement in everyday civic and political life.
One year into President Donald Trump’s second term, however, Indian Americans are confronting a convergence of cross-pressures that has recast their position in America’s social and political landscape. The new president’s actions have thrown U.S.-India relations into crisis, roiling what was once hailed as the “defining partnership of the twenty-first century.” On the domestic front, commentators have observed a notable rise in online hate speech and discrimination against Indian Americans. And yet, the 2024 presidential election saw a meaningful increase in the diaspora’s support for Donald Trump, weakening—though not overturning—the community’s long-standing embrace of the Democratic Party.
Taken together, these developments sharpen the challenge of understanding how Indian Americans are navigating electoral politics, policy change, and debates over identity and belonging in the United States, at a moment of unusual political flux.
To address this challenge, the authors conducted the 2026 Indian American Attitudes Survey (IAAS) in partnership with the research firm YouGov. The IAAS is a nationally representative online survey of 1,000 Indian American adults, conducted between November 25, 2025, and January 6, 2026, with an overall margin of error of ±3.6 percent. The survey builds on earlier IAAS waves conducted in 2020 and 2024 and provides a systematic portrait of Indian Americans’ partisan identities, vote preferences, policy priorities, evaluations of political leaders, and experiences with discrimination.
The principal findings of the study are summarized below:
Indian Americans offer a largely negative assessment of Trump’s second term. One year into Trump’s second term, large majorities of Indian Americans disapprove of his job performance, including his handling of the domestic economy, international economic policy, and immigration. Evaluations of Trump’s management of U.S.-India relations are also negative, though many respondents report having no opinion, underscoring the limited salience of foreign policy for electoral decisionmaking.
Indian Americans remain disproportionately Democratic, but their attachment to the party has weakened. Indian Americans continue to identify with the Democratic Party by wide margins, yet the share of Democrats has declined since 2020, while Republican identification has increased modestly over that period. Ideologically, the community clusters most heavily at the center of the ideological spectrum, with moderates representing the single largest group.
Widespread disapproval of Trump’s policies has not neatly translated to clear gains for Democrats. While a clear majority of Indian Americans supported the Democratic presidential ticket in 2024, Trump made notable gains compared to 2020, particularly among young men. In 2026, support for Trump has softened, but Democratic support has not rebounded commensurately, signaling rising dissatisfaction with both major parties.
Heightened exposure to discrimination is a defining feature of Indian American life. Indian Americans report widespread perceptions of bias, frequent encounters with online racism, and marked levels of personal harassment or discrimination. However, since 2020, there has been no significant change in the share of respondents reporting direct, personal experience with discrimination.
Discrimination is reshaping behavior but not prompting widespread exit from the United States. While many respondents report preemptively changing how they live, speak, or participate in public life to avoid harassment, most do not plan to leave the country, and a majority still recommend the United States for employment.
Reactions to symbolic political events reveal ideological polarization more than identity-based attachment. Indian Americans express substantial enthusiasm for New York City Mayor Zohran Mamdani, driven primarily by ideological concerns rather than shared ethnicity or religion. Conversely, public remarks by Vice President JD Vance regarding religion and marriage elicited strong negative reactions linked to concerns about religious inclusion, representation, and belonging.
Introduction
One year into Trump’s second term, Indian Americans find themselves confronting a convergence of electoral, policy, and identity-based convulsions.
A series of policy actions—from unprecedented tariffs to sweeping immigration curbs—has pushed U.S.-India relations into a period of heightened turbulence, placing at risk a quarter century of steadily deepening ties between the two democracies. At the same time, Indian Americans have experienced a marked uptick in online hate speech and discrimination. One independent report documented a worrying surge in anti-Indian content on X (formerly Twitter) in late 2025, identifying the United States as an “epicenter of anti-Indian digital racism.”
Compounding these dynamics is the growing visibility of Indian Americans in U.S. political discourse, often in ways that foreground questions of identity, religion, and belonging. From the election of high-profile political figures with diasporic ties to India—such as New York City Mayor Zohran Mamdani—to public controversies surrounding religion and interfaith marriage sparked by remarks from Vice President JD Vance, Indian Americans have increasingly found themselves in the center of and, at times, targeted in national political conversations.
All of this comes against the backdrop of shifting political winds. Indian Americans have long been among the most reliably Democratic-leaning groups in U.S. politics. That pattern persisted in 2024, but with notable erosion: Support for Donald Trump rose compared to 2020, narrowing the Democratic margin from roughly 70–20 to about 60–30. The shift marks a meaningful softening of the Democratic Party’s dominance amongst the Indian American electorate.
Taken together, these forces have created a moment of unusual political flux—one that calls for taking stock of Indian Americans’ changing political attitudes. In response, the 2026 Indian American Attitudes Survey (IAAS) seeks to provide a systematic assessment of how Indian Americans are navigating a period of electoral volatility, policy uncertainty, and heightened identity-based politics. The findings offer a timely portrait of a community grappling with a resurgence of nativism and attendant domestic political strains.
The 2026 IAAS is a nationally representative online survey of 1,000 Indian American adults, conducted between November 25, 2025, and January 6, 2026, in partnership with YouGov. The survey has an overall margin of error of ±3.6 percent and builds on earlier IAAS waves conducted in 2020 and 2024. All three waves are cross-sectional surveys; the IAAS is not a panel dataset and does not interview the same respondents over time. In addition, the 2026 survey incorporates a revised sample frame to better capture the growing population of mixed-race Indian Americans. As a result, comparisons across survey waves should be interpreted with appropriate caution.
This study addresses five questions regarding Indian Americans’ social and political attitudes and behavior:
How do Indian Americans evaluate the performance of Trump during the first year of his second term, including his handling of major policy domains and U.S.-India relations?
How can Indian Americans’ partisan identities, ideological orientations, and affective evaluations of parties and political leaders be characterized in 2026?
Which policy issues most strongly animate Indian Americans today?
How do Indian Americans respond to prominent political figures and symbolic events—such as the election of Zohran Mamdani and public statements by JD Vance on religion?
How do concerns about discrimination, inclusion, and opportunity shape political behavior and longer-term life choices?
Survey Overview
The data for this study are based on an original online survey—the 2026 Indian American Attitudes Survey—of 1,000 Indian American adult respondents. The survey was conducted by polling firm YouGov between November 25, 2025, and January 6, 2026. To ensure representativeness of the community, the sample includes both citizens and non-citizens.
YouGov recruited respondents from its proprietary panel comprised of 500,000 active U.S.-based residents. For the IAAS, only adult respondents (ages 18 and above) who identify as Indian American or as persons of Asian Indian origin were able to participate in the survey. YouGov employs a sample matching procedure to ensure that the respondent pool is broadly representative of the Indian American community in the United States. All the analyses in this study employ sampling weights to ensure representativeness.1 Unlike prior waves of the IAAS, the 2026 study explicitly incorporated multi-racial respondents into the sample to capture respondents belonging to more than one racial/ethnic community on account of intermarriage. As a result, one must exercise some degree of caution when examining trends over time.
The overall maximum margin of error for the survey data analyzed here is ±3.6 percent. This margin of error is calculated at the 95 percent confidence level. Further methodological details can be found in Appendix A, along with a state-wise map of survey respondents.
The survey instrument contains over forty questions organized across five modules: basic demographics; voting behavior; policy issues; identity and discrimination; and religion and politics. Respondents were allowed to skip questions except for certain demographic questions that determined the flow of other survey items.
Table 1 provides a demographic profile of the IAAS sample in comparison to the Indian American population as a whole. The latter relies on data from the 2024 American Community Survey (ACS) on the Asian Indian population in the United States.2 The ACS is an annual demographic survey conducted by the United States Census Bureau and is widely used to construct sample survey frames in the United States.
Evaluations of Trump 2.0’s First Year
This section assesses Indian Americans’ evaluations of Trump’s second term after his first year in office. Across measures of overall job approval, the handling of U.S.-India relations, and major policy domains, the findings reveal broad disapproval, sharp partisan polarization, and strong opposition to the administration’s immigration agenda.
Trump’s Approval
One year into his second term, Indian Americans broadly disapprove of Donald Trump’s performance as president (see figure 1). Seventy-one percent of respondents overall disapprove of the way Trump has handled his job as president, and 55 percent express strong disapproval.
Only 29 percent of respondents approve of Trump’s performance in the first year of his second administration, with 15 percent strongly approving of the job he’s done. These numbers are virtually identical to the evaluations Indian Americans made in 2020 upon the conclusion of his first term in office.
Table 2 places Indian Americans’ evaluations of Trump in comparative perspective by juxtaposing results from the 2026 IAAS with a contemporaneous nationally representative survey conducted by YouGov in December 2025. The comparison underscores that Indian Americans are substantially more critical of Trump than the general U.S. public, regardless of gender.
While a majority of Americans disapprove of Trump’s job performance, disapproval among Indian Americans is markedly higher—among both men and women. At the same time, approval of Trump is consistently lower among Indian Americans than among Americans overall. Together, these patterns suggest that Indian Americans’ assessments of Trump are distinctly more unfavorable than the overall U.S. population.
A similar pattern emerges when Indian Americans’ views are compared across major racial and ethnic groups in the broader U.S. population (see table 3). Indian Americans’ disapproval of Trump is substantially higher than that of White Americans and, while lower than among Black Americans, exceeds that observed among Hispanic Americans. In sum, these patterns underscore that Indian Americans’ evaluations of Trump are not merely a reflection of national partisan polarization but represent a distinctly more critical posture within the U.S. electorate.
General Policy Evaluations
Respondents were asked, in broad terms, to assess three aspects of the second Trump administration’s policy agenda: immigration policy, domestic economic policy (including inflation, taxes, and spending), and international economic policy (trade, tariffs, and sanctions).
Large majorities of Indian Americans disapprove of Trump’s handling of all three issues (see figure 2). Sixty-four percent disapprove of his immigration policy, 68 percent disapprove of his domestic economic policy, and 70 percent disapprove of his international economic policies. What is equally striking in these domains is the intensity of Indian Americans’ disapproval. A majority (or near-majority) do not simply disapprove of Trump’s policies, they strongly disapprove.
As one might expect, partisan differences in respondents’ evaluations are stark (see figure 3). Large majorities of Democrats disapprove of Trump’s policies across the board. Republicans, for their part, largely approve of Trump’s policies after his first year, reserving greatest support for his immigration policy (which is supported by 76 percent of self-identified Republicans).
Unpacking Immigration Policy
Given the speed and scale with which the Trump administration has moved on immigration issues, the 2026 IAAS includes a battery of questions which probe respondents’ views in greater detail. Specifically, the survey asks respondents to evaluate five distinct immigration maneuvers executed by the Trump administration: arresting undocumented immigrants with no criminal record, conducting workplace immigration raids, deporting immigrants to third countries (countries other than their country of origin), moving to end birthright citizenship, and levying a $100,000 fee on new H-1B (skilled worker) visa petitions.
Large majorities of Indian Americans disapprove of Trump’s agenda; this disapproval has not produced a commensurate consolidation around the Democratic Party.
In line with the previous figure, Indian Americans generally hold a dim view of Trump 2.0’s immigration actions across the board (see figure 4). Decisive majorities of Indian Americans oppose all these policies, with the most strident opposition focused on the deportation of immigrants to third countries—a policy 74 percent of respondents oppose. With respect to the levying of a $100,000 fee for H-1B visas—which are especially salient to the Indian American community (according to USCIS data, Indian-origin immigrants constituted 71 percent of new H-1B visa petitions in Fiscal Year 2024)—two-thirds of respondents oppose the action.
Support for the Trump administration’s immigration policies varies sharply by party affiliation (see figure 5). Democrats overwhelmingly oppose these measures, with support in the low double digits or even single digits in the case of deporting immigrants to third countries. Republicans are more divided but regularly supportive—particularly on enforcement-oriented actions. Notably, Republican support is weaker when respondents are asked about specific immigration policies rather than immigration policy in the abstract.
The one issue on which Republican Indian Americans appear most divided is the proposal to end birthright citizenship, a matter which is currently being debated in federal courts, where Republicans are nearly split on supporting and opposing the policy. Notably, Indian American Republicans express narrow majority support for new levies on high-skilled worker visas, a move which many immigrant advocates argue will disproportionately harm Indian-origin immigrants.
Taken together, these findings reveal a disconnect between policy evaluations and political alignment. While large majorities of Indian Americans strongly disapprove of Trump’s policy agenda, this disapproval has not necessarily produced a commensurate shift in ideological self-placement or partisan consolidation around the Democratic Party, as the next section of the report demonstrates.
Assessment of U.S.-India Relations
Views of how U.S.-India relations have been handled vary sharply by administration. Two trends are visible from figure 6. First, in the waning days of Joe Biden’s term in 2024, 48 percent approved of his handling of U.S.-India relations. This was far stronger than Indian Americans’ assessment of Trump in 2020—the last full year of his first term—when 35 percent supported his handling of relations with India.
Second, Trump’s approval on India has dipped considerably after the first year of his second term, when compared either to his first term benchmark or respondents’ assessments of Biden. The 2026 IAAS finds that only 20 percent of respondents approve of Trump’s handling of the India account, with 55 percent disapproving, reflecting the deterioration in U.S.-India relations since the onset of Trump’s second term. However, it is worth pointing out that one-quarter of respondents hold no opinion of Trump’s stewardship of U.S.-India relations—suggesting that the issue has low salience with many Indian Americans.
Aggregate assessments of Trump’s handling of U.S.-India relations mask sharp partisan divisions within the Indian American community (see figure 7). Among Democrats, opposition is overwhelming: Seven in ten disapprove of Trump’s stewardship of the bilateral relationship, with fewer than one in ten expressing approval. Republicans, by contrast, are far more favorable, with half approving of Trump’s handling of relations with India and only one-quarter disapproving. Overall evaluations fall between these partisan extremes, reflecting the community’s underlying partisan composition.
Partisan Identity, Ideology, and Political Affect
This section explores Indian Americans’ partisan identities, ideological orientations, and affective attitudes toward parties and political leaders. While the community continues to lean decisively Democratic, the data reveals modest shifts toward weaker partisan attachment, cooling affect toward political leaders and parties, and persistent affective polarization.
Partisan Identification
The 2026 IAAS reveals that Indian Americans continue to identify disproportionately with the Democratic Party, though the intensity of partisan attachment has weakened modestly over time.
As shown in figure 8, the share of respondents identifying as Democrats has declined steadily, falling from 52 percent in 2020 to 46 percent in 2026. The share of Indian Americans identifying as Republicans has increased four percentage points since 2020, from 15 to 19 percent. The share identifying as independents climbed four points between 2024 and 2026 (25 to 29 percent) and is up six points since 2020. Rather than redounding to the benefit of Republicans, it appears that the shift away from Democrats has increased the share of Indian Americans identifying as independents.3
Among citizens, the pattern is similar. Democrats outnumber Republicans by a wide margin, with approximately 48 percent of Indian Americans identifying with the Democrats compared to 20 percent of respondents affiliating with the Republicans. Independents account for roughly 28 percent of the citizen subsample.
Hindus are the most Democratic-leaning religious group, while Christians stand out as the most Republican-leaning, registering an increase in support between 2024 and 2026.
How does party identification vary based on respondents’ demographic characteristics, and how has the picture changed since 2024? Table 4 provides a breakdown based on age, education, household income, gender, religion, place of birth, year of arrival/birth in the United States, duration of stay, and U.S. region.
Five key takeaways stand out. First, younger Indian Americans (ages 18–29) shifted back toward the Democrats, while those over 50 moved in the opposite direction. This movement is notable given that young Indian Americans, particularly young men, swung toward Trump in 2024, according to that year’s IAAS. Second, education polarization has intensified since 2024. Democratic identification declined substantially among respondents without a college degree (from 48 to 35 percent), while remaining stable among college graduates. Republicans, for their part, made gains among less-educated respondents, mirroring patterns in the general American population. Third, income polarization has also grown since the last presidential election, with Democrats consolidating gains among the richest households while losing ground among others. Respondents with a household income above $100,000 moved toward the Democratic Party (46 to 51 percent), while Democratic identification fell sharply among those making between $50,000 and $100,000 as well as those making below $50,000. Republicans posted modest gains among respondents in these latter two groups. Fourth, religious affiliation continues to shape partisan identity, but not uniformly.
Hindus are the most Democratic-leaning religious group, while Christians stand out as the most Republican-leaning—and the only subgroup registering a substantial Republican increase between 2024 and 2026. Finally, those who came to, or were born in, the United States within the past two decades show growth in Democratic identification, while support for the Democrats has dipped among longer-settled Indian Americans.
Ideological Self-Placement
When it comes to ideology, Indian Americans cluster most heavily in the center. As shown in figure 9, 32 percent of Indian Americans identify as moderates, a four percentage point increase from 2024.
This rise in moderates coincides with a modest decline in the share of Indian Americans identifying as liberal, which fell from 25 percent in 2024 to 21 percent in 2026, the same level as in 2020. Overall, the share of respondents who place themselves on the liberal end of the spectrum (including those who are “extremely” or “slightly” liberal) has not budged much over the past six years.
Twenty-two percent of respondents identify as conservative, albeit with differing levels of intensity. Those identifying as extremely conservative constitute three percent of the sample, the smallest slice of the Indian American population. Taken together, these findings suggest that Indian Americans are best characterized as centrist with a left-of-center tilt, with those representing the extremes on either side of the ideological spectrum accounting for no more than 15 percent of respondents in 2026.
Political Affect
To probe respondents’ views on key political leaders and the two major national parties, the survey collected responses to a feeling thermometer, whereby respondents were asked to rate political parties or individual leaders on a scale of 0 to 100—a technique popularized by the American National Election Studies. Ratings between 0 and 49 mean that respondents do not feel favorable (or feel “cold”) toward the person or entity, a rating of 50 means that respondents are indifferent toward them, and ratings between 51 and 100 degrees mean that respondents feel favorable (or “warm”) toward them. The questions probe respondents’ views on the Democratic and Republican Parties as well as Trump, Vice President JD Vance, 2024 Democratic presidential nominee Kamala Harris, and Usha Vance—the Second Lady of the United States.
In 2026, most Indian Americans appear to feel generally less positive about all major political leaders and parties, apart from Republican identifiers (see figure 10).
The Democratic Party receives a rating of 53, down from 60 in 2024, while Harris saw a ten point decline in her favorability (from 62 to 52). The Republican brand fares worse; respondents give the Republican Party a rating of 34, down from 41 in 2024. Trump and Vance, both of whom were rated 40 in 2024, slide to 32 in 2026. Usha Vance receives a higher rating of 39, down from 45 in 2024.
Despite these declines, affective polarization remains pronounced among members of the community. As shown in figure 10, Democrats rate their party and Harris much more warmly than their Republican counterparts. The opposite is also true, with one caveat: Democrats tend to rate Republicans more harshly than Republicans rate Democrats, apart from Usha Vance.
When one explores how Indian Americans react to the two parties, Trump, and Harris over the past six years, a clear downward trajectory is readily discernible. Apart from how Indian American Republicans view the Republican Party and Trump, all others offer lower ratings of these key individuals and parties in 2026 than in 2020 (see figure 11).
Indian American Republicans have consistently rated their party 72 across the three waves of the IAAS. Notably, Trump’s ratings increased from 68 in 2020 to 78 in 2024, before leveling off at 72 in 2026. Nearly all other evaluations, with a few exceptions, have witnessed a steady drop-off between 2020 and 2026.
This cooling could spell potential trouble for Democrats. While Republican identifiers remain consistently positive toward their party, the Democratic Party has seen declining evaluations even among Indian Americans who continue to vote Democrat.
Partisan Disaffection
Given the Democratic lean of Indian Americans, the survey asked respondents who identified either as Democrats or independents why they did not identify as Republicans. Conversely, it also asked Republicans and independents about why they did not identify with the Democratic Party. Respondents were shown a list of possible reasons for their political leanings (drawn from the existing literature and media reporting) and then were asked to rank their top two reasons. Figure 12 compares responses for non-Republican identifiers in 2026 to those obtained in 2024.
In the 2026 IAAS, 27 percent of non-Republican identifiers reported that they do not support the Republican Party because it is intolerant of minorities. This is a ten percentage point increase from 2024. That year, 19 percent (the highest percentage for any issue) of respondents said that they did not identify as Republicans because the party did not support their view on abortion and reproductive rights. That issue decreased in salience in 2026, dipping to 11 percent. The second most popular response is that the Republican Party today is too influenced by Christian evangelicalism (15 percent).
Evaluating the top two most important issues for respondents, economic issues dominate while foreign policy concerns have limited salience.
Among respondents who do not identify as Democrats, the most cited reason for withholding support from the Democratic Party is that the party is too influenced by its left-wing (19 percent) (see figure 13).
The most salient issue in 2024, in turn, was immigration, with 28 percent reporting that the Democratic Party is weak on illegal immigration. In 2026, that percentage declined to 17 percent, roughly the same share of respondents who state that the Democratic Party does not pursue their preferred economic policies (17 percent), that the Democratic Party is too soft on crime (16 percent), or that the Democratic Party is too influenced by identity politics (16 percent).
Policy Priorities
Economic issues dominate Indian Americans’ policy priorities (see figure 14). When asked which is the most important policy issue for them personally, inflation and prices rank as the most important issue (21 percent), followed by jobs and the economy (17 percent). Health care (13 percent) and immigration (11 percent) are the only other issues in the double digits.
As previous iterations of the IAAS have demonstrated, foreign policy concerns tend to have limited salience in people’s minds when making political evaluations: Four percent name national security and another two percent name U.S.-India relations as their most pressing issues.
A similar picture emerges when one evaluates the top two most important issues for respondents. Once more, economic issues dominate, with inflation/prices and jobs/the economy named by 37 percent and 33 percent of respondents, respectively. These findings underscore the continued primacy of pocketbook concerns in shaping political preferences.
Voting Patterns
This section analyzes Indian Americans’ presidential vote preferences over time and across demographic groups. The results suggest continued Democratic dominance, but with signs that the 2020 election may have been an outlier rather than a durable baseline.
Presidential Vote Choice
Respondents were asked who they would vote for in a hypothetical rerun of the 2024 presidential election. Indian Americans continue to favor Democratic presidential candidates by large—albeit shrinking—margins (see figure 15).
In 2020, 68 percent of citizens intended to vote for Democrat Joe Biden while 22 percent favored Trump. Four years later, that margin shrank: In 2024, 62 percent favored Harris while 30 percent backed Trump. One year later, the share of respondents who would vote for Harris declined further to 57 percent, while support for Trump eroded as well—falling to 25 percent. The share of those who would vote for (an unspecified) third candidate doubled from 2024, from five percent to ten percent. Five percent of respondents report that they would not vote at all if the U.S. presidential election were held today.
Trump’s support among young men has fallen by roughly sixteen percentage points while his support among young women has fallen nearly ten percentage points.
These trends point to some erosion in Democratic dominance, with Republican support higher than in 2020 but somewhat lower than in 2024. Despite deep dissatisfaction with Trump’s policies in his second term, his support among Indian Americans remains no lower than it was in 2020. This pattern suggests that policy evaluations (discussed in greater detail in the next section) are not being translated straightforwardly into vote choice, or that 2020 represented an unusually favorable electoral context for Democrats rather than a stable baseline of partisan preference.
The 2024 IAAS uncovered a striking interaction between age and gender (see table 5). While women were much more likely to vote for Harris over Trump, this dynamic was especially pronounced when one disaggregated the data by age. Younger men (those between the ages of 18 and 39) moved sharply in favor of Trump, with 40 percent supporting him in 2024—a level much higher than older men and women of all ages.
By early 2026, several interesting dynamics were visible. First, Trump’s support among young men has dropped substantially, from 40 percent in 2024 to 24 percent in 2026. Second, Trump’s support has also fallen nearly ten percentage points among young women (between the ages of 18 and 39) from 25 to 16 percent. Third, Trump’s support has modestly grown among women above the age of 40 while holding steady among older men. Fourth, the impacts for Harris are mixed. While support for her remains steady among younger women and has grown among younger men, it has declined substantially among older men and women alike.
Perceptions and Experiences of Discrimination
Discrimination shapes Indian Americans’ experiences in the United States in complex ways, influencing not only how they view society but how they navigate daily life. This question takes on renewed salience amid heightened immigration enforcement, intensified political rhetoric around identity and religion, and a sharp increase in online hate targeting Indian communities since the start of 2025. This section documents perceptions of bias, direct experiences of discrimination (the prevalence of which has remained largely stable), the specter of online racism, and the behavioral and potential migration responses that follow.
Perceived Discrimination
Indian Americans perceive significant discrimination against a wide range of social groups in American society today. To mitigate concerns about social desirability bias that can arise when respondents are asked only about discrimination against their own group, the survey asked respondents to assess perceived discrimination across multiple social groups, specifying whether each faced a lot, some, little, or no discrimination (see figure 16). A majority of respondents (55 percent) believe there is a lot of discrimination against undocumented immigrants, followed by Muslims (46 percent) and Black people (43 percent). Perceived discrimination against Indian Americans themselves is more moderate but still substantial, with roughly one-quarter (27 percent) believing their group faces a high level of discrimination—a notable share for a community often characterized by high rates of economic success and social and political incorporation.
Perceptions vary across immigrant status, religion, and race. For instance, discrimination against Sikhs (28 percent), Hindus (23 percent), and Asian (non-Indian) people (20 percent) is seen as significantly less severe than that faced by Muslims or undocumented immigrants. Nevertheless, these groups are viewed as experiencing meaningful levels of bias.
Personal Experiences of Discrimination
Moving beyond perceptions of group-level discrimination, the survey also asked whether respondents felt personally discriminated against since the start of 2025 (see figure 17). One in two respondents reported discrimination, on varying grounds, over the course of the last year.
Among those who report personal discrimination, skin color emerges as the most frequently cited reason (36 percent), followed by country of origin (21 percent), and religion (17 percent). Gender-based discrimination is also reported by a notable minority (16 percent), while caste-based discrimination is reported far less frequently (5 percent).
These numbers have remained remarkably consistent over the last three survey waves (see figure 18). In 2020, 2024, and 2026, nearly identical shares of Indian Americans—roughly half—reported personal experiences with discrimination. In addition, the axes of discrimination have also remained roughly stable over time, with the prevalence of discrimination based on skin color and country of origin modestly rising in recent years. This suggests that while some forms of hate—such as online harassment—may be rising, the overall prevalence of reported in-person discrimination has remained stable, rather than increasing in tandem. One possibility, further discussed below, is that this reflects respondents exercising prior restraint or self-censorship to avoid situations where they might be subject to harassment.
For respondents who faced discrimination in 2025, the survey delved deeper into the settings in which discrimination took place (see figure 19).
Respondents were presented with a list of public or institutional settings and asked to select the settings in which they felt discriminated against. If the relevant option was not listed, respondents were given the choice to select “some other setting.” Respondents most often report incidents in stores or malls (42 percent) or while applying for jobs (38 percent). These settings were followed by participating in cultural or religious activities (31 percent), interacting with healthcare providers (21 percent), and dealing with police (21 percent). Twelve percent selected the option indicating they had been discriminated against in some other setting.
Online Racism and Offline Realities
Exposure to racist content on social media platforms is also widespread. There has been a sharp uptick in anti-Indian and anti-Indian American racism on the Internet and various social media platforms such as X. Yet the extent to which ordinary Indian Americans who might not be highly online see these forms of online hate is still an open question.
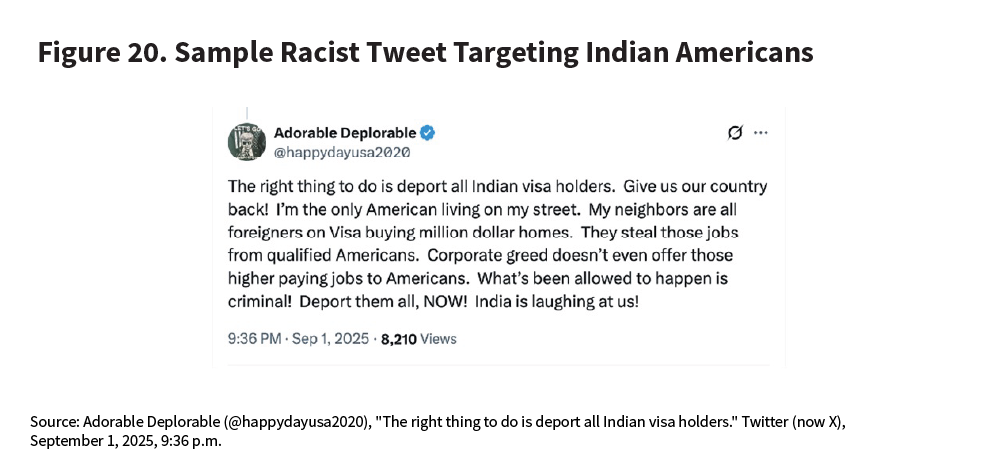
To explore this, the survey presented respondents with a tweet which explicitly targeted Indian Americans (see figure 20).
To begin, it asked respondents how often they have seen messages like this on social media. Forty-eight percent, or roughly half, of respondents report encountering racist posts targeting Indians or Indian Americans very or somewhat often since the start of 2025. Forty-one percent report that they see such content not very often or very rarely, while a small minority (11 percent) report not using social media at all. These findings underscore the prevalence of online environments as a fertile site of racial hostility, perhaps even for those who may not experience frequent in-person discrimination.
Since the start of 2025, one in four respondents have been called a slur.
Racist social media content elicits strong negative emotional responses from Indian Americans (see figure 21). Half of all respondents report feeling angry when encountering such posts, while one-third report feeling anxious (33 percent) or fearful (31 percent). One in five (26 percent) report feeling hopeless.
As one might expect, positive emotional responses to hateful messages are exceedingly rare—though they are present. Fewer than one in ten report feeling hopeful (7 percent), happy (6 percent), or satisfied (5 percent). Eighteen percent report not experiencing any of the enumerated emotions. Overall, the emotional reaction of Indian Americans is—as expected—overwhelmingly negative.
Anti-Indian hate is not necessarily confined to the online arena; a substantial minority of Indian Americans report direct experiences with harassment or hostility (see figure 22). Since the start of 2025, one in four respondents have been called a slur. Other experiences are less common but still notable: Nine percent report that they have been physically threatened, 8 percent report receiving hate mail, 6 percent report property damage, and 4 percent have been victims of some kind of physical assault. Roughly one in eight report experiencing some other form of harassment.
Taken together, the findings suggest that while violence remains relatively uncommon, everyday verbal abuse and intimidation are experienced by a meaningful share of the community.
Behavioral Responses to Discrimination
Concerns about discrimination can extend beyond direct experiences to shaping an individual’s behavior. For instance, a person may preemptively choose not to engage in an activity that exposes them in some way for fear of being harassed or targeted. To explore this possibility, the survey asked respondents whether, since the start of 2025, they avoided certain activities due to a concern about discrimination or racism directed towards Indians or Indian Americans.
The results suggest that Indian Americans are changing their behavior in anticipation of possible harassment (see figure 23). Nearly one-third of respondents (31 percent) report avoiding discussing or engaging with politics on social media due to fear of discrimination or racism. This is the single most avoided activity.
Other forms of behavioral modification are also widespread. Roughly one-fifth (21 percent) report avoiding leaving and re-entering the United States, refraining from displaying political signs or bumper stickers (21 percent), or avoiding publicly wearing Indian dress or attire (19 percent). Eighteen percent also report avoiding political rallies or protests.
These patterns indicate that concerns about discrimination have real-life consequences for civic participation, public expression, and everyday mobility.
Migration Possibilities
Considering the rise in anti-Indian sentiment, coupled with the fact that many Indian Americans are immigrants who do not have U.S. citizenship or are new arrivals with limited roots in the country, the survey asked respondents how often they have thought about leaving the United States altogether and moving to another country (see figure 24).
A small minority of respondents—14 percent—say they have thought about leaving the United States frequently, while 26 percent have occasionally thought about it. By contrast, 37 percent say they have never considered leaving and 22 percent report they have only rarely considered it.
For those respondents who have ever considered leaving (be it frequently, occasionally, or rarely), the survey explored the reasons why (see figure 25). Interestingly, the most cited reason is frustration with U.S. politics, mentioned by nearly six in ten respondents (58 percent). This is followed closely by concerns about the cost of living (54 percent) and personal safety (41 percent).
Professional and family considerations also play a role, albeit to a lesser extent. Roughly one-quarter cite better career opportunities abroad or family considerations as key motivating factors. Twenty percent of respondents cite immigration obstacles, indicating that legal uncertainty remains a nontrivial push factor. An additional 8 percent cite other factors in their decisionmaking.
When thinking about leaving the United States, most respondents do not envision returning to India. Of the respondents who have contemplated leaving the country, one in four cited India as their potential destination. Sixty-two percent named some other country, and 13 percent were unsure. Overall, this pattern suggests that dissatisfaction with life in the United States does not necessarily translate into return migration to India, but rather into consideration of third-country destinations.
To assess behavioral responses in a different way, the survey presented respondents with two vignettes involving fictional characters and asked how they would advise would-be immigrants thinking about a life in America. In the first scenario, respondents were told that Priya, a recent graduate of Delhi University, is choosing between competitive universities in the United States and the United Kingdom for a master’s degree. They were asked which school they would recommend (see figure 26).
Forty-two percent of respondents reported they would advise Priya to attend university in the United States, while 37 percent said they would suggest she attend school in the United Kingdom. Another 20 percent was unsure.
In a second scenario, respondents were asked to advise Rishi, a hypothetical professional considering a transfer from India to the United States, about applying for a visa to work in the United States or to remain in India. As figure 26 demonstrates, nearly two-thirds (62 percent) recommend that Rishi apply for a U.S. work visa, while fewer than one-quarter (23 percent) advise remaining in India (another 14 percent was not sure).
Taken together, these findings suggest that perceived opportunities in the United States continue to outweigh concerns about discrimination for many respondents, particularly in professional contexts. However, there are mixed views. Respondents slightly favor the United States in an educational context compared to the United Kingdom, but strongly endorse the United States in a professional context if the alternative is remaining in India.
Attitudes Toward Zohran Mamdani
The November 2025 election of Zohran Mamdani as New York City mayor provided a useful case for exploring how Indian Americans evaluate a prominent U.S. political figure who combines progressive ideology with diasporic lineage. This section uses survey evidence to parse the relative roles of ideology, identity, and symbolic representation in shaping political attitudes within the Indian American community.
Enthusiasm Toward Mamdani
Indian Americans express substantial enthusiasm for Zohran Mamdani’s recent electoral victory in New York City (see figure 27). Nearly seven in ten respondents (68 percent) reported that they were either very or somewhat enthusiastic about his victory, while 22 percent said they were unenthusiastic about his election as mayor. One in ten respondents expressed no opinion.
Unsurprisingly, a large majority of Democrats (87 percent) were enthusiastic about Mamdani’s victory. What is striking is that the proportion of Republicans that are unenthusiastic about Mamdani’s victory is virtually equivalent to the proportion that are enthusiastic—45 percent and 44 percent, respectively.
Among Indian Americans who express enthusiasm about Zohran Mamdani’s electoral victory, support is driven primarily by enthusiasm about how Mamdani will govern (see figure 28).
Forty-four percent of enthusiastic respondents report that they are enthusiastic about Mamdani because he will govern as a liberal/progressive. This is followed by perceptions of Mamdani as a young politician (26 percent) and his Muslim faith (9 percent).
Interestingly, among respondents who are unenthusiastic about Mamdani’s victory, his ideological inclinations also loom large. Thirty-six percent of respondents who are unenthusiastic about him state that Mamdani is too liberal/progressive. Identity-related concerns appear more salient among critics than supporters: Roughly one-fifth of unenthusiastic respondents cite Mamdani’s Muslim identity (22 percent), while 15 percent point to perceptions that he is an inexperienced politician.
Taken together, these patterns suggest that Mamdani’s candidacy polarizes Indian Americans primarily along ideological lines, with identity considerations playing a secondary but asymmetric role—more prominent among skeptics than supporters.
Characterizing Mamdani’s Background
Respondents exhibit significant differences in terms of how they characterize Mamdani’s background (see figure 29).
Twenty-eight percent identify Mamdani as a Muslim while another 27 percent view him as an American with immigrant parents. Fifteen percent principally view Mamdani as someone of Indian origin and 14 percent identify him as someone of South Asian origin. Only 5 percent view Mamdani primarily through the lens of his Ugandan origins. Eleven percent of respondents report not knowing who Mamdani is, indicating a nontrivial level of uncertainty or unfamiliarity.
These results underscore that Mamdani is perceived through multiple overlapping identity frames—religious, national, and immigrant—rather than a single dominant descriptor.
Interpreting Mamdani’s Influence
To assess the larger question of Mamdani’s influence, the survey probes how Indian Americans evaluate the broader consequences of electing politicians like Zohran Mamdani. The 2026 IAAS asked respondents whether electing more officials like Mamdani would: result in policies that benefit them; strengthen the Indian American community’s status; strengthen the Hindu community’s status; and divide the Indian American community.
Representation and influence are widely embraced, but not all respondents agree on which forms of representation unify versus divide the community.
Indian Americans hold generally optimistic views about the broader implications of electing officials like Mamdani (see figure 30).
Large majorities of respondents agree that electing more politicians like Mamdani would strengthen the status of the Indian American community (73 percent) and result in policies beneficial to respondents personally (68 percent).
Fifty-nine percent of respondents feel that Mamdani’s win will strengthen the Hindu community’s status—an intriguing finding given that Mamdani identifies as a Muslim. However, expectations diverge when it comes to intra-community cohesion. Forty-five percent of respondents report that electing more officials like Mamdani would divide the Indian American diaspora. These findings underscore a tension: Representation and influence are widely embraced, but not all respondents agree on which forms of representation unify versus divide the community.
Reactions to JD Vance’s Statement
This section examines Indian Americans’ reactions to a recent public statement by JD Vance concerning religion and marriage, using it as a lens to assess broader views on religious inclusion, pluralism, and representation in American politics.
At an October 2025 event on the campus of the University of Mississippi, Vance was asked about his Christian faith and the links between Christianity and patriotism in America. As part of his response, Vance mused about his interfaith marriage and the fact that his wife, Usha, was raised in a Hindu household: “Do I hope, eventually, that she is somehow moved by the same thing I was moved by in church? Yes. I honestly do wish that, because I believe in the Christian gospel and I hope that eventually my wife comes to see it the same way.”
The comments went viral on social media and prompted a raft of stories about interfaith marriage in the United States, many of which included critical comments from Hindus who felt that the vice president was denigrating the Hindu religion.
The findings suggest broad unease with public expressions that appear to normalize religious conversion expectations within marriage.
The IAAS presented respondents with five statements about Vance’s comment and inquired to what extent they agreed or disagreed with each (see figure 31). Indian Americans are strongly divided on whether the statement is “normal” for someone committed to their faith, with 53 percent stating it was normal while 47 percent disagreed.
On the other hand, clear majorities of Indian Americans agree that the statement raises broader concerns about religious inclusion and representation in American public life. Roughly three-quarters of respondents (73 percent) say the statement makes them feel that Indian Americans need stronger representation in U.S. politics, and a similar share (71 percent) report feeling uncomfortable about how Indian religious backgrounds are viewed in American society. Even more striking, more than four in five respondents (82 percent) agree with the statement that politicians should be careful about making public statements regarding their spouse’s religious beliefs. Concomitantly, two-thirds of Indian Americans do not think it is reasonable to expect one’s spouse to convert to one’s religion. Overall, the findings suggest broad unease with public expressions that appear to normalize religious conversion expectations within marriage—particularly when voiced by prominent political figures.
Attitudes toward spousal religious conversion vary sharply by religious affiliation (see figure 32).
Large majorities of Hindu (77 percent) and religiously unaffiliated (75 percent) Indian Americans reject the notion that it is reasonable to expect one’s spouse to convert. Muslim respondents are more divided, though a clear majority (57 percent) still oppose spousal conversion expectations. Christians stand apart as the only group in which a majority (57 percent) agrees that it is reasonable to expect a spouse to convert, highlighting a distinct normative orientation around religion and marriage within this subgroup.
Regarding interfaith marriage more generally, 72 percent of respondents either strongly or somewhat support the abstract notion of marriages between two people of different faiths. A distinct minority—16 percent—state they are opposed to interfaith marriage, while an additional 12 percent do not have an opinion either way.
Conclusion
The 2026 IAAS portrays a community that remains deeply engaged with U.S. politics but appears increasingly unsettled about its direction. Indian Americans continue to lean decisively toward the Democratic Party, yet the intensity of their partisan attachment has softened while their ideological self-placement has drifted toward the center. While Trump’s appeal has dimmed since the November 2024 election, this has not necessarily led to symmetrical gains for Democrats or erosion for the Republicans.
At the same time, the survey underscores the continued primacy of domestic concerns in shaping political attitudes. Economic issues—especially inflation and jobs—dominate respondents’ policy priorities, while immigration policy stands out as a focal point of opposition to the Trump administration’s second term. Foreign policy, including U.S.-India relations, remains of secondary concern for most respondents, even as dissatisfaction with Washington’s handling of India has grown. This pattern reinforces a consistent finding of the IAAS: Indian Americans, like most Americans, evaluate politics primarily through the lens of pocketbook concerns rather than diasporic or foreign policy considerations.
Questions of identity, representation, and belonging also loom large among the diaspora. Widespread perceptions of discrimination, coupled with exposure to online and offline harassment, have shaped and constrained public behavior for many Indian Americans. At the same time, the survey paints a more complex picture of life in the United States. While a minority of Indian Americans report considering emigration—often citing frustration with U.S. politics, cost of living, or personal safety—most do not envision returning to India, and many continue to recommend the United States for education and employment when presented with hypothetical scenarios.
Taken together, these findings suggest that one year into Trump’s second term, concerns about discrimination and the broader political climate coexist with enduring perceptions of opportunity. Whether this balance will hold as political transformations in the United States continue remains an open question.
Appendix A: Methodology
Respondents for this survey were recruited from an existing panel administered by YouGov. YouGov maintains a proprietary, double opt-in survey panel comprised of 500,000 U.S. residents who are active participants in YouGov’s surveys.
Online Panel Surveys
Online panels are not the same as traditional, probability-based surveys. However, due to the decline in response rates, the rise of the internet, smartphone penetration, and the evolution in statistical techniques, nonprobability panels—such as the one YouGov employs—have quickly become the norm in survey research.4 YouGov’s surveys have been repeatedly found to be among the most reliable in predicting U.S. voting behavior due to their rigorous methodology, which is detailed below.
Respondent Selection and Sampling Design
The data for this paper are based on a unique survey of 1,000 people of Indian origin. The 2026 wave of the IAAS explicitly incorporated multi-racial respondents into the sample to capture respondents belonging to more than one racial/ethnic community on account of intermarriage. The survey was conducted between November 25, 2025, and January 6, 2026. To provide an accurate picture of the Indian American community writ large, the full sample contains both U.S. citizens and non-U.S. citizens. However, the analyses pertaining to presidential vote choice consider the U.S. citizen subsample (N=870).
Sample Matching
To produce the final dataset, respondents were matched to a sampling frame on gender, age, race, and education. The sampling frame is a politically representative “modeled frame” of Indian American U.S. adults, based upon the 2024 American Community Survey (ACS) public use microdata file.
The matched cases were weighted to the sampling frame using propensity scores. The matched cases and the frame were combined, and a logistic regression was estimated for inclusion in the frame. The propensity score function included age, gender, race/ethnicity, years of education, and region. The propensity scores were grouped into deciles of the estimated propensity score in the frame and post-stratified according to these deciles.
The weights were then post-stratified on three-way stratification of gender, age (4-categories), and education (4-categories), to produce the final weight.
Data Analysis and Sources of Error
All the analyses for this paper were conducted using the statistical software R and employed sample weights to ensure representativeness.
With the exception of the data on presidential vote choice or unless otherwise noted, the analyses in this study utilize the entire sample of respondents (N=1,000), which has a margin of error of ±3.6 percent.
All margins are calculated at the 95 percent confidence level.
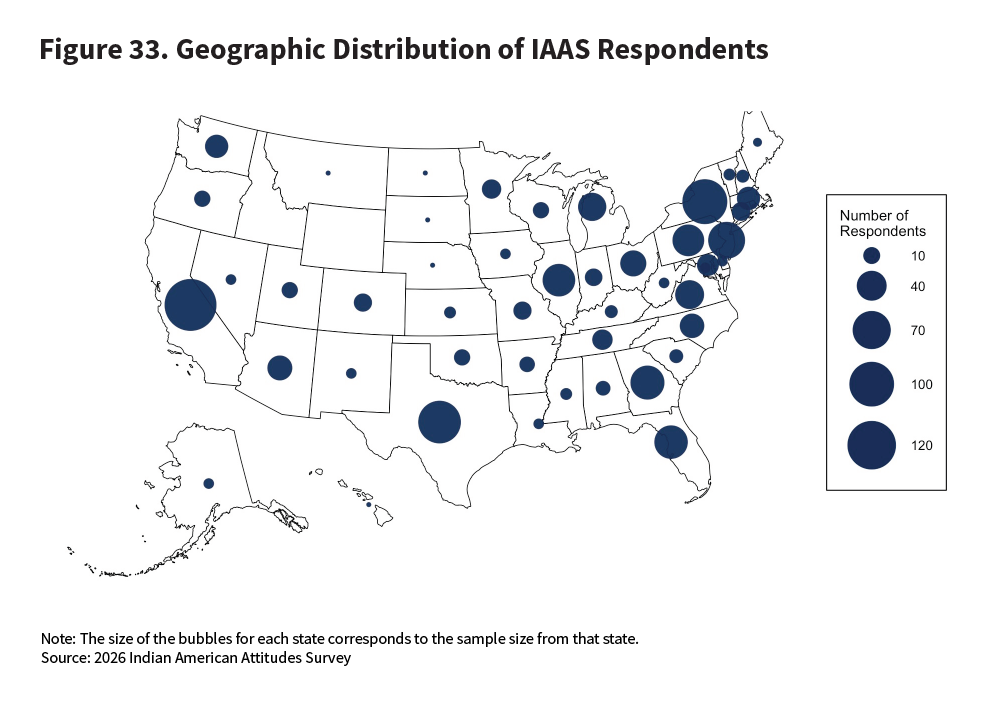
Figure 33 provides the geographic distribution of survey respondents by state of residence.
Acknowledgments
We would like to acknowledge numerous individuals and organizations for making this study possible. Andy Robaina was the principal data analyst for this paper. Andy’s hard work and careful attention to detail made this paper possible. We are grateful to Alexander Marsolais, Clara Cullen, Alexis Essa, and their colleagues at YouGov for their help with the design and execution of the survey.
This project has been reviewed and approved by the American University Institutional Review Board (Protocol #IRB-2025-32).
At Carnegie, we owe special thanks to Robin McCoy for swift but meticulous editing of this publication. We would also like to acknowledge Amy Mellon and Jocelyn Soly for contributing their graphic design talents to the data visualization contained in this paper. Sharmeen Aly, Alana Brase, Aislinn Familetti, Clarissa Guerrero, Helena Jordheim, Jessica Katz, Kate Keelan, Paige Rotunda, and Cameron Zotter contributed design, editorial, outreach, and production assistance.
While we are grateful to all our collaborators, any errors found in this study are entirely the authors’.
About the Authors
Sumitra Badrinathan is an assistant professor of political science in the Department of Politics, Governance, and Economics at American University’s School of International Service.
Devesh Kapur is Starr Foundation Professor of South Asian Studies at the Johns Hopkins School of Advanced International Studies (SAIS).
Andy Robaina is a James C. Gaither Junior Fellow with the South Asia Program at the Carnegie Endowment for International Peace.
Milan Vaishnav is a senior fellow and director of the South Asia Program and the host of the Grand Tamasha podcast at the Carnegie Endowment for International Peace.
Milan Vaishnav is a senior fellow and director of the South Asia Program and the host of the Grand Tamasha podcast at the Carnegie Endowment for International Peace. His primary research focus is the political economy of India, and he examines issues such as corruption and governance, state capacity, federalism, and electoral behavior. He also conducts research on the Indian diaspora.
Sumitra Badrinathan
Assistant Professor of Political Science, American University
Sumitra Badrinathan is an assistant professor of political science at American University’s School of International Service.
Devesh Kapur
Starr Foundation Professor, Johns Hopkins (SAIS)
Devesh Kapur is the Starr Foundation Professor of South Asian studies at the Johns Hopkins School of Advanced International Studies (SAIS). He is the author of three books on migration, including The Other One Percent: Indians in America (with Sanjoy Chakravorty and Nirvikar Singh).
Andy Robaina
James C. Gaither Junior Fellow, South Asia Program
Andy Robaina is a James C. Gaither Junior Fellow in the Carnegie South Asia Program.
Carnegie does not take institutional positions on public policy issues; the views represented herein are those of the author(s) and do not necessarily reflect the views of Carnegie, its staff, or its trustees.
More Work from Carnegie Endowment for International Peace
As AI grows more sophisticated, as the supply chains that power it become more contested, and as access to frontier models becomes geopolitically charged, India must begin to ask a different set of questions. Not what applications it can build on someone else’s infrastructure but what the world needs.
As India undergoes a demographic transition, its cities will be its economic powerhouse—but only if it accurately captures city growth and empowers cities to support their citizens.
Even if the terms of a ceasefire or peace settlement are satisfactory to most Ukrainians, the country’s democracy will face its fair share of challenges.